Credibility
Credibility
‘So, I don’t see the “stag” or the “flation.” ’ - Jay Powell


"The Fed's credibility as an inflation fighter was lost," then-Fed governor Ben Bernanke said in a 2003 speech (speaking about the 1970s). "The unmooring of inflation expectations greatly complicated the process of making monetary policy; in particular, the Fed's loss of credibility significantly increased the cost of achieving disinflation."
This week was the big inflation week. Thus, the theme of my LinkedIn posts this week focused on the lead up and follow through of that data. However, in looking at the other data that came out, I started to see a pattern. So, I posted a second LinkedIn post on Thursday. It happened to get more engagement than any other post this week (or last week). Tells me there is some interest on this topic. This was the short, but sweet, post:
Provocative thought of the day:
JayPo and the FOMC say they don't see any stag or any flation so they don't understand why all of the discussion about stagflation
Yet this week we have seen:
Growth: Empire Manufacturing worse, Philly Fed worse, NAHB housing worse, Building permits worse, retail sales worse, Manufacturing production worse
Inflation: PPI higher, Import prices higher, CPI inline but yoy core still 3.6%
Jobs: jobless claims higher, more importantly, continuing claims much higher
Maybe not there yet, but not trending in the right direction, is it?
Stay Vigilant
#markets #investing #finance #stagflation #stayvigilant
Given the interest in the topic, I thought I might write about it this week. I touched on it a couple weeks ago after that Jay Powell quote (in the subheader) from the FOMC press conference. I feel like karma is a boomerang, and he is taking on the market gods by saying what he did. More importantly, I think the quote suggests he is at risk of losing (more) credibility, the same way he did when he suggested inflation was ‘transitory’ back in 2021. At that time, I said it wouldn’t be. I still think it isn’t.
When people say stagflation, most think of the 1970s version. That is an extreme version of it, the way the Great Depression was an extreme version of a recession. Stagflation is an economic cycle characterized by slow growth and a high unemployment rate accompanied by inflation. This doesn’t mean we need to have double digit inflation and double-digit unemployment. It doesn’t even mean growth has to go negative.
I teach the investment clock to the students in my portfolio management class. It uses a quadrant approach to describe various economic scenarios based on whether growth is rising or falling and whether inflation is rising or falling. Stagflation is when inflation is high, but growth is low or negative.
Ray Dalio popularized this approach in the creation of his All-Weather Fund. He is not the only one. In my class, I also show the students reports from JP Morgan, Citi, Julius Baer, GaveKal, and even the dean of valuation, Aswath Damodaran at NYU. All describe their allocation and valuation approach in terms of this growth vs. inflation framework.
However, as I said above, we may be approaching a period when growth is slow if not going negative, inflation is staying stubbornly high, and unemployment is rising. Let’s look at each of these, starting with inflation which was my focus this week.
INFLATION
Ahead of the CPI on Wednesday, I put out a post on Tuesday that I think hits at the heart of the inflation issue, especially in an election year. Academics and market practitioners will debate about whether CPI is rising or falling by 0.1% & celebrate when it falls a little, extrapolating out this success. However, consumers don’t care about this. Consumers care that the cost of their groceries is still 100% higher than it was pre-Covid. Consumers care that the $5 meal at fast food is now $10. Consumers care that they can’t afford housing, healthcare or education. Ironically (not really), the three things most impacted by government, are the three things that have had the worst inflation for the past 10 years. This is what I said on Tuesday:
Chart(s) of the Day - price levels
As we await the CPI inflation data tomorrow, the markets are on edge. There are those making their case on each side - hawks suggesting commodity prices will keep CPI higher with doves suggesting shelter will finally fall & bring inflation lower
One of them will surely be right tomorrow & stocks will react accordingly. Heck, with PPI today, we will get a sneak preview. However, both of them miss the point. Whether month over month CPI is up 0.3%, 0.4% or 0.5% doesn't matter to consumers. The fact that prices are up 70-100% over the last few years does
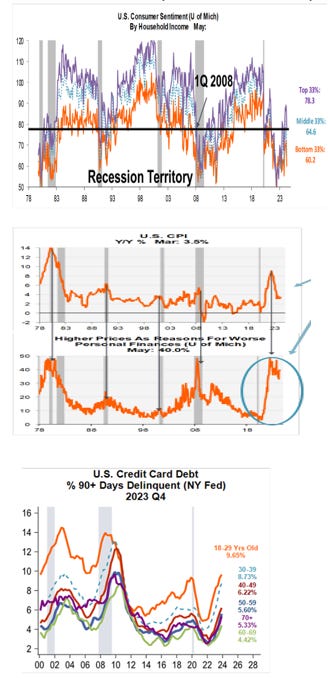
We saw this in the consumer sentiment data that came out last week. I am sharing a few charts from Nancy Lazar at Piper who is the best at this.
The first shows that regardless of the income cohort one is in, their sentiment is in recession territory. This is important because up until now, we have had a bifurcated economy, with the low end struggling while the top end still was doing well given stock price gains. That has changed
The middle charts give you a very good reason why this is the case. You can see with the spikes in CPI in the past there was also a spike in the 'higher prices are a reason for worse personal finances'
We hear this from the companies that have reported as well. Citigroup, CarMax, Zales, Proctor&Gamble, Tyson, Starbucks & Constellation Brands all pointed to consumer weakness & concerns on the economy. Consumers are not spending because of the price levels
In the past, these spikes were coincident with a recession except the most recent spike & this is because of the strong fiscal stimulus we got in 2022 & 2023. In fact, that worked so well at assuaging these wounds that the Administration is trying it again
The Administration is using Federal Home Loan Corp (Freddie Mac) to try to ease the use of home equity lines of credit (HELOCs) to provide a source of funding for consumers that are feeling the pain of higher rates
You can see this in the bottom chart as credit card delinquencies are spiking. If you think mortgage rates have gone up a lot, from 3% to 7.5%, check out credit card rates which have moved rom 15% to over 21%
This is also why the Administration is probably taking other steps to get on the good side of voters - decriminalizing marijuana, getting cash refunds for canceled airline flights, expanding the rules for overtime pay & over course, canceling more student loan debt
Even the Administration knows that in this inflation curse, it is the price level that is hurting consumers & not the price change. It is interesting those in the market are not as focused on it other than a few people I see discuss it
Concern over levels -> higher wages -> lower margins -> earnings pressure. Let's not over think this
There will be much debate tomorrow over 0.1% one way or another. Don't miss the forest for the trees
Of course, month over month CPI came out 0.1% better. Stocks rallied hard … all week. Pay no attention to the higher PPI on Tuesday or the worse import inflation on Thursday. The one measure that the market cares about was a little lower and extrapolating 0.3% instead of 0.4% means the Fed can cut. Forget that core CPI on a year over year basis is 3.6%, well above the 2% target. Importantly, though, the number the Fed (used) to care about - the core, ex-housing, services inflation - is, as Steve Martin might say in Planes, Trains & Automobiles “going the wrong way!!” This is what I wrote on Wednesday.
Chart of the Day - the glass is half empty
The market is rallying early this morning because the month over month CPI came in at 0.3% vs. 0.4% expected. This has some people thinking inflation will continue to come gently lower
This ignores for a minute that the year over year level of CPI is still at 3.6%, as expected, which is well above the 2% Fed target
This probably also includes the slew of other bad data such as the Empire Manufacturing from the NY Fed which was much worse than expected. Does it matter the East Coast is slowing more than expected?
It also may include the negative retail sales data. The control group for sales came in at -0.3% vs +0.1% expected. Consumers are really slowing down as we discussed yesterday
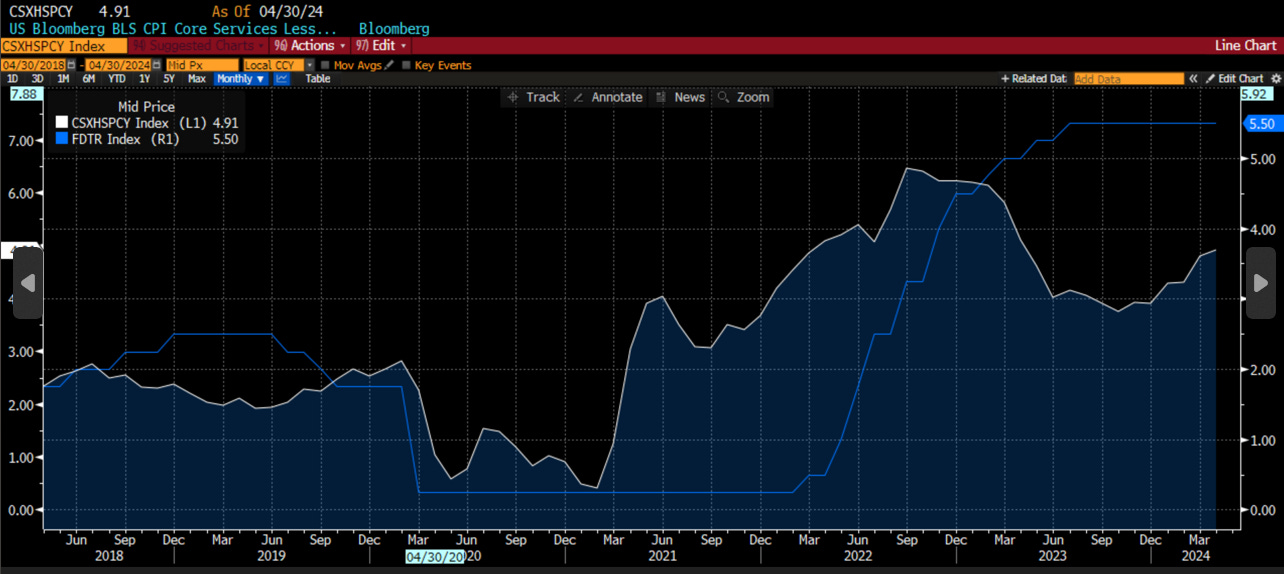
However, hidden within this CPI data was maybe the most important measure. The supercore CPI. This is the core, ex-housing, services inflation, that JayPo and crew told us is the most important data point for them
I have included that in the chart today. It came in at 4.91% vs. 4.8% last month. It is very clearly back in a rising trend. It has move up from 2.82% at the end of October. So in 6 months, this data has gone higher by over 2%
Supercore inflation moving higher, while Empire Mfg & retail sales control very negative. I know JayPo says he doesn't see any stag or any flation. However, he might want to check again. All we need to confirm stagflation is to have the jobs mkt continue to deteriorate
Stocks will rally on the expectations the Fed is going to cut. However, I just don't see it, not if we are to believe the Fed that the supercore is what matters. Look at the chart again. I overlaid the Fed Funds target with the supercore
It may not suggest rate hikes, yet, but does this relationship suggest cuts?
Even though the growth is clearly slowing? Recall, the Fed's dual mandate has nothing about growth. It has full employment & price stability
I hate to always seem like the glass is half empty person, but I think the Fed is still in play which will mean multiples can't expand. Stocks can still go higher if earnings are able to grow. That is just a smaller universe of stocks
That wasn’t the end of my inflation diatribe. That would be too easy right? I followed this up with a post on Thursday, motivated by the positive reaction in stocks and cryptocurrency.
Chart of the Day - the glass is half full
Lest I be accused of always being negative, even though research shows that negative news 'sells' much better than positive news, I wanted to show some good news today
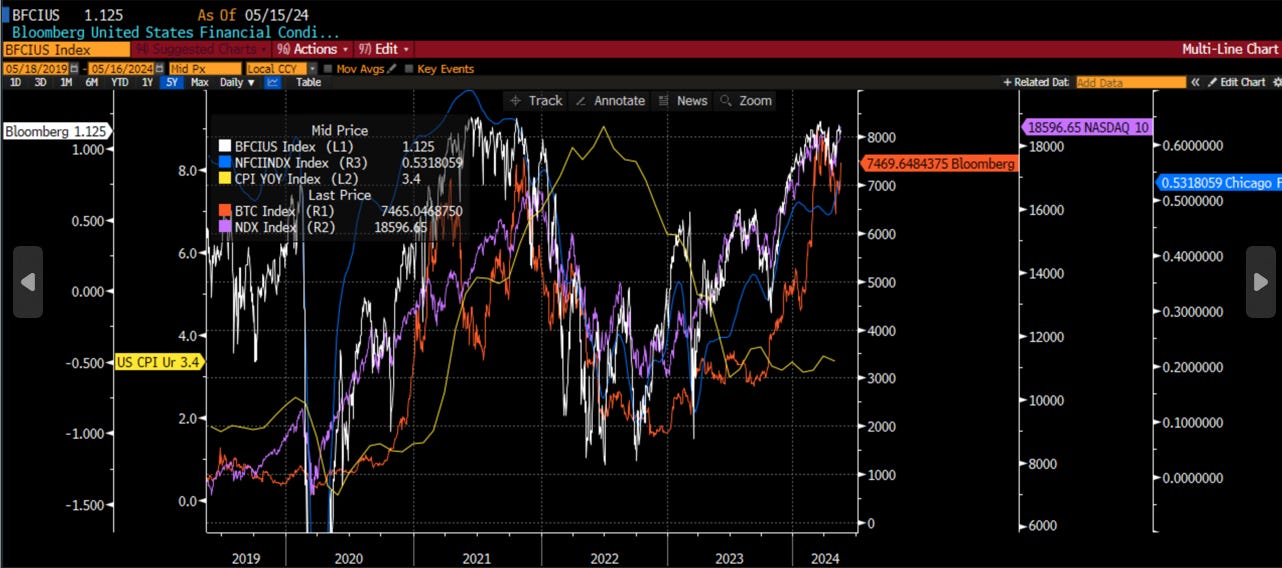
The good news is financial conditions have gotten a lot easier. In fact, according to one of the two measures I track, they are as easy as they were in 2021, as well as 2007 & 1999
The first of the 2 measures is the Bloomberg Fincl Conditions Index for the US. It's in white. This is the measure that is as easy as those aforementioned dates. It uses a variety of market measures to assess the state of financial conditions
It is corroborated in blue by the Chicago Fed Natl Fincl Conditions Index. This measure also shows considerable easing though not quite back to 2021 levels
According to their website: The Chicago Fed’s National Financial Conditions Index (NFCI) provides a comprehensive weekly update on U.S. financial conditions in money markets, debt & equity markets, and the traditional and “shadow” banking systems
The data is so robust, it is almost always one of the critical variables my students find is significant when building models to forecast growth or inflation
Both measures show conditions easing considerably from early 2023 on, with a dip around Sept/Oct. Both show these have eased much more this year
This is interesting because JayPo has discussed how fincl conditions are tightening. I am not sure what measure he is looking at. Perhaps this is some look at real rates or r* etc. However, the mkts are telling the Fed that conditions are quite easy
Overlaid on these measures of fincl conditions are some mkt variables that are telling the Fed it is easy. Exhibits A & B are the prices of Bitcoin (orange) & Nasdaq (purple). You can see both of these indices follow the fincl conditions
Sure, it is a bit circular as the prices of equities impact fincl conditions. However, you can see conditions lead the NDX & not the other way around. In addition, whether you want to use Greenspan's wealth effect view or Soros' reflexivity view, both suggest higher prices for risk assets drive the economy in a virtuous circle
One other measure on this very busy graph also seems impacted by fincl conditons & the prices of risk. That is CPI which is impacted with a lag. All of these measures are suggesting CPI is headed higher, much higher, the rest of this year
Sure, the mkt loves to extrapolate the unrounded month over month core number to convince itself we have 'immaculate disinflation' & a Fed that 'is itching to ease'
If you look at the factors working this week it is short interest, momentum & growth. This is HF throwing in the towel. Those that are lagging badly are quality & low volatility, factors that normally work when the Fed is about to cut due to falling growth
The mkt is convincing itself of future policy. Fincl conditions reflect this. Will the Fed notice?
One last LinkedIn post to go to. I told you it was a theme this week. I am not kidding when I see signs of inflation continuing to be a problem this year, at the same time the market is focused on ‘immaculate disinflation.’ The market is convinced even though the signs are not there. This one speaks more to what may in fact by root cause of the problem:
Chart of the Day - sanctions & tariffs
I posted 2 things yesterday. The 1st post on the impact of fincl conditions on stocks, Bitcoin & CPI did not seem to resonate with the crowd. The 2nd post on signs of stagflation seemed to get more to engage. Bad news sells I guess
Another interesting post yesterday was on the spread in copper contracts between CME & LME. This is coming down to the sanctions imposed on Russian metals & other products
It got me to thinking about other things that also contributed to the CPI spike in 2021/22. We had monetary stimulus (check), fiscal stimulus (check), sanctions on Russia (check) & tariffs on China kicking in (check?)
The Biden Admin recently announced some pretty tough tariffs on Chinese imports. If you thought 25% on washing machines was bad in 2020, what about 100% on Electric Vehicles just announced?
There are also tariffs on lithium-ion batteries, aluminum & steel, solar panels & medical products. I have said all along that the energy transition would be inflationary. Its much more inflationary when you put tariffs on the low cost producers of products that aid in the energy transition. This is on top of the 2018-2020 tariffs that are still in place.
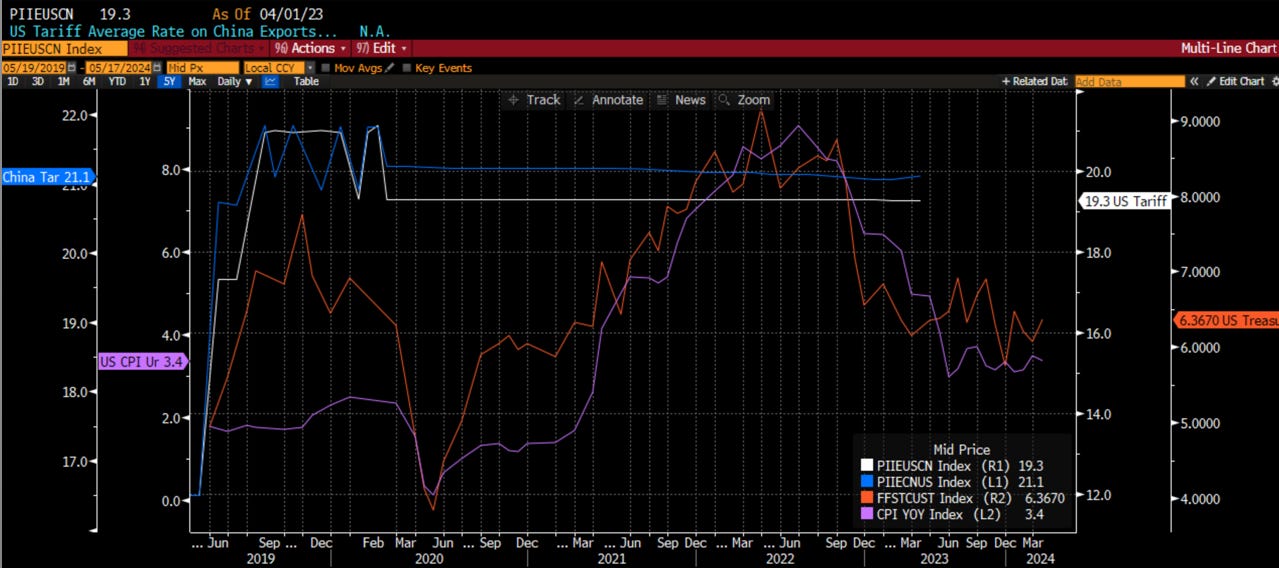
The chart today shows these tariffs from Trump & the impact on the US. Ultimately, it may hurt Chinese companies who are trying to take mkt share, often aided by govt subsidies as China tries to squeeze out global competitors. However, they also hurt US consumers via higher prices
Tariffs hurt in 5 ways I can think of: 1. increased cost of imported goods 2. supply chain disruptions 3. retaliation 4. reduced competition 5. cost push inflation
We can see the white line which is the avg tariff on many Chinese goods coming to the US. It avg 19.3% after peaking at 21%. It has flat-lined there but is set to turn higher
The blue line is the Chinese tariffs on US goods. It peaked at 22% & is flat-lining at 21%, higher than US. You think this line is also set to go higher? Maybe the Biden Admin doesn't care because it is banning the sale of desirable products like high-end semis. Apple may care. Tesla may care.
The orange line is the amount of revenue the US took in from these tariffs. You can see it spike into 2022 as they kicked in. However, as consumers adjusted buying patterns & companies adjusted supply chains, this revenue fell
Interestingly, or not, the CPI followed those tariff revenues pretty darn closely. Recall DC telling us it was supply chain disruptions that were causing inflation?
Maybe a self-inflicted supply chain wound that caused it. We clearly learned little because we are not only doing it again but upping the ante. More govt policies that are going to create inflation
The combination of foreign & domestic policy the last 8 yrs is quite inflationary. Our choice in November seems to come down to what kind of inflation we want
Yet the mkt is talking itself into disinflation
But don’t take my word for it. Why don’t we ask Jamie Dimon? As the CEO of the biggest bank in the US, one of the most-respected CEOs in the world, who has a comprehensive look into US consumers and corporates, Jamie’s opinion matters to the markets. At the JP Morgan Healthcare Conference, Jamie said inflation is worse than most people think:
https://finance.yahoo.com/news/jamie-dimon-says-inflation-worse-010919589.html
"Inflation may not go away the way people expect it to," the JPMorgan CEO said, adding: "There are a lot of inflationary forces in front of us."
I think you get the point on my view of inflation. Jay may not see ‘flation, but Jamie and I sure do. What about growth and employment? Let’s dig in some more.
GROWTH
In the next two sections I won’t kill you with my LinkedIn posts. However, these are all based on discussions I am having with students who are working on a plethora of research projects with me this summer. For these, we are always exploring the best variables we can find to predict.
As I have written many times before, my preferred metric for growth is the ISM rather than the GDP. DM me if you want more of an explanation. However, while the ISM is coincident with the SPX, and both are leading indicators, can we find other indicators, or combinations thereof, that can anticipate the ISM itself? One measure that many in the market like to use is the difference between the ISM new orders and ISM inventories. There is logic to this. As companies feel good, they draw down inventories and even add new orders. When things are tough, new orders stop and inventories start to accumulate. When you plot this measure vs. ISM itself, you can see there are some good leading properties, if only on a short-term basis. You can also see that while it rose all of last year, giving a sign to recessionistas that last year would be better, it has fallen consistently this year.
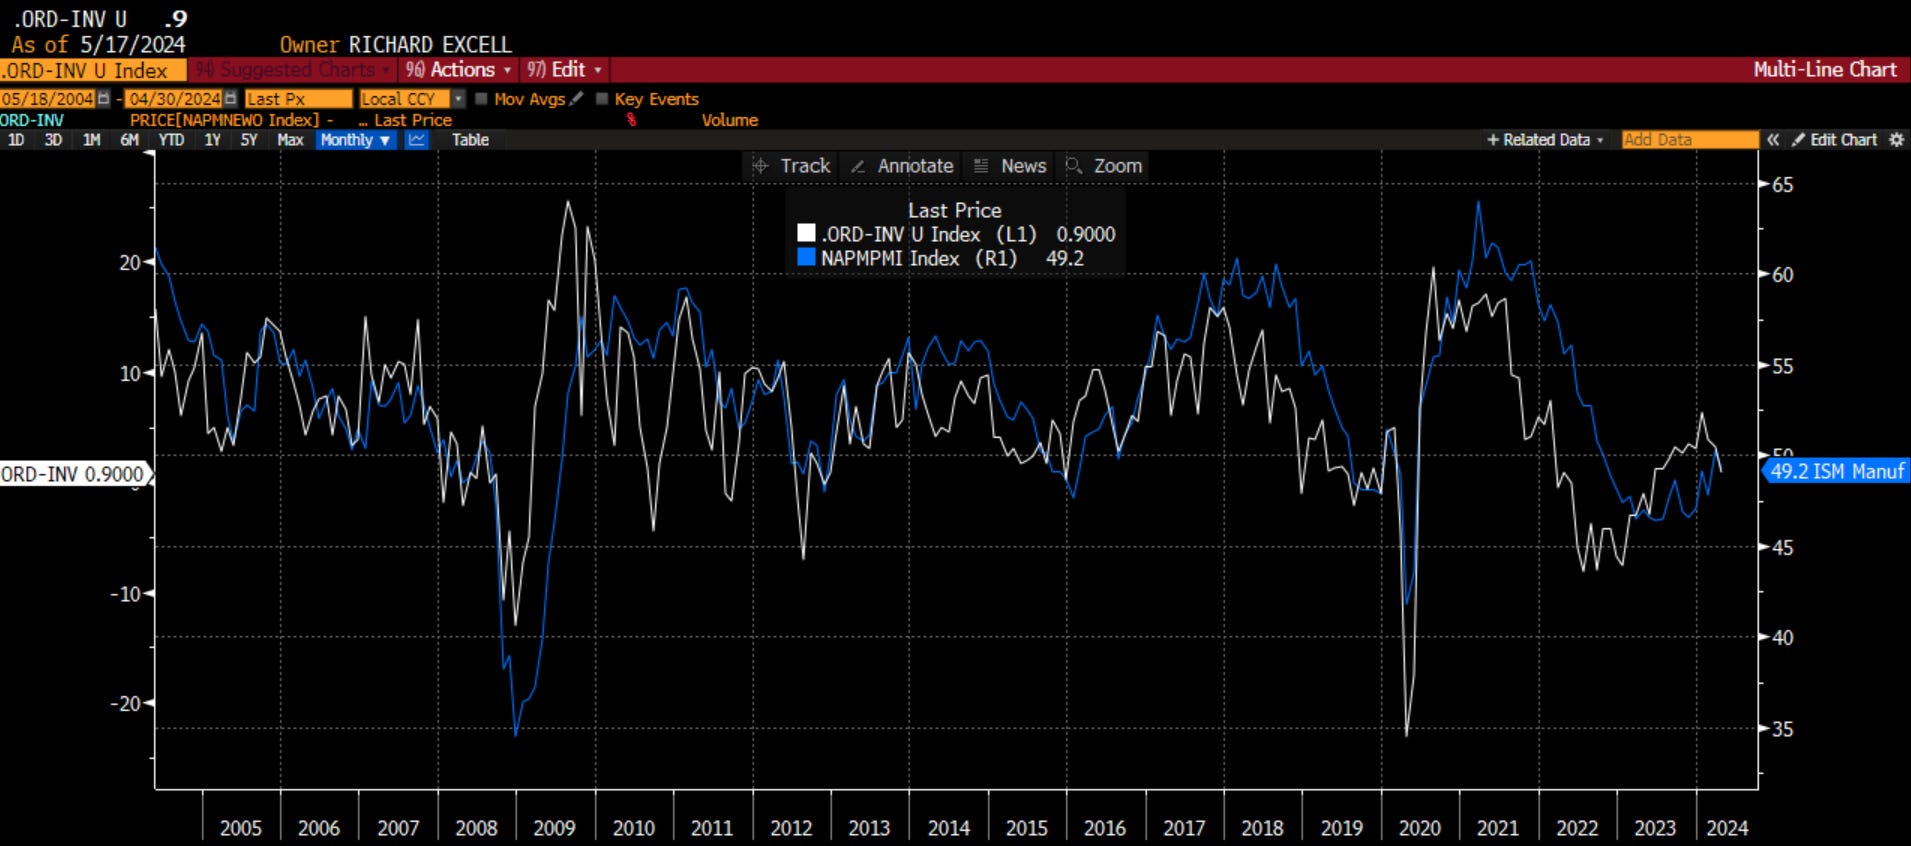
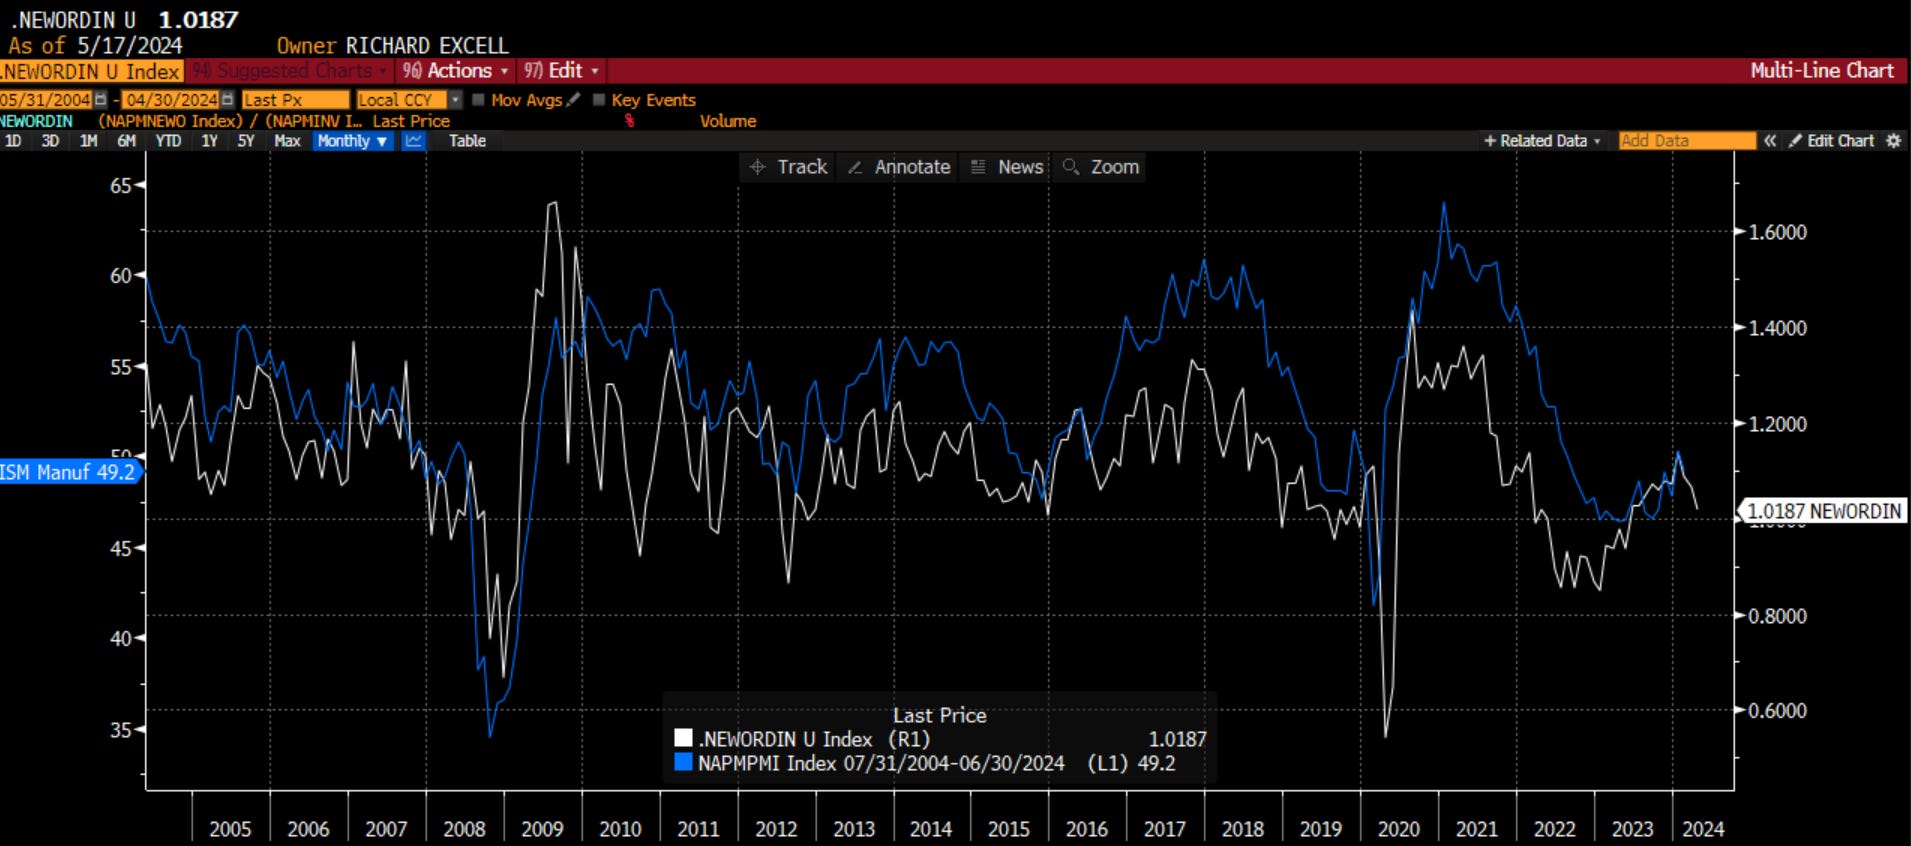
I prefer the ratio of new orders to inventories myself, but really the pattern is identical. In this chart, I have new orders to inventories leading ISM by two months. You can see from this chart, we should expect ISM to be heading lower in the next few months. It already fell from above 50 to below 50 in the last reading. These anticipatory measures are giving us a warning sign.
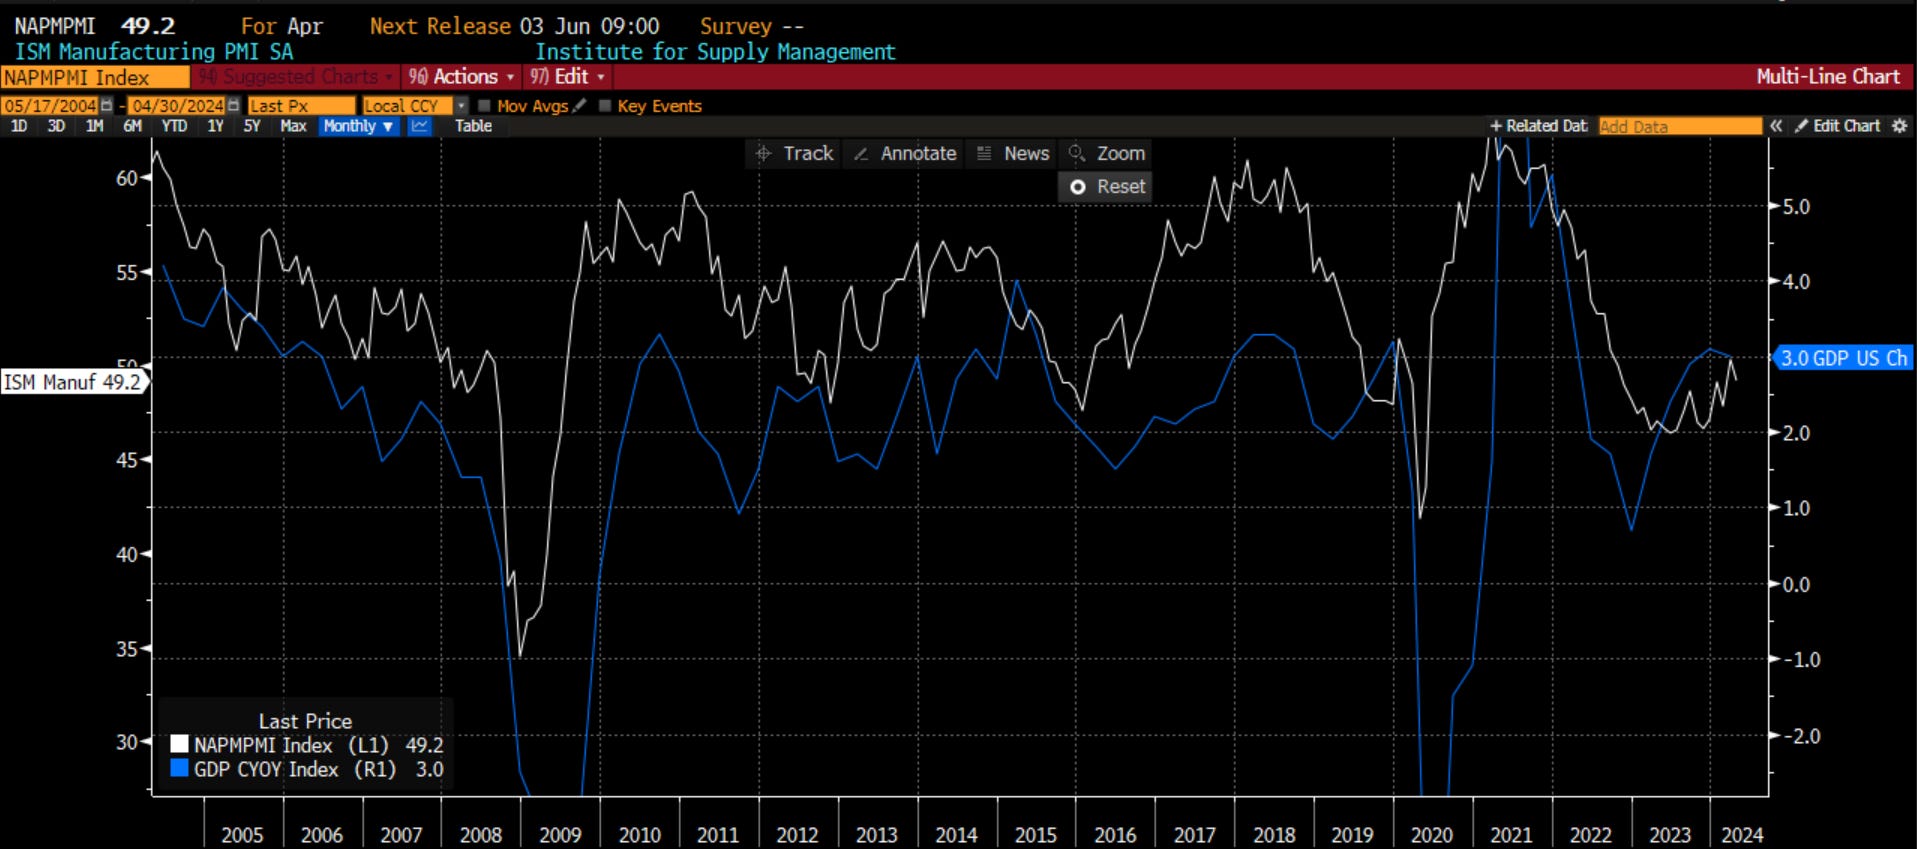
This is the graph of ISM and GDP. You may look at this and say ‘they look basically the same, so why do you prefer ISM?’ On the one hand, I will tell you it is because you can see that in most periods, the ISM is leading the GDP. However, even more importantly, the GDP you are looking at is the final revision GDP that Bloomberg keeps as the time series data. We know from experiencing that GDP comes out, and then it is subsequently revised two times in the following two months before we settle on the final reading. So, by the end of Q2 2024, we finally have a sense of what Q1 2024 looked like. We don’t care about that as investors. We care about what Q4 2024 and Q1 2025 look like. This forward-looking idea is what ISM is capturing.
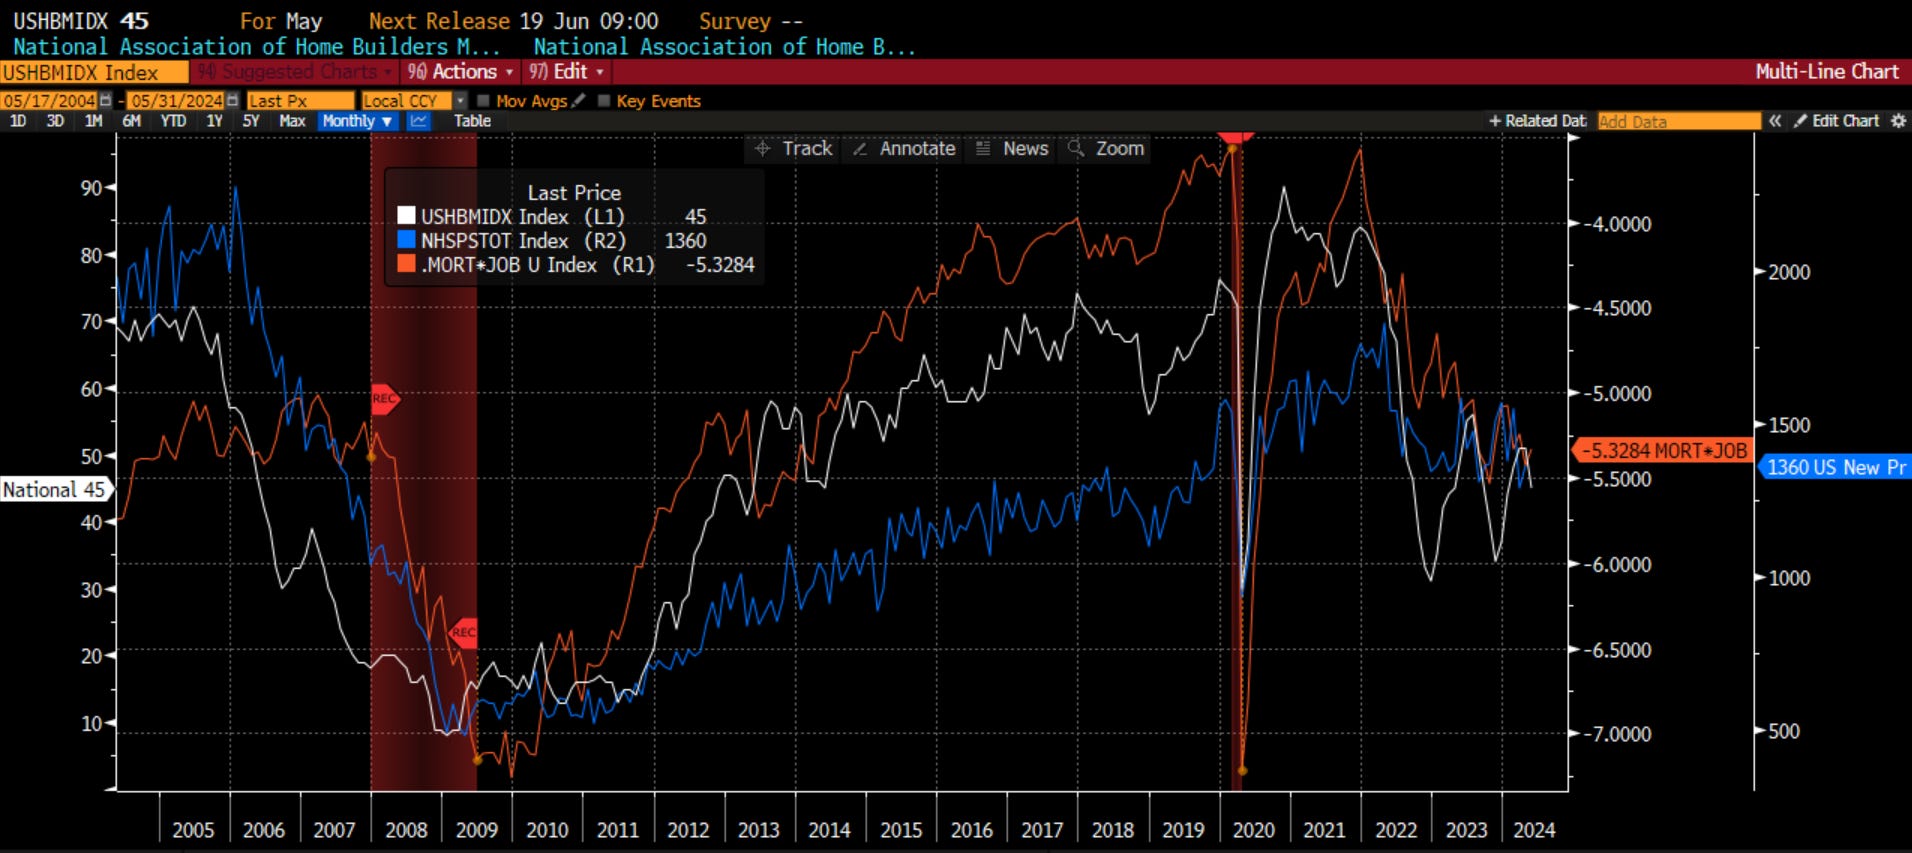
You also know from previous posts that H.O.P.E. is an important part of my approach. Housing leads us into and out of recession. Housing is at the forefront of the economy, most impacted by the cost of money, the largest decision a consumer makes, and a major multiplier on the jobs front. Thus, understanding housing is key. This week, the National Association of Home Builders Index came out weaker than expected. Building Permits and Housing Starts also came out weaker than expected. All are falling. This should not be surprising because my favorite forecaster for these is the mortgage rate * the unemployment rate (inverted). This is still signaling that housing will have a lid on it. Not a good sign.
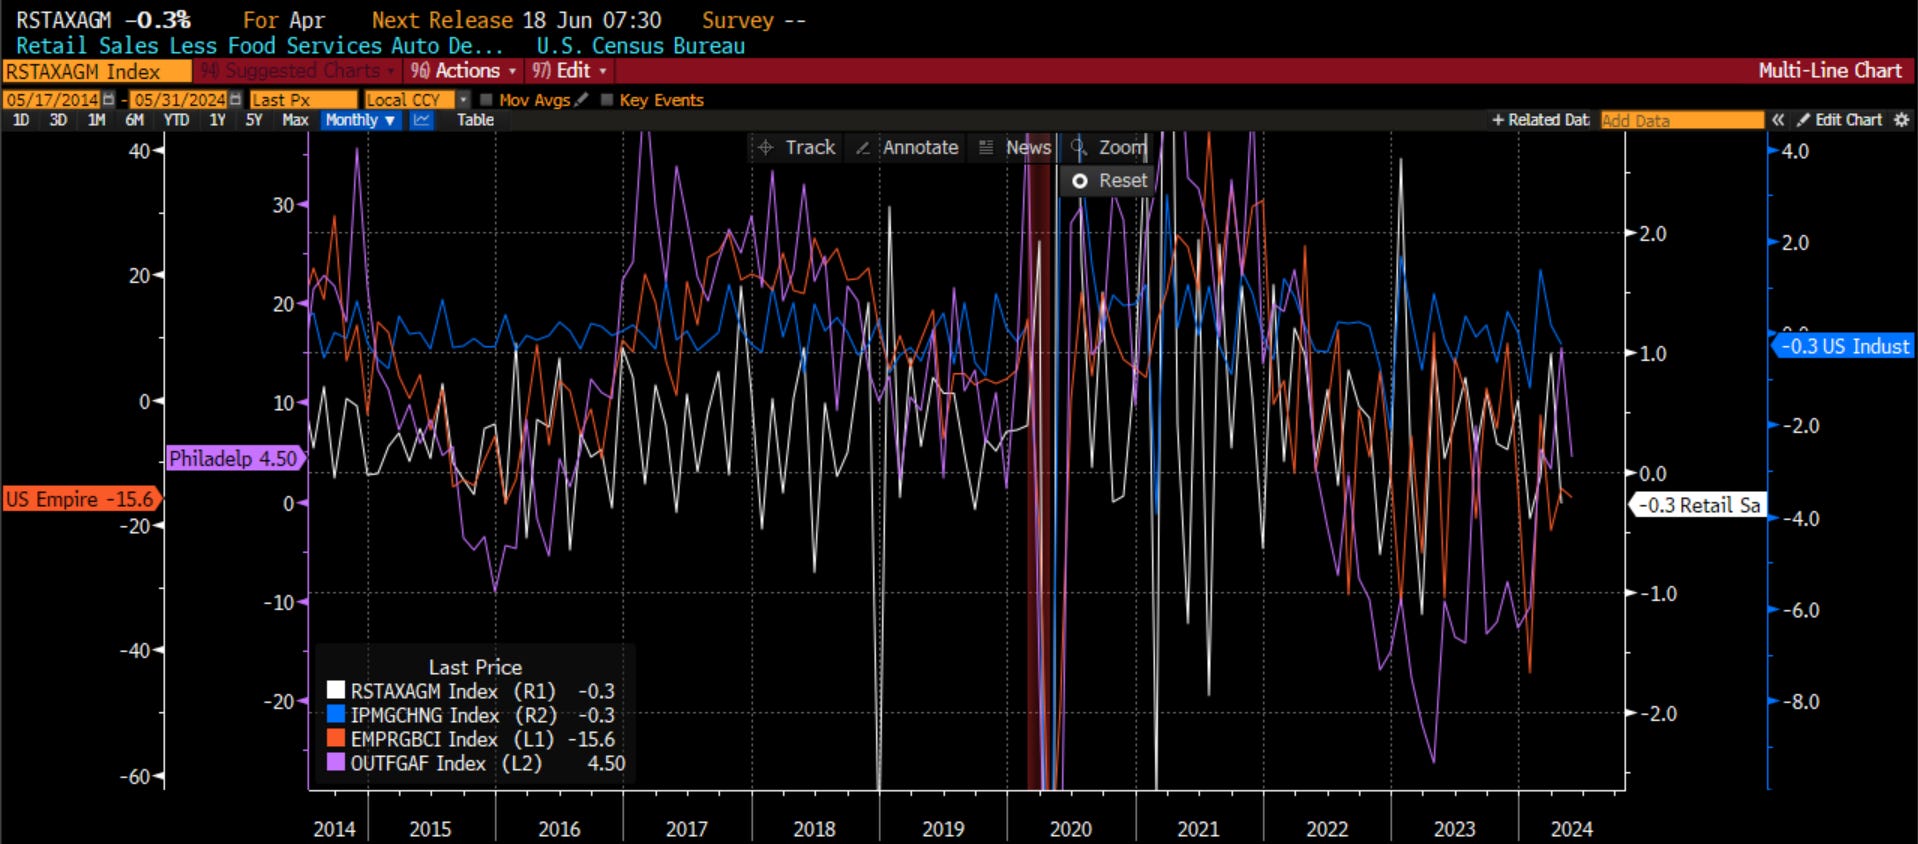
A few other bits of data that came out that I think tell an important part of the story. Retail sales control group, less food and services, was negative last month. In addition, manufacturing output was also negative. You can see these on the right side of the graph. Two other measures came out that are important in their own right. The Empire Manufacturing put out by the NY Fed was much worse than expected at -15.6. Not to be outdone, the Philly Fed number in purple was positive, but also much lower and worse than expected. A string of numbers that suggest that growth is slowing.
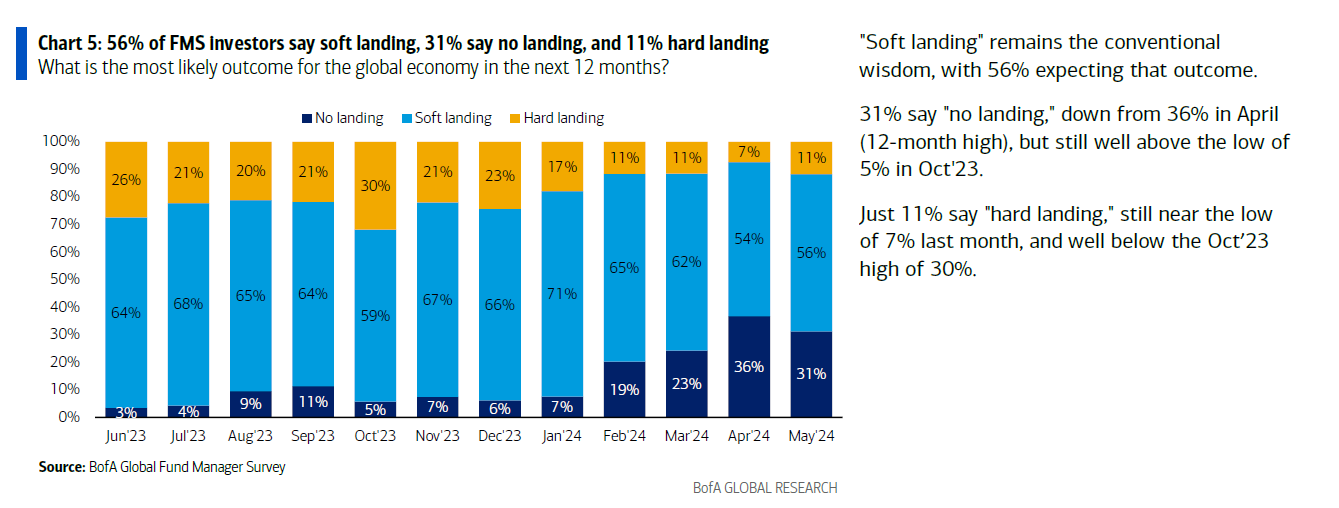
This is all important because the market is not expecting this. Based on the last BAML Global Fund Manager Survey, investors are still expecting a soft landing (56%) or no landing (31%). 87% of investors think growth and the economy are fine. Just 11% see a hard landing. Again, you don’t have to think we are going to have a recession to know that it is NOT priced into markets globally.
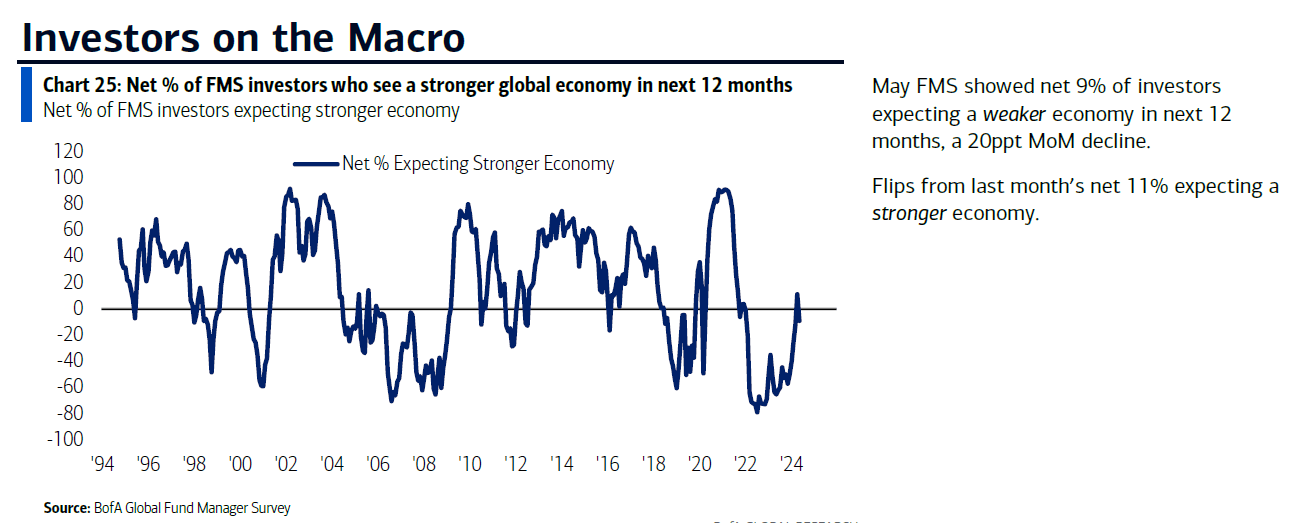
However, the consistently weaker data may be starting to have an impact. One other survey in the BAML Global Fund Manager Survey was the % expecting a stronger economy. This month it was a net 9% expecting a WEAKER economy, down from a net 11% expecting a stronger economy last month. Opinions may be changing.
We aren’t there yet. We aren’t to the negative growth we might want to see to expect stagflation. However, it is falling. It is falling faster than many in the market are expecting. This is a good chunk of the ‘stag’ that Jay doesn’t see.
EMPLOYMENT
The last piece of the puzzle is the labor market. We need to see job deterioration to fully get on board with stagflation. In fact, in my debate with Nancy Lazar at Piper, this is the sticking point why she doesn’t see stagflation. She actually just see a recession by the end of the year. However, I will rely on her own data to show how the labor market is looking.
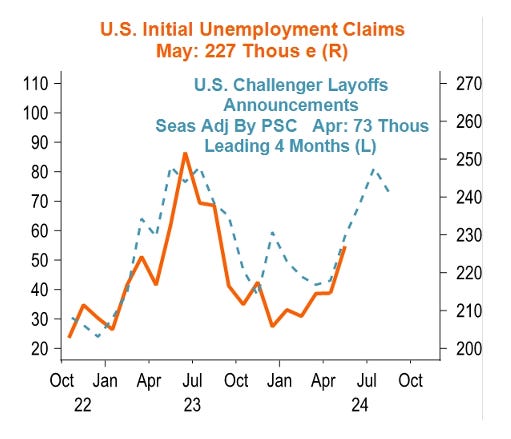
We got the unemployment data a couple weeks ago now, but my preferred measure is jobless claims as it is real-time and out on a weekly basis. This week it was worse than expected. Some is explained away because NY teachers were back from Spring Break and for some unknown reason, they are allowed to file for unemployment on Spring Break. Either way, jobless claims are trending higher, and this can be predicted by the Challenger & Gray layoff announcement data. This would suggest we will see a jobless claims number of 250k over the summer.
I spoke about the Sahm Rule and unemployment a couple weeks ago. This is the Sahm Rule and Nancy’s forecast. You can see that there is a good chance it is going to trigger a recession forecast before the end of the year.
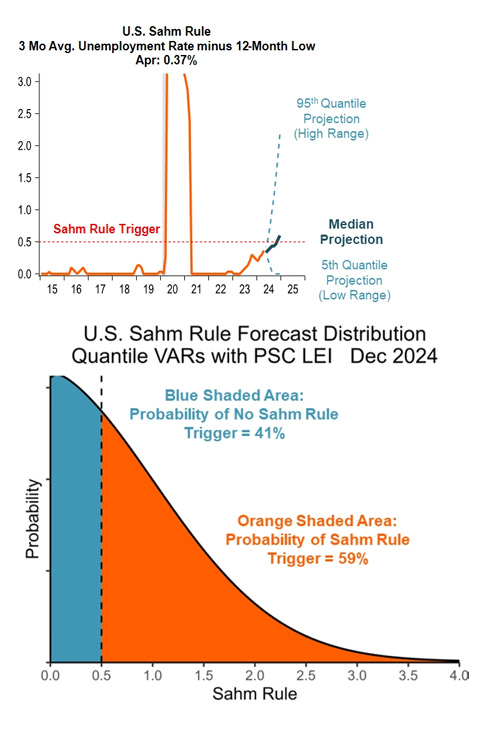
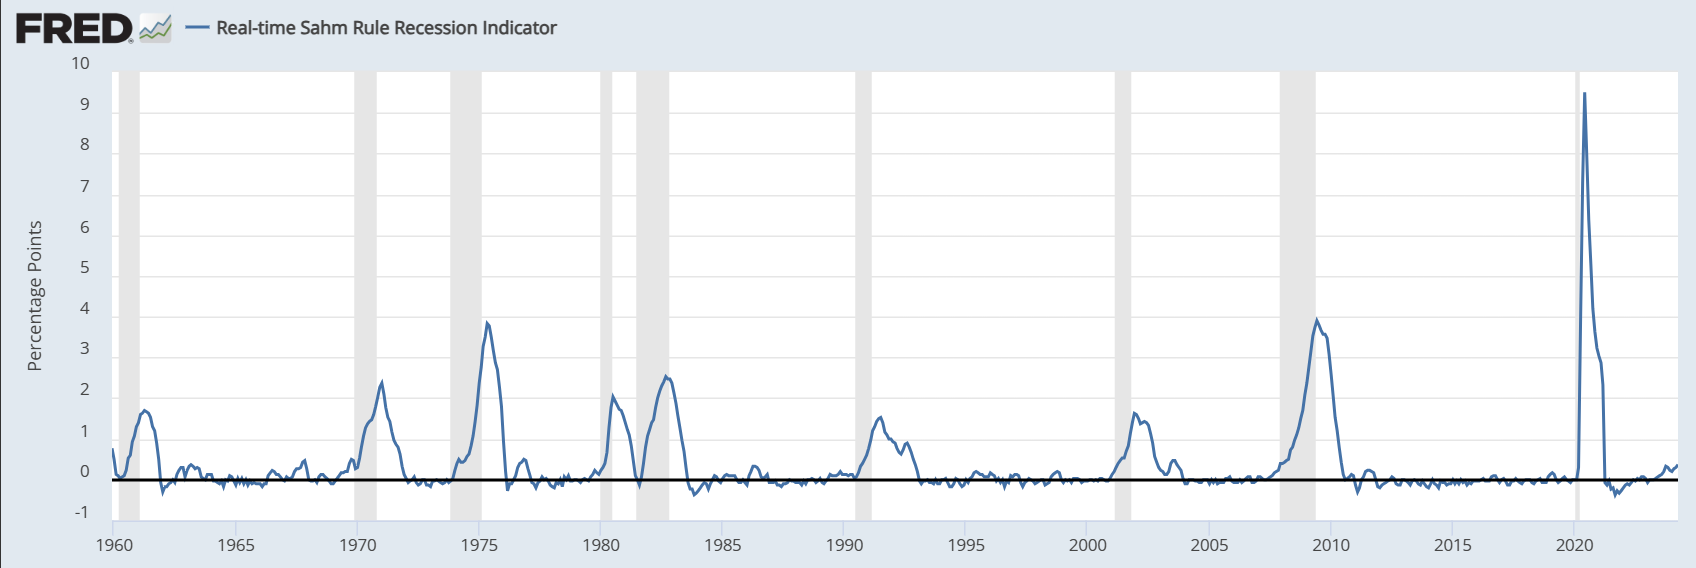
Here is the long-term view of the Sahm Rule going back to the 1960s. You can see when it starts to move higher, it typically moves until it triggers. There have been some quick head fakes, but when we see steady deterioration from the best levels, it typically means we will move until the trigger hits.
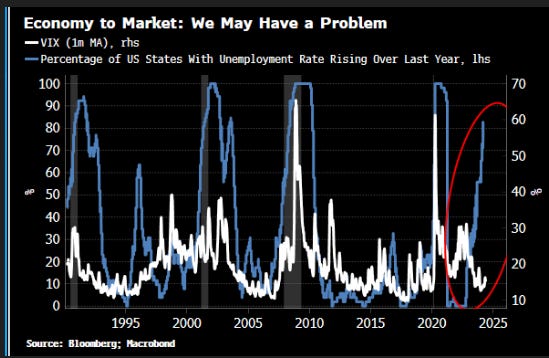
I am showing you this chart not because I think the two lines have causation, even if there is correlation. After all, the VIX is impacted by uncertainty and liquidity. Sure, a worsening labor market will lead to uncertainty, but it is the response from the Fed, in timing and magnitude, the impacts liquidity and therefore the VIX. I am not suggesting the VIX will spike this year. However, I did want to show you that 80% of states are seeing unemployment rising.
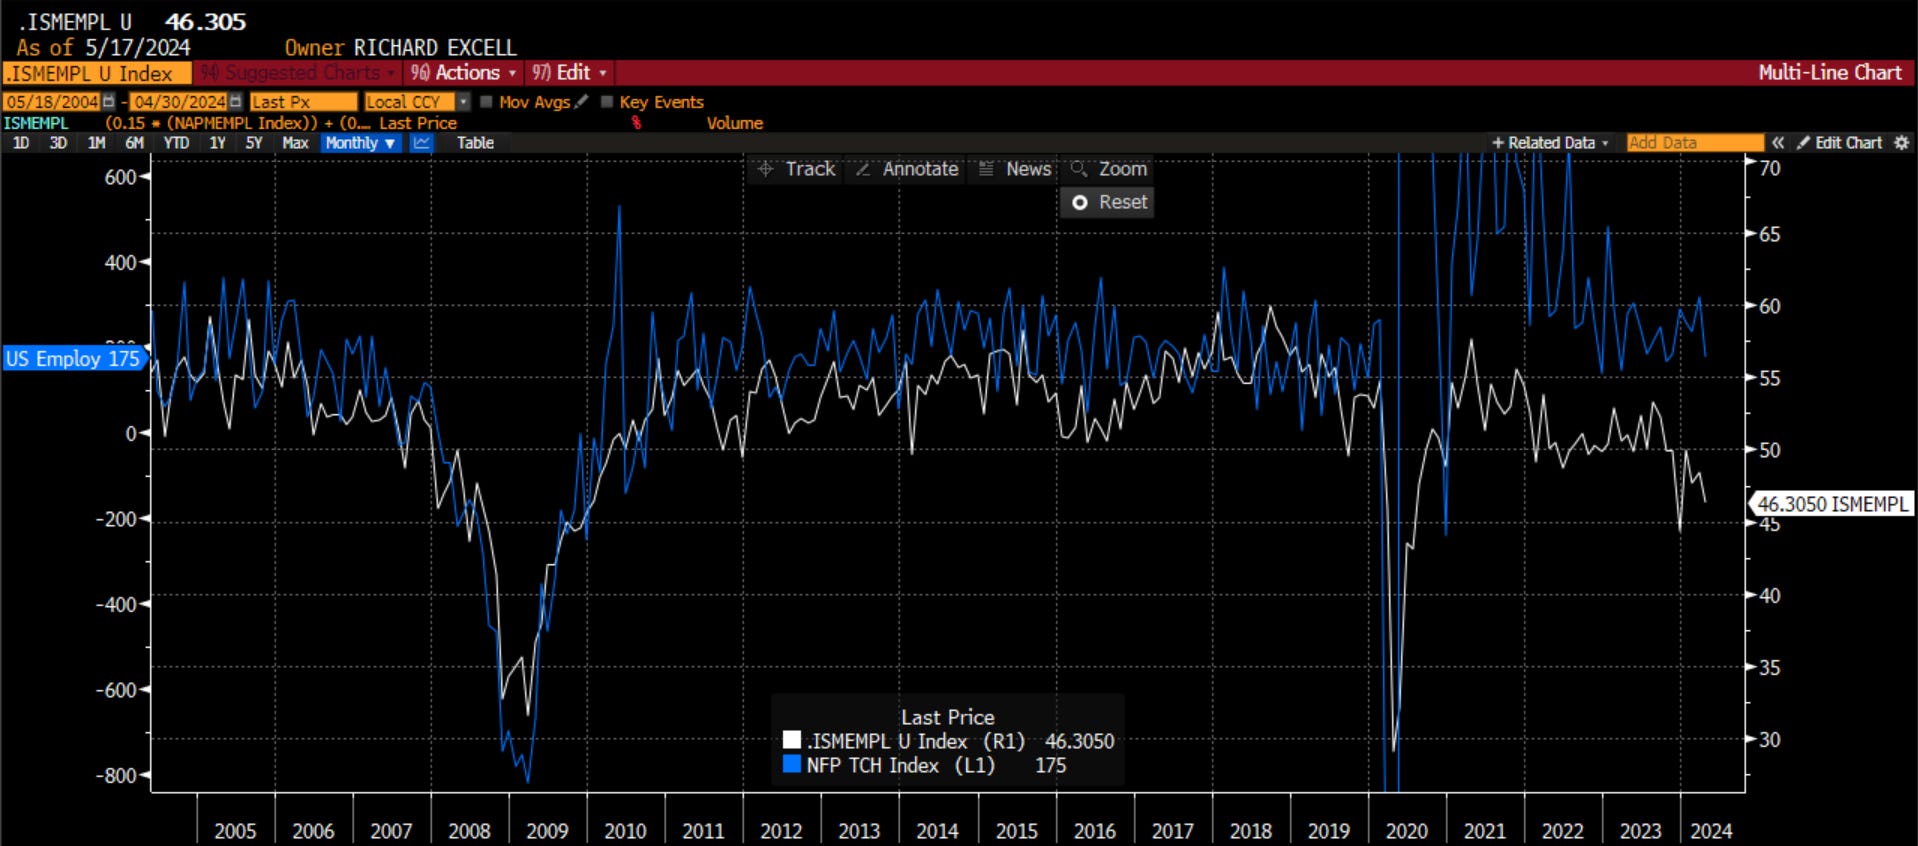
One last chart for you. Back to ISM but this time looking at the employment data for both manufacturing and services. I have plotted this vs. the non-farm payroll number. You can see NFP has been higher than it would suggest all year. Maybe ISM employment is ‘broken’ like the yield curve? However, note that the NFP data that has come out has been revised lower every month this year. Thus, maybe the government data is frankly just bad data right now. It is impacted by both seasonality adjustments as well as their birth/death (of new businesses) model. Between these two time series, I would bet my money on the ISM vs. the government data.
Well, I have laid out my case that I think stagflation is more likely than our fearless leaders in D.C. would have us believe. I know I am at odds with the market on this. I know being at odds with the market can be costly. Full disclosure, I am not short the market. I am not even fully in cash. However, I do have a fair it of optionality built into the portfolio, as well as some dry powder. I don’t want to ignore the very easy financial conditions. I don’t want to ignore that the Fed is buying bonds even though it is still presumably in QT mode. I don’t want to ignore that M2 is moving higher.
However, I definitely want to …
Stay Vigilant