


Inflation?


This week I have had a focus on inflation. It is prompted by many things, not the least of which are the inflation numbers coming out next week, but was also prompted by a text thread with a good friend (hat tip PC):

I had already been writing and thinking about the topic earlier in the week. I have to say, I am not entirely sure if we will see it or not. I can see arguments on both sides:
Higher inflation:
- sticky wages if not further wage increases getting passed to customers
- tariffs getting passed along, even if in some small part, to the customer
- supply chain disruption (remember when that was the blame during Covid)
- asset price inflation caused by easy financial conditions
- Baby Boomers flush with cash earning 4%, higher stock prices and higher home prices
- unchecked government spending
Lower inflation:
- Demographic drag - Silent generation not spending and aging Boomers shifting more spending to healthcare
- AI productivity boom causing a loss of high-end jobs which slows spending among the most affluent
- Inflation on durable goods which slows spending on discretionary goods, bringing prices down
- CPI coming in lower on a month-over-month basis each month this year
- Positive real rates at Fed that are slowing small business
_________________________________________________________________________
As you may know, I have been in the sticky inflation leading to the Fed not cutting rates as much as the market hoped. I have been in the stagflation camp. Halfway through the year, am I right or wrong? This is a question I ask myself. Well speaking of halfway, I am halfway between the equity market interpretation and the bond market interpretation. The equity market sees higher growth and falling inflation, leading to wider margins, still steady revenues and higher earnings through year end:

The bond market sees slowing growth bringing down inflation and the Fed needing to cut rates at least two times this year and more next year (when admittedly Powell will be gone and surely replaced by a dove. You don’t typically see this many rate cuts priced in when stocks are at all-time highs:

———————-
So, I explored the topic a bit on LinkedIn this week.
I looked at some positive and negative drivers of inflation. First, something that may weigh on inflation, bringing a welcome relief:
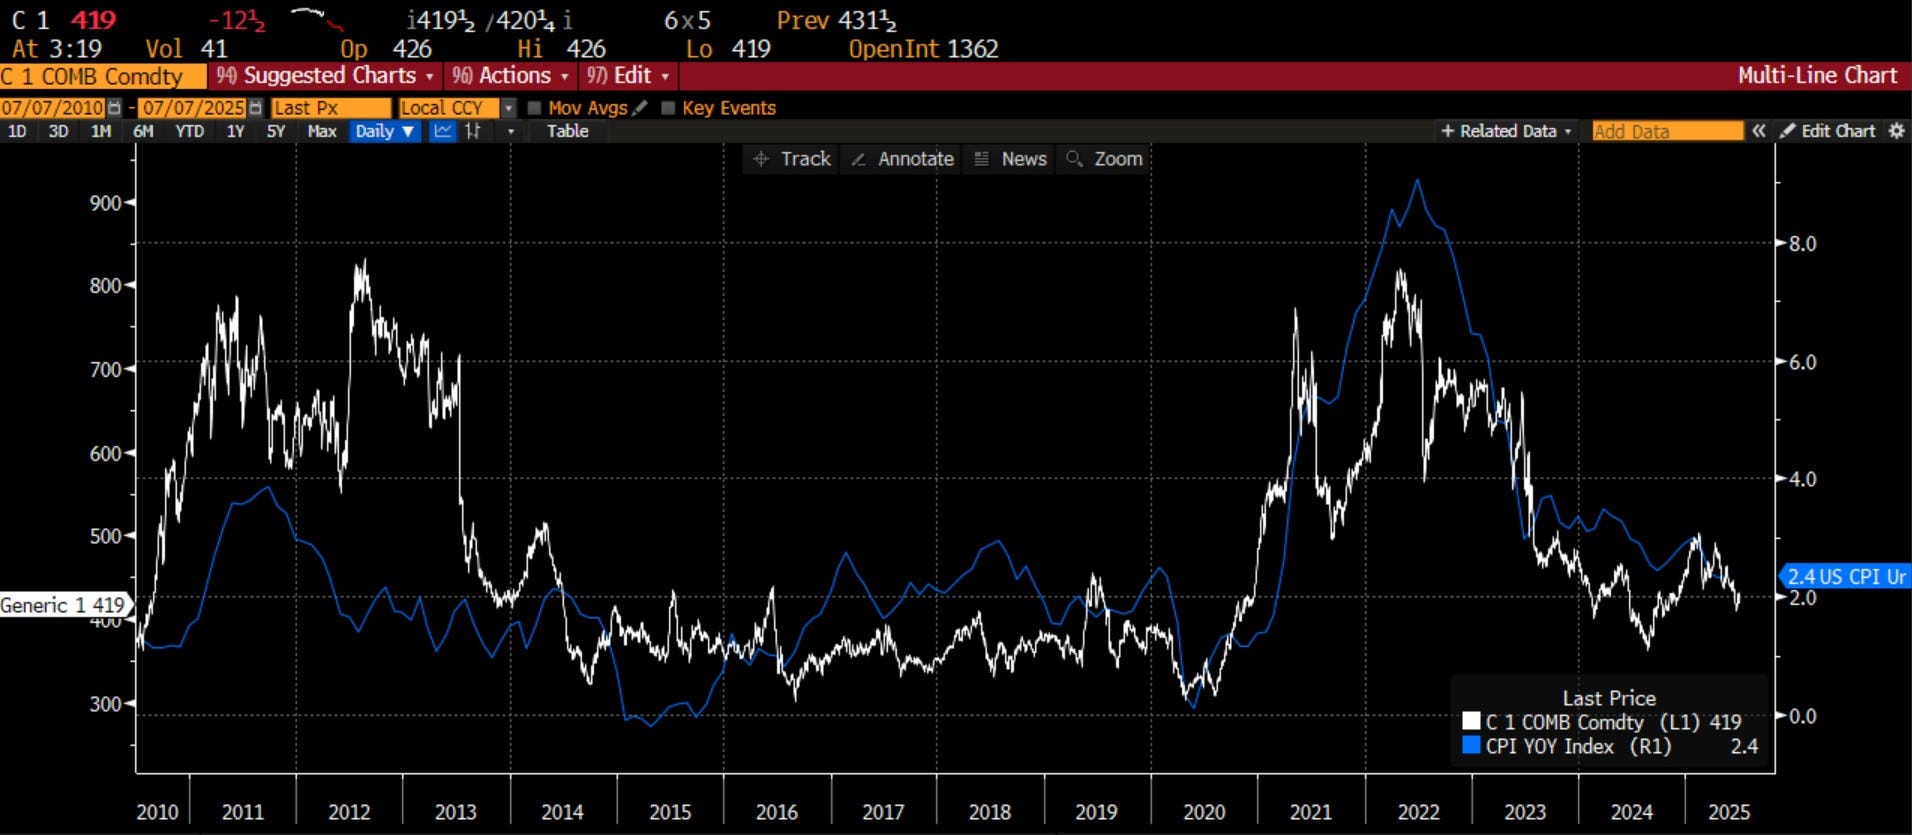
Chart of the Day - knee high by the 4th of July
At the lake for the 4th of July holidays, I had the chance to take a couple of long walks around the lake. While most of the land is developed these days, there are still a number of farms
As I walked past a couple of fields planted with corn, the phrase 'knee high by the 4th of July' came to mind. This is a phrase that originates in the Midwest and dates back to the 19th century. If the corn was knee high by the 4th of July, it meant there would be a good crop
With the advances in agronomy today, the corn tends to be higher even still, with waist high not uncommon. On the fields I walked by, it was more like shoulder height
I know the corn crop is not even across the US as weather hasn't been, but based on the USDA acreage report that came out on June 30, the amount of corn planted was up 5% yoy, and the yields on the crop look to be quite good
This has led to weaker corn futures prices. While this may not be good news for farmers, it is good news for US consumers. While the corn that they are growing is not going to end up in your supermarket, it is going to affect your prices through a variety of ways
The corn is the feed for cattle and cattle prices have been very strong the last few years. As feed costs come lower, there is hope for lower protein prices
It is also an important blend for gasoline. Roughly 40% of the corn will be blended into ethanol. Lower corn prices give hope for lower fuel costs
One last place I think of is corn syrup. While RFK is trying to get rid of it, we still find corn syrup in soda, candy, baked goods and a variety of condiments
Thus, corn is pretty foundational for the US supply chain. It should not be surprising that the corn future and the yoy change in CPI look pretty similar as you see in the graph today
I have been on record saying I think CPI could reaccelerate and this will keep the Fed at bay. However, a bumper corn crop could change that. Of course, weather is always a variable and we can't see it coming.
For now, though, the corn crop looks good which should be good for all consumers
————
Then, something that might boost inflation causing the Fed some problems:
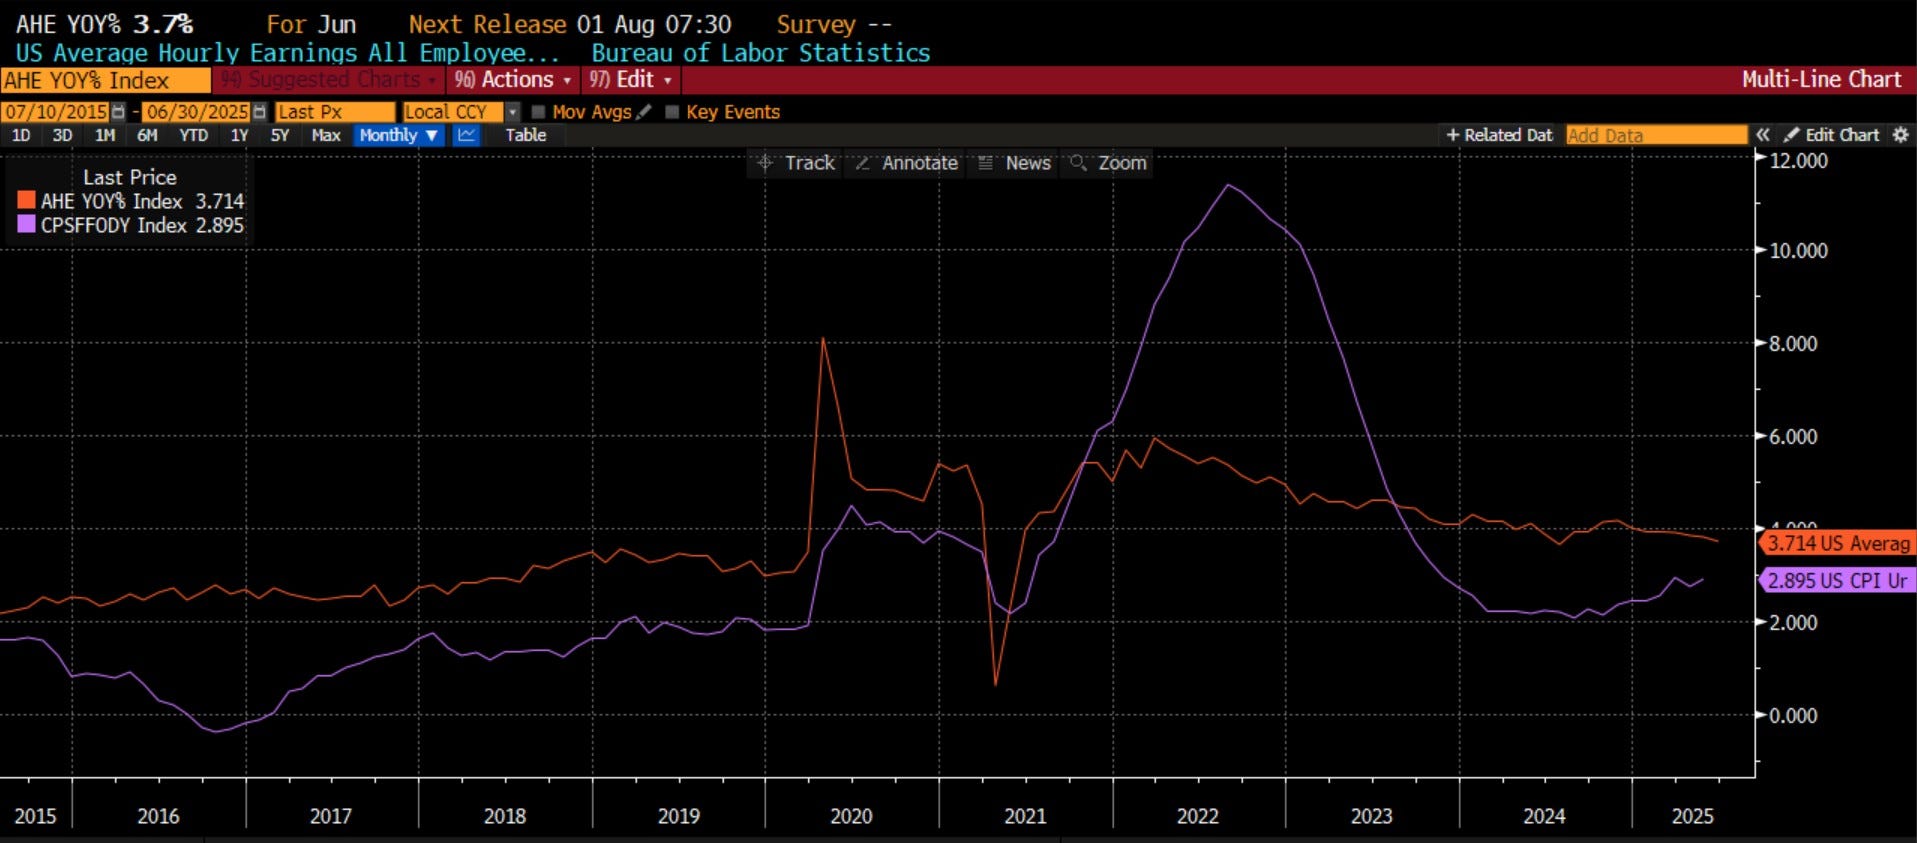
Chart of the Day - ice cream
Over the very hot long holiday weekend, I had occasion to be waiting in line for ice cream with my son. Nothing better than a scoop of ice cream on a hot summer day after all
While we waited, he told me about the actions just taken by Ford. I had not seen the story so I was interested. Essentially, the younger workers there, who were making $17 an hour, were having to take jobs at places like Amazon to supplement their income because they couldn't afford to live
The Ford CEO took a page out of Henry Ford's playbook and decided to double their wages. Back in 1914, Henry Ford decided to double the wages to $5 a day for workers
This time, Jim Farley took the hourly earnings from $17 to $34. For the record, the after-tax take home for someone making $17 an hour is about $560 a week or $29,500 a year
The story really stood out to me because he was finishing the story as we got to the register. Single scoop ice cream cones for 4 of us cost me $33.80 or $8.45 a piece. Don't get me wrong, it was good. However, how can a family making $560 a week take the kids to get ice cream on a hot summer day when it would cost $33.80. 2 hours of work for family ice cream
Some will immediately say 'companies must pay more money'. Here is a case where they are. However, we also know empirically that when they do, they are going to pass that cost on to consumers, if not in its entirety, certainly in some way
If not, their stock price is going to get shelled. After all, if employees are better off and consumers don't pay some part of that, the entire burden falls on the shareholders
The chart today shows the CPI for food compared to Average Hourly Earnings growth. You can see the pain point that really came in the 2022-23 period. This influenced the election
Is Ford leading the way to a new round of wage increases in manufacturing, just as the administration in DC is trying to bring more manufacturing back to the US? What does that mean for the overall price level?
————-
Then the question becomes, how should the Fed respond to the level of CPI? If there is a risk of higher CPI going forward, due to wages, and the Fed cuts, that could be a replay of the 60s. However, if we get a productivity boom, and the Fed cuts, we could get a return of the 90s.
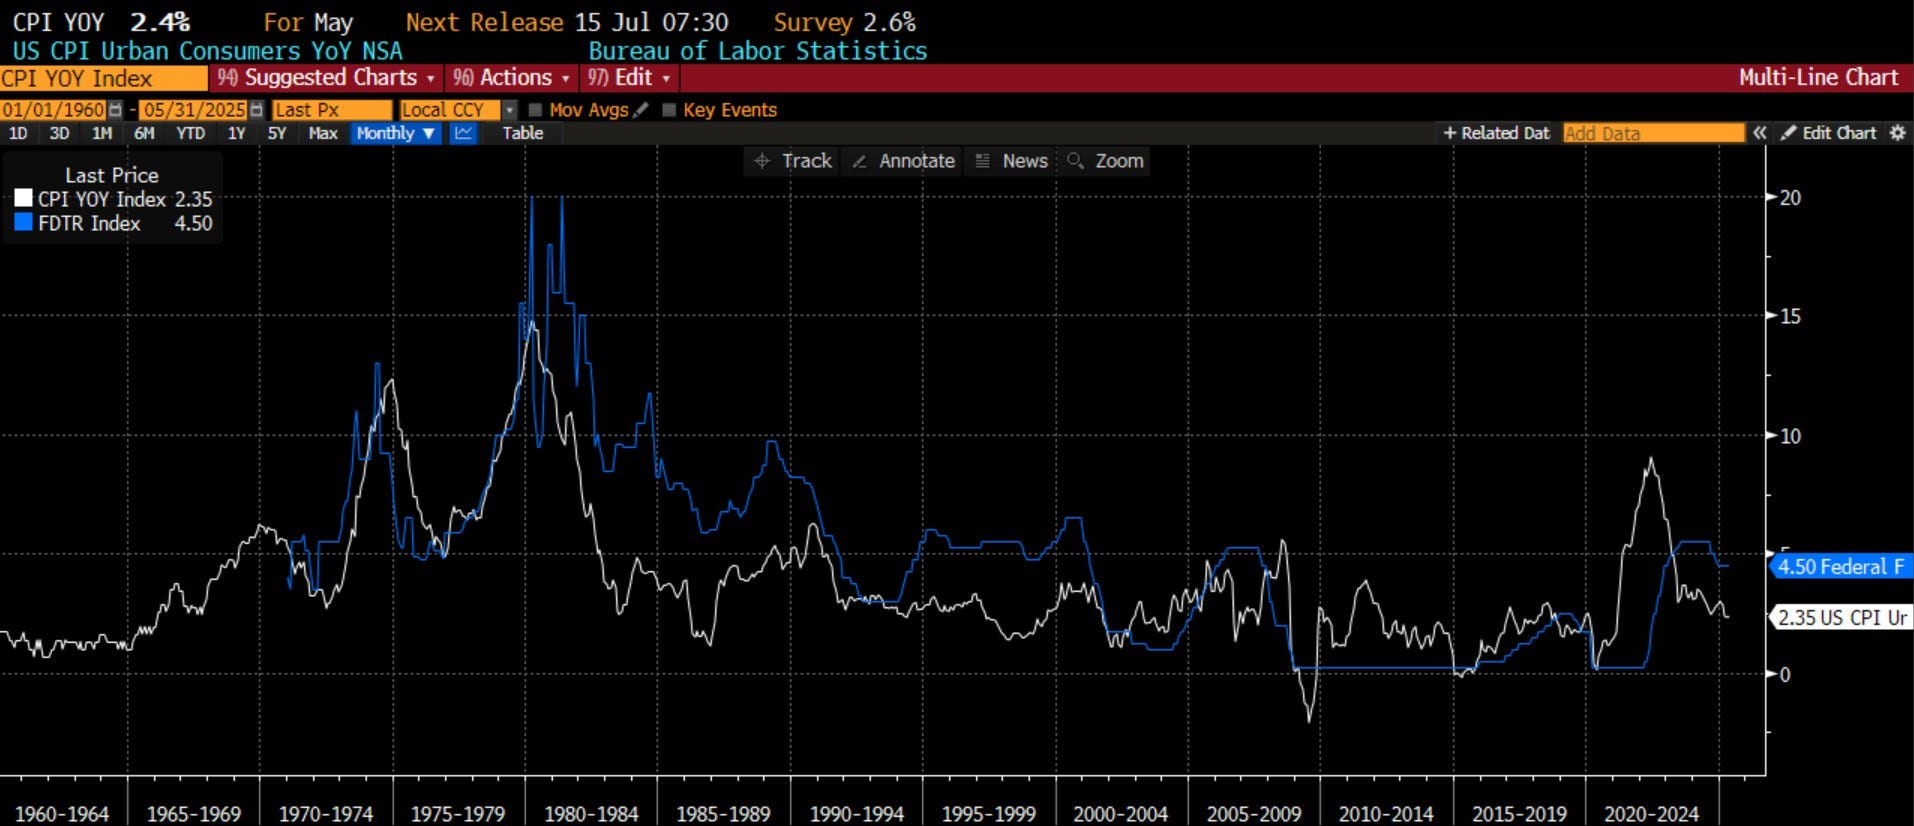
Chart of the Day - what's the biggest risk?
Yesterday I had a conversation about what I thought the biggest risk to the economy was. I said I thought it was persistent inflation that kept the Fed on hold
Now in my posts the last two days, I highlighted falling corn prices which could give a cyclical break to inflation, but rising wages which might give a secular lift to inflation
The more I think of it, especially after the passage of the One Big Beautiful Bill, it seems more clear that we could be on a path much like in the 60s and 70s. In fact, there are a lot of parallels, not a perfect match, but striking:
Fiscal Policy:
Then:
LBJ’s Great Society + Vietnam → soaring government spending and persistent deficits.
Now:
Post-COVID stimulus, infrastructure bills, rising defense budgets → trillion-dollar deficits in peacetime.
In both cases:
->Government becomes the primary driver of demand
-> Fiscal discipline gives way to political expediency
Monetary Policy:
Then:
The Fed hesitated to fight inflation. Real rates went negative. Inflation expectations became unanchored.
Now:
The Fed called inflation “transitory.” Real rates stayed negative into 2022. Sticky wage inflation remains
In both cases:
-> Central banks behind the curve
-> Markets test their credibility
Social & Political Mood:
Then:
Civil rights movement, antiwar protests, cultural upheaval. Trust in institutions eroded (Watergate, etc.).
Now:
Populism left & right. Campus protests. Culture wars. Distrust of media, government, science.
In both cases:
-> The social fabric strains
-> Political polarization rises
-> Markets start pricing volatility differently
Economic & Labor Trends:
Then:
Unions were powerful. Productivity slowed. Boomers flooded the job market.
Now:
Labor is gaining strength (UAW, Starbucks, Amazon). AI threatens productivity. Millennials/Gen Z are ascendant.
In both cases:
->The structure of the economy is shifting
-> Demographics drive both demand and discontent
History doesn’t repeat—but it rhymes.
Back then, the reckoning came via Paul Volcker.
Rates soared. Inflation was crushed.
But it took pain, discipline, and time.
Today, we face a similar choice:
Do we inflate our way out—or reset the system?
————
Building on that theme, and motivated by some headlines around tariffs on base metals, I continued:
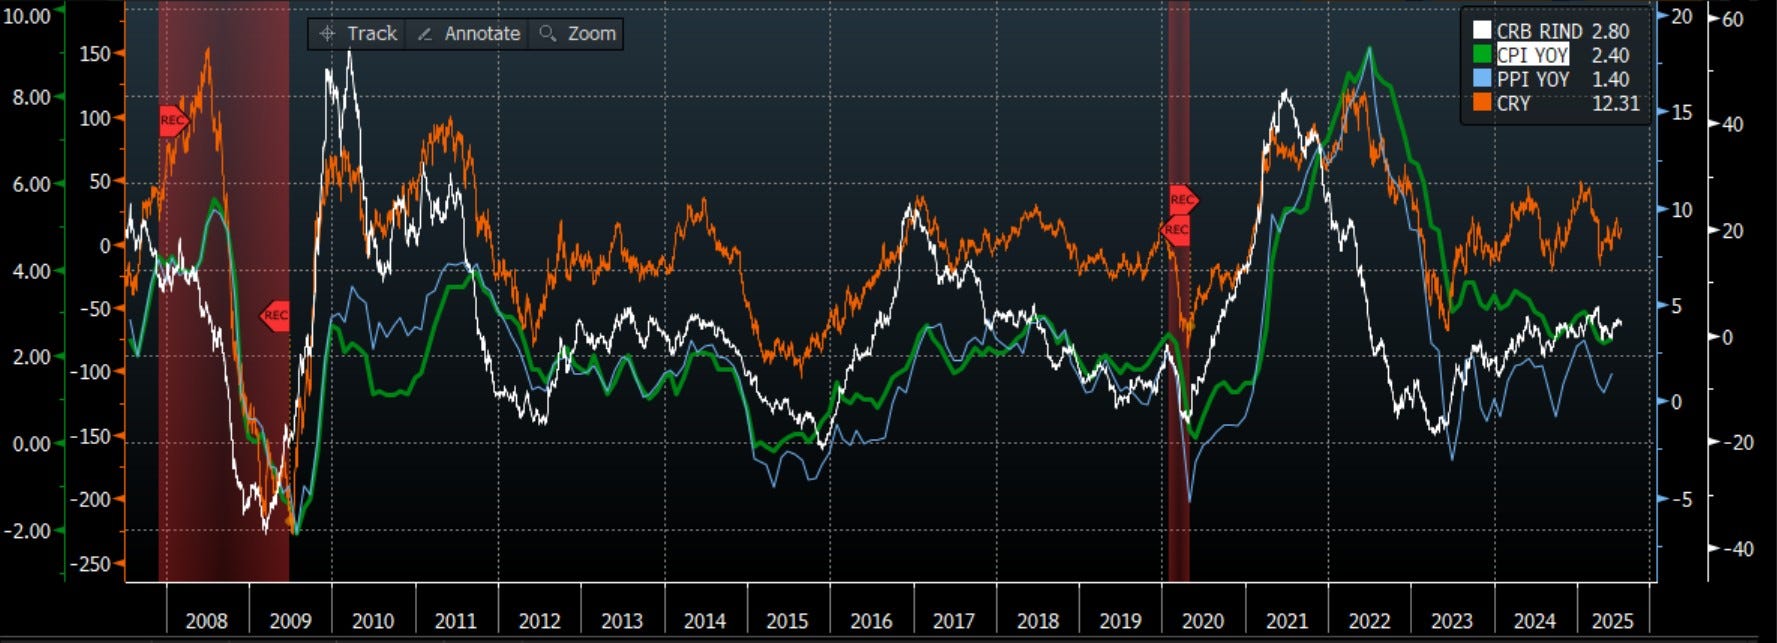
Chart of the Day - price shocks
Yesterday I compared the 60s & 70s to the current time frame
The point being that if this is the appropriate period to compare to, and not the late 90s as many suggest, we could be on the cusp of a period of runaway inflation, which makes all our lives miserable
What led to the runaway inflation then - a quick recap
1. Guns and Butter spending - we just got the One Big Beautiful Bill which essentially said 'hold my beer' to the Inflation Reduction Act and the CHIPS Act. There are no conservatives left in DC
2. Breakdown of the Bretton Woods System - we are seeing a massive re-ordering of global trade at this time. When long held order and systems break, bad things can happen
3. Wage price spiral - we are seeing every industry from airlines to restaurants go through this. Ford doubling the wages of assembly workers is just the latest. If you are a 35+ tech or financial services employee, perhaps you don't see it. For the rest, people are asking for, and getting, higher wages
4. Price shock from OPEC - then it was OPEC driving a surge in oil because of war in the Middle East. Now it is Trump imposing things like a 50% tariff on copper. It is a price shock
As I read the Bloomberg article on the copper 'news' and the disruption in the market, it referenced the raw industrials prices. The amount of US imports that are raw materials of some sort is not insignificant
The chart today shows four lines - the CRB raw industrials price, the CRB tradable commodities price, CPI and PPI
The first is the price of commodities not traded on an exchange. The volatility is lower as there is less speculation. The second is the price of commodities traded on an exchange. Yes, maybe more volatility, but more price discovery and more ability for companies to hedge. Then we have consumer prices and finally producer prices
You can see that through time, the raw industrials price (not influenced by speculation) and the tradable commodities lead the inflation we see. Yes, the speculators anticipate more and so prices are changing faster on a yoy basis than the raw industrials. However, both indexes are going higher on a yoy basis
Does this suggest producers can lower prices? PPI has been low so companies could reduce prices. However, if their input costs are going higher because of price shocks, that will need to be passed along
When it is consumers will see a higher CPI. When they do, they will ask for higher wages and we get the wage price spiral
The comparisons are pretty clear. Of course, all overlays are lacking, but are we in a period like the 90s or the 60s/70s? The reaction from the Fed depends on it
———-
So back to the question of what the Fed should do:
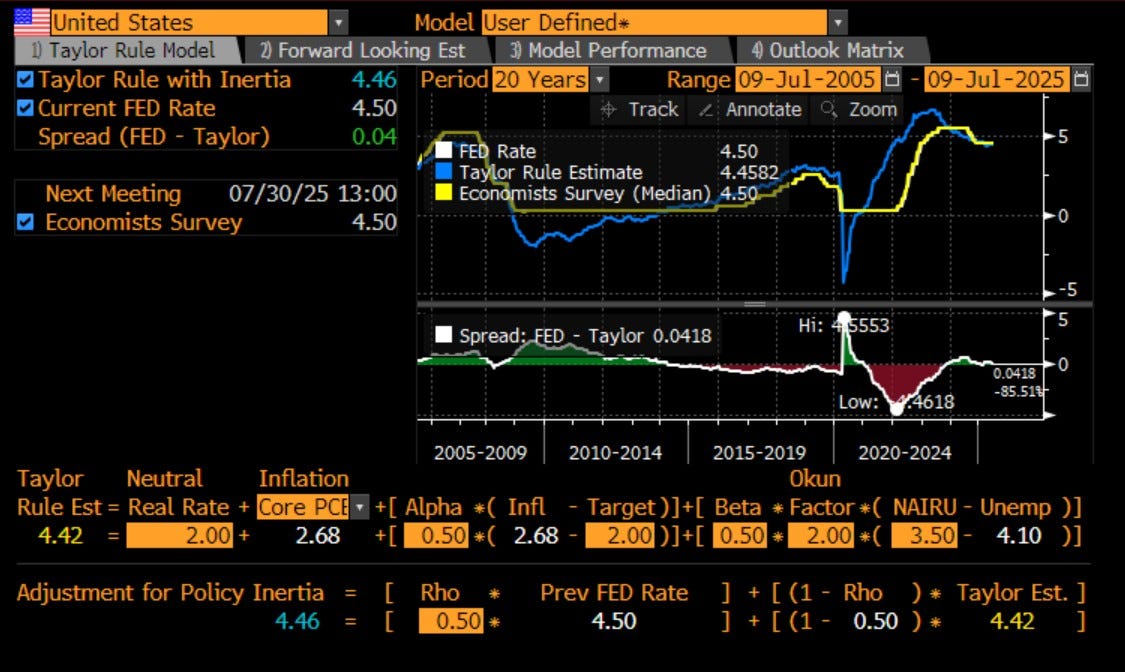
Chart of the Day - what should the Fed do?
The Fed tells you it is data dependent because of the uncertainty from tariffs etc
The market tells you the Fed will cut a couple of times this year, with inflation down each month and growth slowing. Though that is the bond market speaking. The equity market doesn't see any growth slowdown nor any weakness in pricing power
The President thinks rates should be 0.5-1.0% because, I think, that is where our 'competition' from the likes of the Swiss National Bank are
Ultimately, Chair Powell will be replaced, though we don't know exactly when, by a dove. There are already Fed governors and other members of the administration positioning themselves to be the most dovish so Trump will pick them
However, what if we replaced the Fed with an algo, the way so many other jobs are being replaced by an algo?
Its been tried and done before. That algo is the Taylor Rule, which uses estimates and targets for both inflation and unemployment, the Fed's dual mandate, to determine what the Fed Funds rate should be
What does it say right now? It says Fed Funds should be 4.46% vs. the 4.5% rate
Look at the chart. Not a bad fit and explains a lot of what we have seen. Back around the financial crisis, it said the Fed should be easier than the 0% rates we had. What did we get? Quantitative Easing which was the US's way of easing financial conditions without going below the 0% bound
In Covid, it instantly said get a lot easier. The Fed did with rapid QE which is why the recovery was V-shaped. However, then it said to tighten policy far more quickly. The Fed disagreed, calling inflation transitory, and we got very high inflation
Right now it is telling the Fed to do nothing, even though the market and the President are pressuring the Fed to lower rates
What will the Fed do? The right thing or the wrong thing (by the model). When it has done the 'right thing', the market has responded favorably. When it has done the 'wrong thing', the market struggled
What are your thoughts on this approach? What are your thoughts on the Fed?
——
I decided to do a poll, asking the audience what they felt. I don’t usually do polls, but my LinkedIn audience tends to be pretty smart:
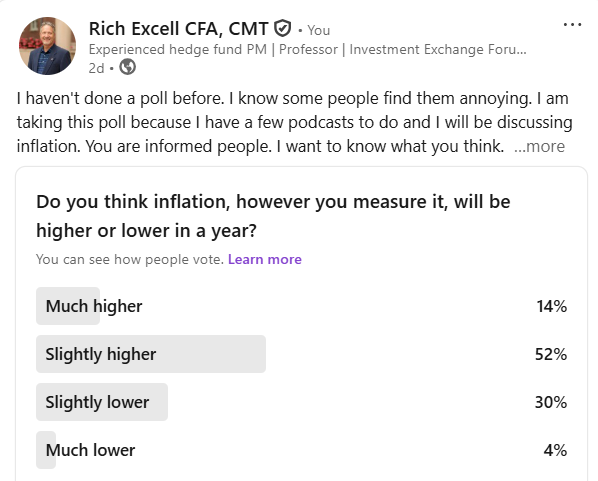
This is a statistically significant sample size, and two-thirds of readers think we see higher inflation. Of the one-third that see lower, they only see slightly lower. Do you think the Fed sees it the same way? With 100 bps of cuts only now making it into the system, does staying on hold make sense? Are markets prepared for that?
Since I asked real humans a question, I decided to ask ChatGPT a question about how one should invest in such an environment:
When inflation is sticky and persistent, especially due to a wage-price spiral, the performance of equity sectors becomes more nuanced. In such an environment:
Nominal revenues do often rise (because prices go up).
But input costs — especially labor costs — also rise.
The net effect depends on pricing power, labor intensity, and operating leverage.
Here’s how major sectors typically perform under wage-driven, persistent inflation:
📈 Sectors That Tend to Do Well
1. Energy
Why: Real assets, pricing power tied to commodities.
Inflation link: Oil & gas prices often rise with inflation.
Wages: Labor is not the biggest input cost.
Margin resilience: High.
Historical note: Strong performance in the 1970s.
2. Materials (especially miners, chemicals)
Why: They produce inputs whose prices rise with inflation.
Wages: Somewhat labor-intensive, but input price increases often outweigh labor costs.
Pricing power: High in commodities, but cyclical.
Risk: China slowdown or global demand dip.
3. Utilities (sometimes)
Why: Regulated returns often adjusted for inflation, and demand is stable.
Labor impact: Moderate.
Risk: If regulators lag in allowing rate increases, margins suffer.
Interest rate sensitivity: High (which can be a headwind).
4. Industrials (selectively)
Why: Pricing power depends on specialization (e.g., aerospace, defense).
Labor impact: High, so wage pressure can hurt.
Winners: Capital goods makers with strong order backlogs and automation.
⚠️ Sectors That May Struggle
1. Consumer Discretionary
Why: Cost pressures + weak demand elasticity.
Wages: High labor exposure (retail, restaurants).
Margins: Squeezed from both input and demand sides.
2. Technology
Why: High labor costs, especially skilled labor (engineers, developers).
Pricing power: Mixed — strong for monopolistic platforms, weak for commoditized SaaS.
Valuation: High-duration cash flows make them sensitive to higher interest rates, which often accompany inflation.
3. Healthcare
Why: Wage costs rising (nurses, techs), with reimbursement rates often lagging.
Pricing power: Moderate, depends on payer mix.
Winners: Pharma and device makers with patented products.
🤝 Sectors With Mixed Outcomes
1. Financials
Banks: Benefit from rising rates if yield curve steepens, but wage inflation can hurt OpEx.
Insurance: Mixed — inflation hits claims but helps premium growth.
2. Real Estate
REITs: Mixed — some (residential, industrial) pass through inflation in rents; others (office, retail) struggle.
Capex: Replacement costs rise, but asset values can too.
🔍 Key Traits to Look For in Winners
Pricing power (can raise prices without losing customers)
Low labor intensity
High fixed-cost leverage (benefit from nominal growth)
Asset-based revenue (real assets like energy, real estate)
Inflation-adjusted contracts (e.g., utilities, toll roads)
🧠 Historical Analog: 1970s
Sectors that outperformed during the 1970s inflation:
Energy
Materials
Gold miners
Select industrials
Some REITs (with rent escalation clauses)
Underperformed:
Financials (due to rate regulation then)
Consumer discretionary
Tech (then just emerging)

——
Interestingly, Phil Dauber just pointed this out in his Substack post this week:

Know what also works when inflation is high? Value vs. growth because value companies and sectors tend to be high fixed cost while growth companies and sectors are asset-light with high human capital investments. This may be adding to why these ‘services’ sectors are letting go of so many people:

Admittedly this look like the S&P value vs. growth which contains sector overweight/underweight and not just pure value vs. growth but the story is the same.
————
So now, I will leave you with a poll. What do you think?
Stay Vigilant

Good reading. Thanks.
must-read as always. ty for the shout out!