


3 x 3 on July 3
After a good amount of data, and ahead of the holiday, I wanted to look at the markets through the three lenses I like to use

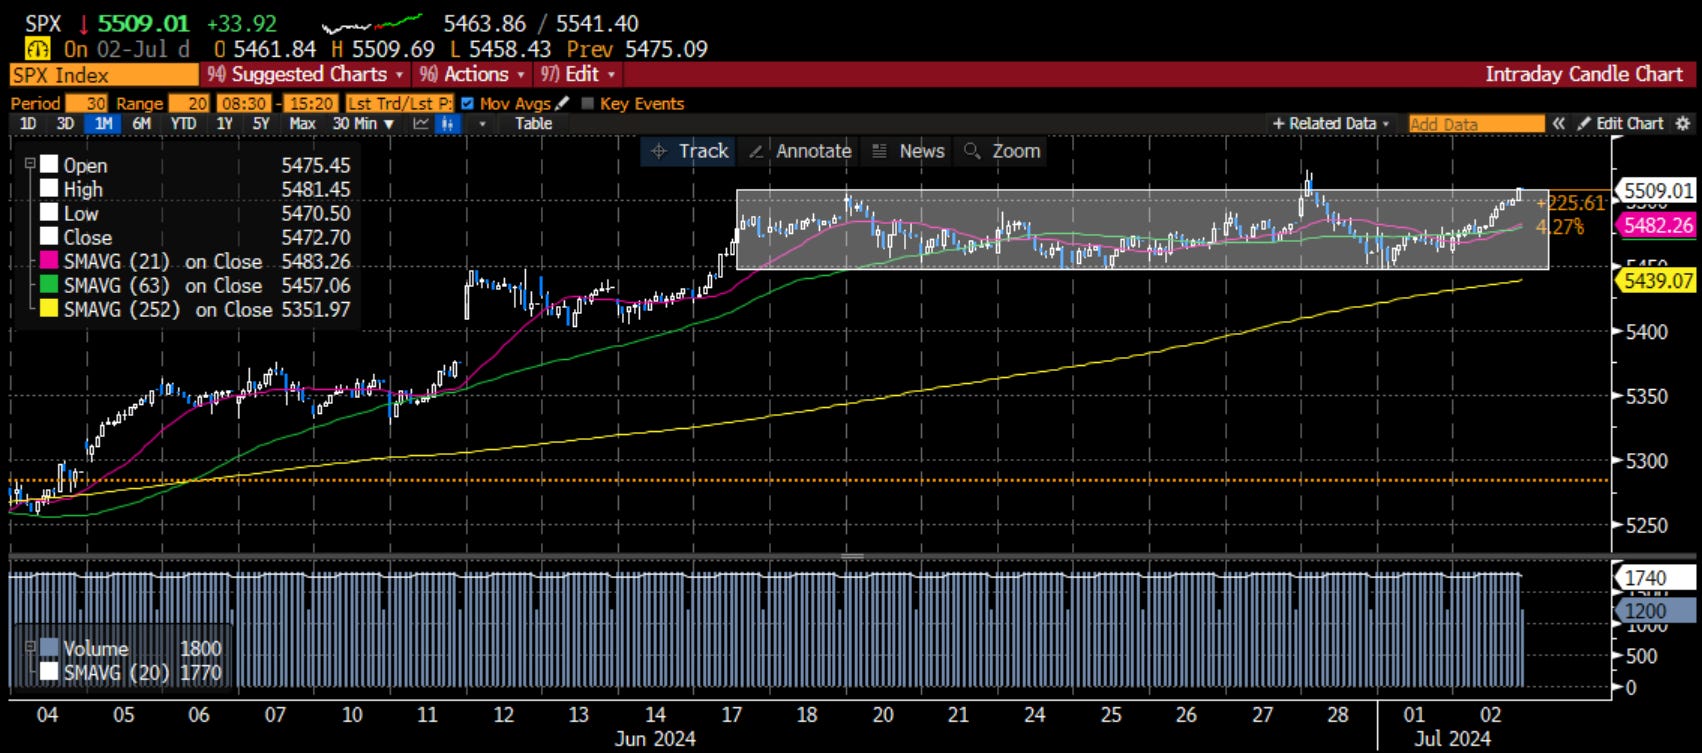
Thank you for being patient. I knew that my blogs, which regularly came out each week on Sunday, would be a bit more erratic. My summer schedule has been a bit crazy with mixtures of work and fun. However, I do know I haven’t sent anything since June 19. Interestingly, while we are near the all-time high levels, over this two-week period, the market has largely been in a range as you can see above. Is it set to break out and head much higher? Or is this near a triple top and we will see lower prices ahead? That is the question I had myself and the best way I know to answer it is to go through my three-body framework. Bearing in mind the advice from my wife to ‘keep it short’, I am going to limit myself to three charts in each of the three sections. Thus, we will bet 3 x 3 today.
Fundamental
H.O.P.E.
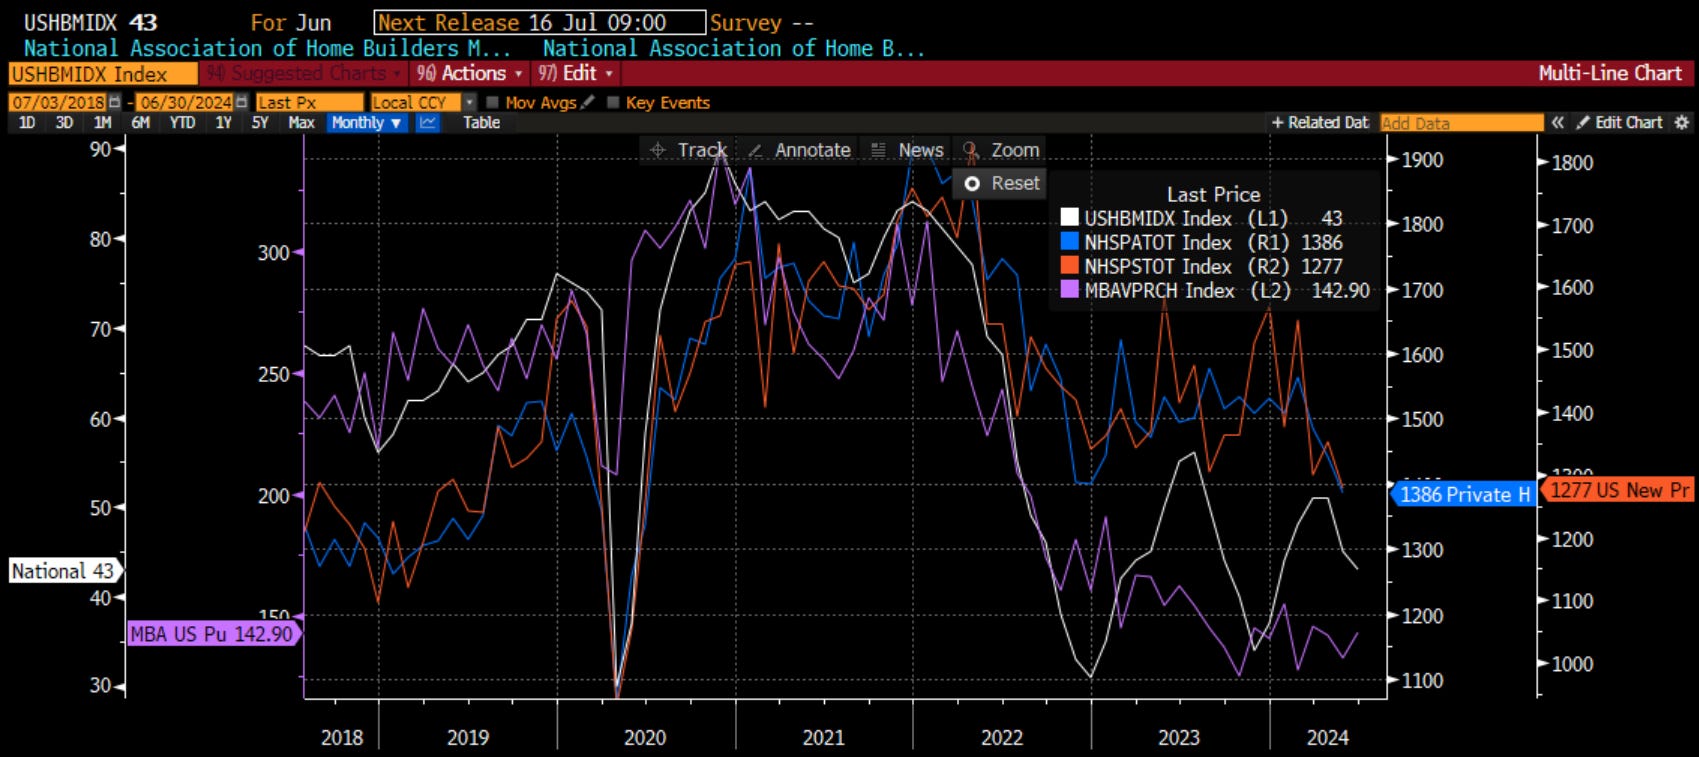
When I want to focus on the economy, the first step is always housing. I have described the acronym H.O.P.E in the past. It stands for housing → (new) orders → profits → employment. This is how money flows into and out of the economy. That is why the housing market leads the economy into and out of recession. This is the primary channel upon which the Federal Reserve anticipates that their actions will impact the economy. In 2023, as many (including me) were anticipating a recession, it was the housing market that remained strong and helped the US economy move along just nicely thank you. Even though the Natl Association of Home Builders (NAHB) fell late in the year (white), there was an early season rally that gave us hope. However, the data the last few months has been pretty bleak. Whether we look at the NAHB or some other anticipatory indicators such as Housing Starts, Building Permits and Mortgage Bankers Association Purchase Index, all are pointing lower. Sure, mortgage rates have dipped below 7%, yet they are a far cry from 4% (I doubt they go back to that level). Importantly, the weaker housing numbers may be indicating that either prices are too high for young buyers to step in, or even more worrying, that the jobs market is weakening such that buying a house doesn’t feel like the best idea. We will hear more about jobs this Friday. Homebuilding stocks have noticed. Since March, these stocks, which led the way last year, have fallen 16% on a relative basis. This is a worrying sign for the economy and we know the economy leads earnings and earnings lead stocks.
ISM
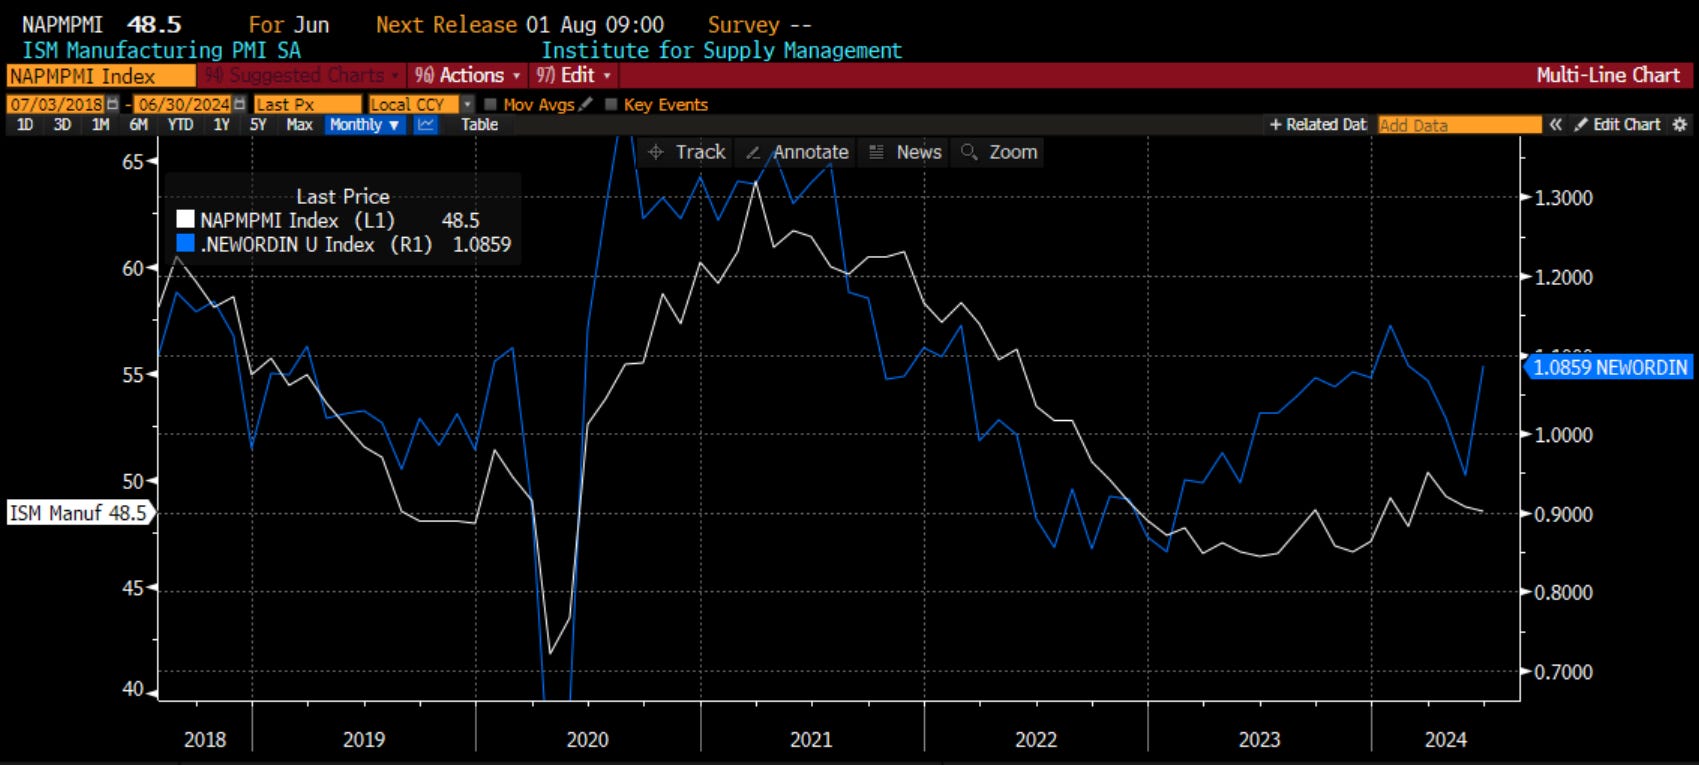
My next favorite economic indicator is the ISM. I have discussed in the past why not only I think it is better than GDP, but the market clearly does as well, if you look at the movement in yields and the performance of stocks based on ISM, which we don’t see with GDP. In fact, recall that stocks have their best period when the ISM is below 50 and rising (bad economy but things getting better) but their worst when it is below 50 and falling (going into recession?). The ISM is coincident with the stock market, both of which are leading indicators of the economy. We got that data this week, and it fell to 48.5, lower than the 49.1 that was expected. So, here we are below 50 and falling, the worst time to own stocks. It is not a recession, as the 50 level is only increasing or slowing growth. the actual recession line is around 45, so ISM is telling us things are slowing but not in a recession yet. However, within the ISM, there are components that actually lead the leading indicator, or anticipatory indicators. For me this is the ratio of new orders to inventories. When companies feel good, they are ordering new stuff as inventories deplete. When they are not, inventories are building, and they slow their orders. This ratio also signaled economic strength last year. All of this year, it has been falling, though. This month, it bounced sharply, more so because inventories fell as new orders were below 50. However, I ignored this ratio at my peril in 2023, and I do not want to ignore it now. One point does not make a line, but I can’t ignore that it was some positive within an otherwise negative number.
FSI
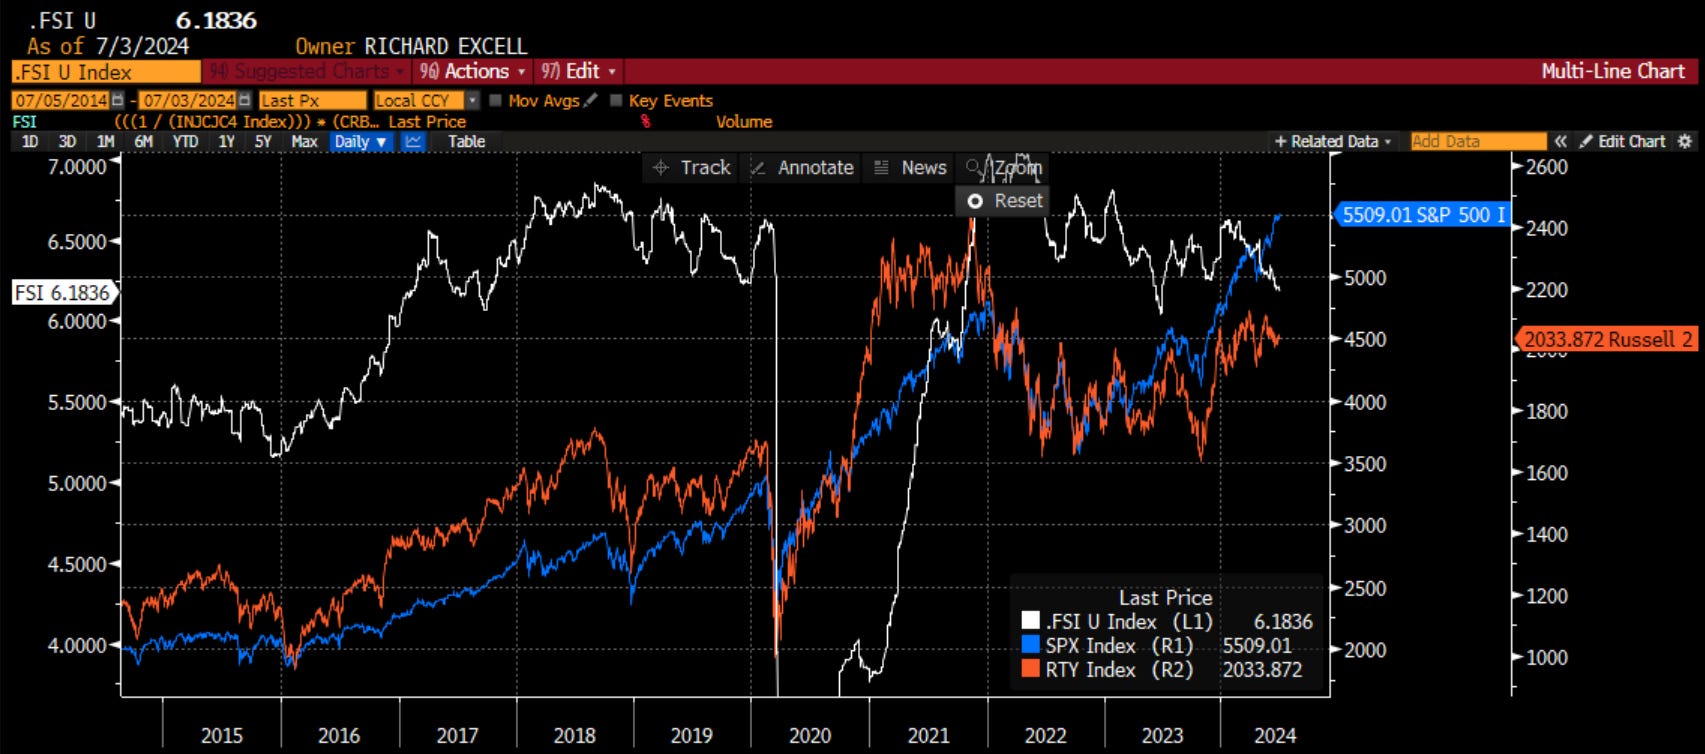
Back in the early 2000s, the market legend, strategist Ed Yardeni, introduced me to the Fundamental Stock Indicator that he had come up with. It was a simple index that looked at jobless claims, CRB raw industrials prices, and consumer confidence. The logic being these three measures were a good proxy for how the overall economy is doing from both a corporate and consumer basis. If we know the trend of the economy, we know how the stock market will do. I show this index in white vs. both the SPX and RTY. I increasingly think that the SPX is going to continue to ignore data because of the AI effect on a handful of very large stocks. The small caps can’t ignore the data, which is why we are seeing a bifurcated market. This measure had some struggles around Covid as jobless claims introduced a lot of noise, but looking closely, it still does a good job. It rallied in late 2023, presaging the stock rally (including especially small caps). In 2024, it has been consistently falling all year long and is back near the lows of last summer. This gives me reason to be cautious.
Summing it up, I feel the Fundamental section is negative right now. Weak housing, falling ISM, year lows in FSI. Sure, there are some things to be hopeful about, namely the new orders to inventory. There is also other positive data. Right now for me, looking at my favorite charts, I have to be negative on the Fundamental.
Behavioral
Technical analysis
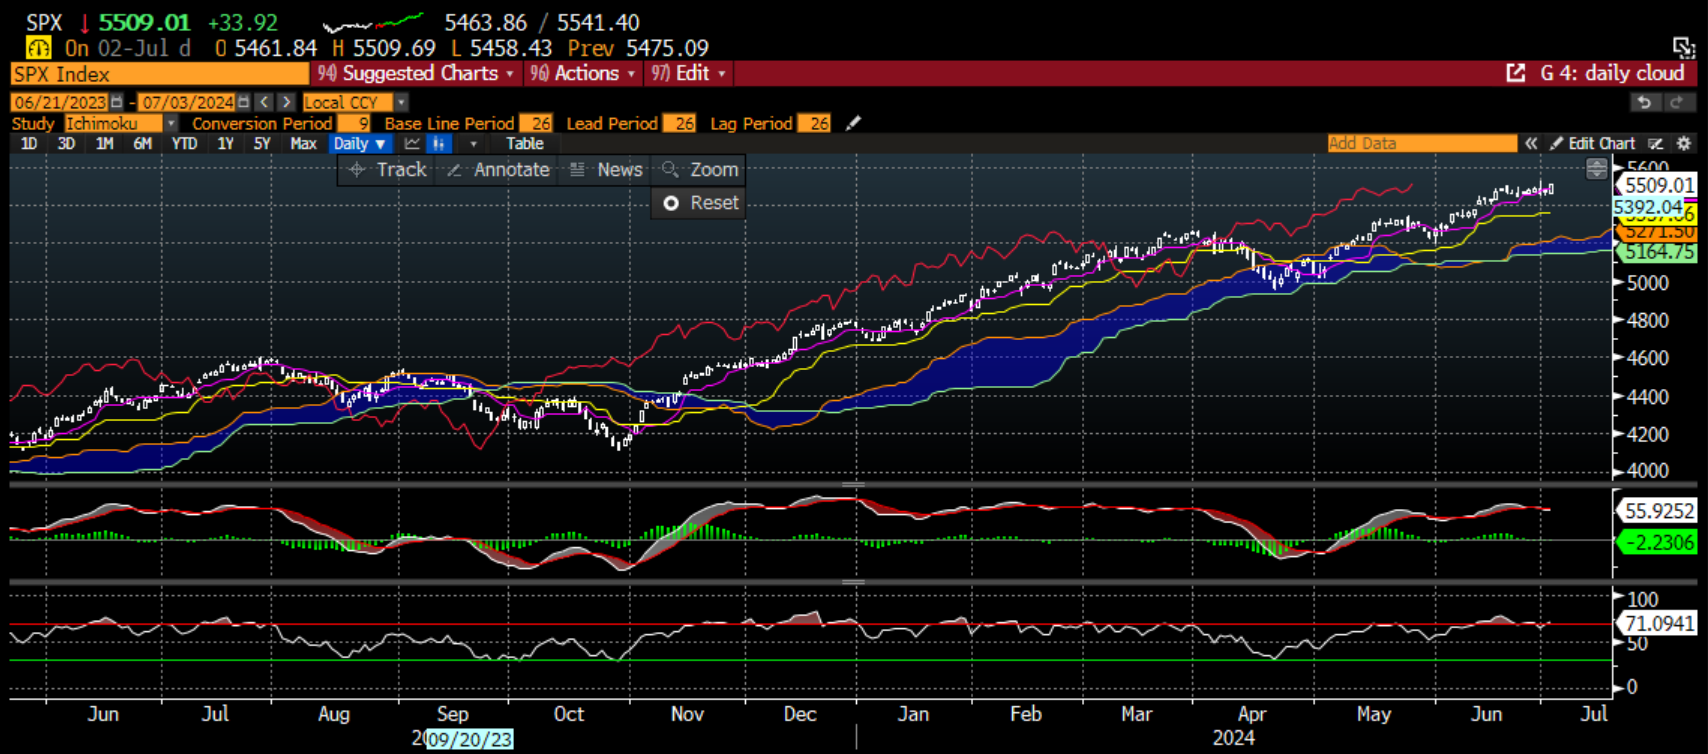
Price is the intersection of supply and demand. There is power in understanding this. This is one of the core tenets of technical analysis. When we sit at our desk and try to guess if there are more buyers than sellers, or larger buyers or sellers, the first thing we really need to do is look at price. Thus, my first step in assessing the behavior of the market is to look at the charts. The first thing I see when I look at this chart is the power of the trend in the SPX right now. Since last October, the SPX has been on a relentless mission to move higher. This trend is still solidly intact. The ichimoku cloud, which is a measure of the price and volume of where buyers and sellers are conducting their business, is moving higher, though the pace of which is beginning to slow somewhat. I still believe the trend is positive. The warning signs are more in the middle and lower panels. The middle panel is the MACD or moving average convergence/divergence. When the moving averages converge, it is a sign that the recent trend is beginning to change. When those average diverge again, it is either a new trend or the resumption of the trend. Right now, we are in convergence which suggests some near-term indecision in the market. The lower panel is more worrying from a short-term basis. This is the relative strength index (RSI) which measures how price compares to the index’s own history. We see that the RSI is elevated which means the market is in an overbought position. The combination of the MACD and RSI give me pause technically, though given a strong trend, any move lower would just be corrective in nature. That correction, though, could pull back to the cloud support around 5200 which would be a 5% correction. Enough to note.
Options market
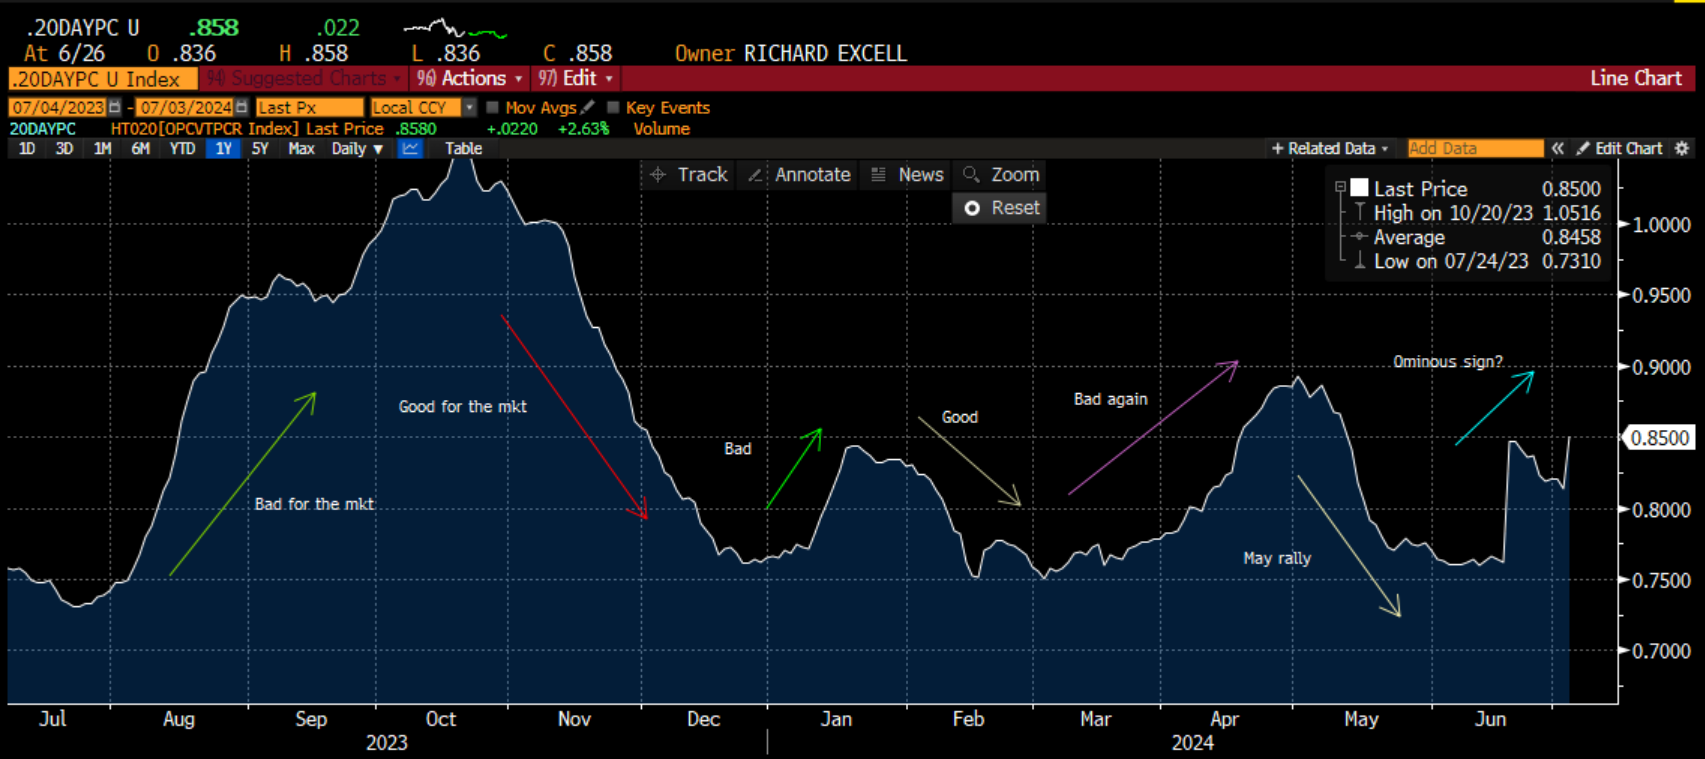
I started my career in the options market, so I always believe there is a great deal of untapped information here. Options are insurance, but insurance that can be bought OR sold. Thus, assessing how the market’s insurance is trading can give us insight into the mindset of investors. I have shown it before, but the best indicator in the options market, for short-term moves, is the ratio of put volume to call volume for the total market. I smooth it out with the 20-day moving average. When this average ebbs and flows, it either leads or confirms moves in the market. A rising put-call is bad for stocks, and a falling put-call is good. I have shown you these periods and think back to how stocks did then: they fell into the end of last summer and then rallied strongly, a strong rally into March of this year but then weakness in April, May was very strong. Now, this ratio is telling us that there could be weakness ahead. This is only a short-term indicator and not one that tells us what will happen for more than a month but it is one that we need to pay attention to.
Multiple indicators into one
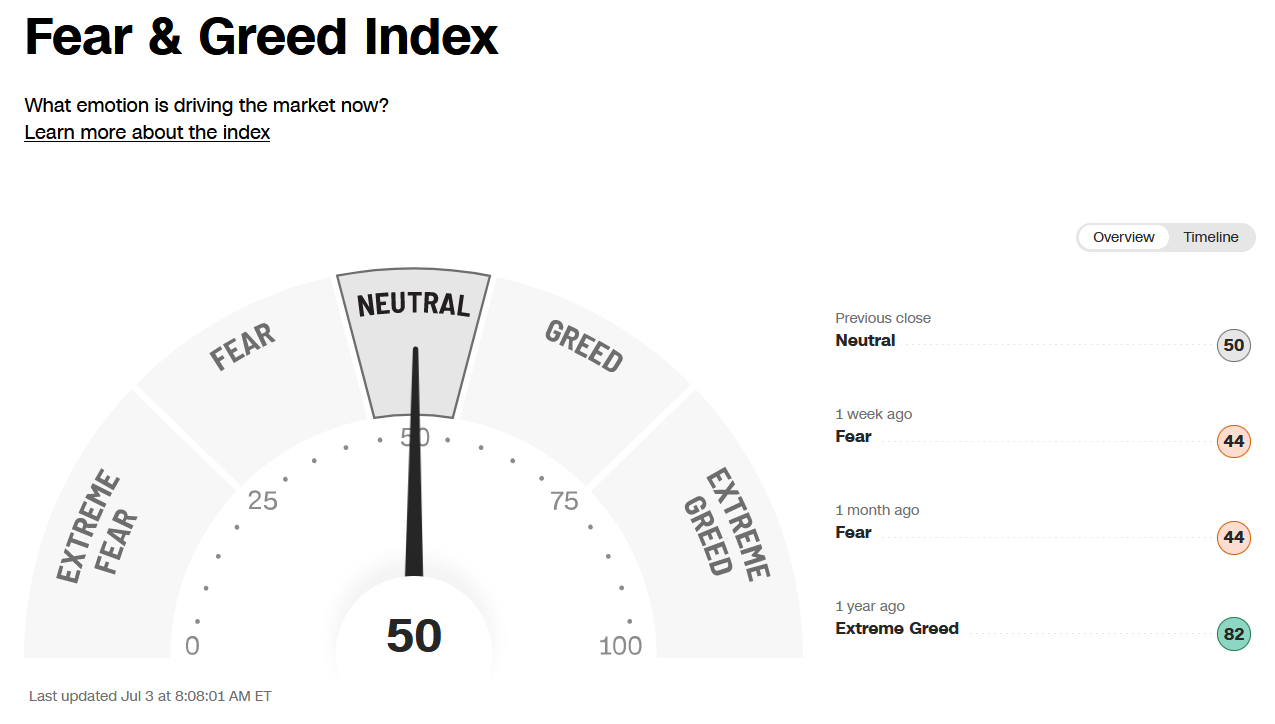
I like the CNN Fear and Greed Index (maybe the only thing of value on CNN anymore, which is sad to say because living abroad in the 90s, CNN was the only Americana we could grasp onto). It looks at 7 different market measures to assess if the market is feeling greedy or fearful. It resided in greed for much of last year. The last month or so, it has been in fear, which is surprising to many as the market is at all-time highs. However, these internal measures were suggesting caution. Right now, it is at neutral, which is not a state we normally see. This tells me we are about to swing one way or another. For now, the market is not leaning one way or another and will likely be responsive to moves in either direction. Since this measure encapsulates many others, I think it does a good job of showing the confusion many traders and investors may be feeling right now.
In summary, I think there are reasons to be concerned in the very near-term for the stock market. The trend is still in place, so I do not mean to indicate that this section is pointing to massive bear markets. However, it does point to confusion and overbought conditions. It points to investors demanding more insurance as they are either confused or nervous. It points to a possible 5% correction in the near-term. I think it is negative.
Catalyst
Markets have bulls and bears. The key is always to gauge what, and when, either will change their minds. This is why I like to look at catalysts. We never really know what will be the match that lights the kindling, but I try to look at three potential areas of catalysts here.
Economic surprises
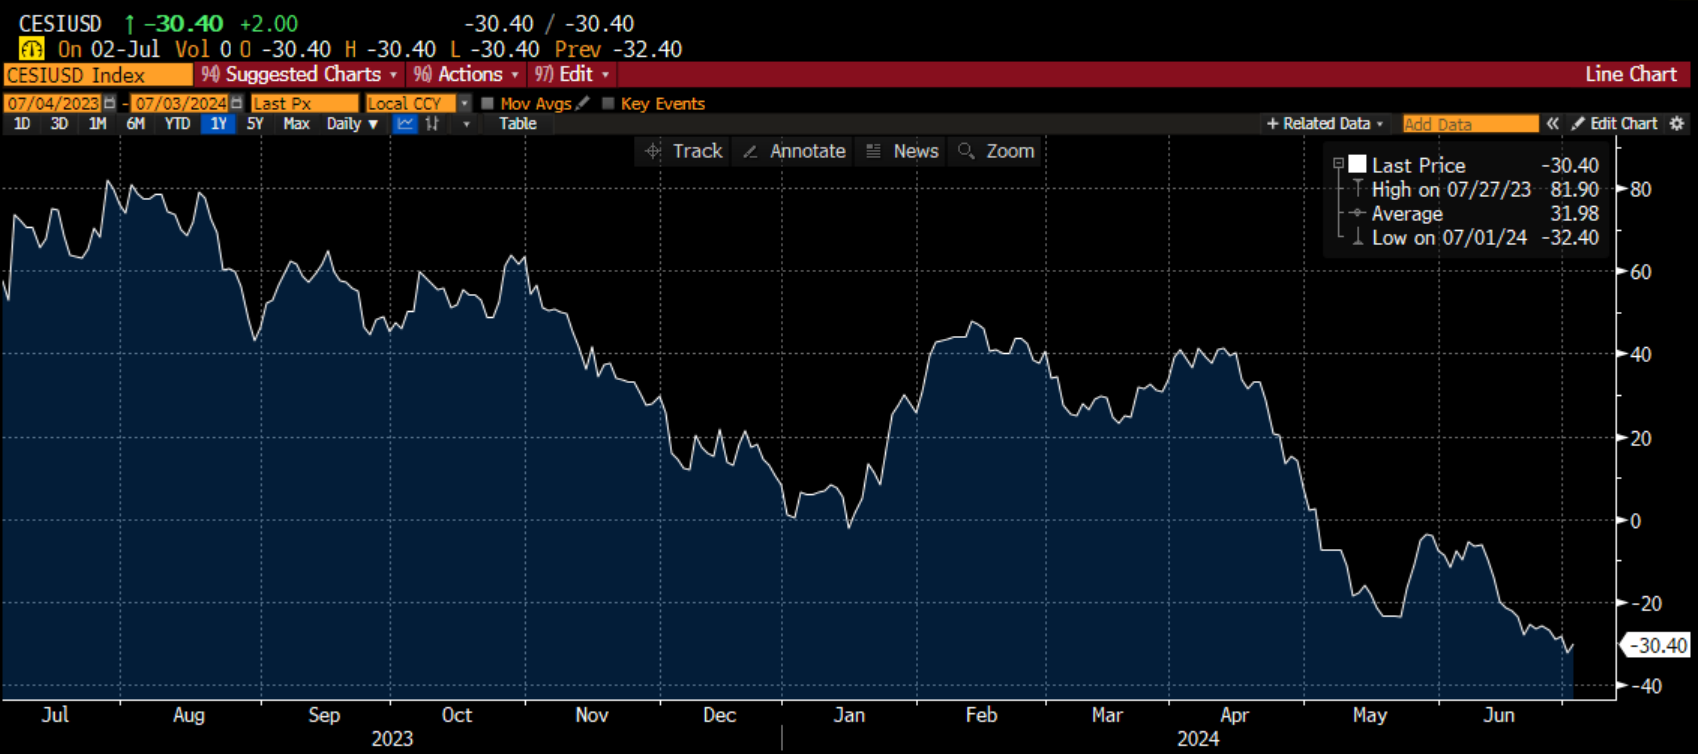
The first possible area to assess is economic surprises. I highlighted how the trend is not positive for the economy. What gets people to change their minds? In the Citi economic surprise index, we don’t get the absolute level of the data, what we see is how the data are coming out relative to expectations. It is a mean-reverting time series because as data beats (misses), expectations move up (down) making it harder to continue. This chart shows that the economic data has been consistently missing the mark since April. In fact, this time series is about as low as it gets. This tells me that expectations are going to be lowered and sometime soon, we will start to see data starting to beat, probably on a consistent basis. Initially, the market may not like this because it may suggest the Fed won’t cut. However, better data should lead to better earnings expectations so it would be positive. In fact, this time series doesn’t really predict the SPX itself, but is correlated to where the SPX trades relative to its moving averages. For now, bad news has been good news that we are getting a soft landing and the Fed is out of play. I think the news will begin to look like good news, but will this be taken poorly or well? We shall see. Remember, if this moves higher it doesn’t mean the data is actually good, it just means it is better than expected.
Earnings surprises
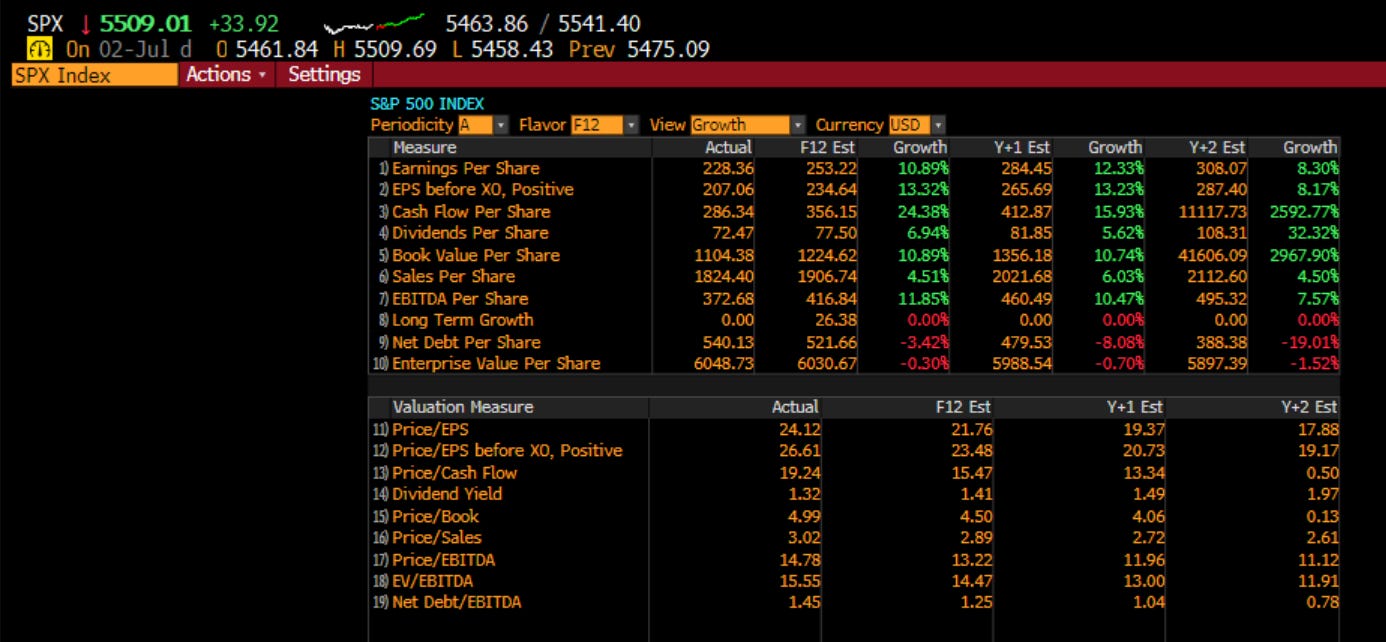
We will be going into an earnings season in July, when we come back from the holidays. The banks will kick off earnings around July 12 or so. Earnings have been a driver of higher stocks, not because they were great in an absolute sense, but they were positive and better than expectations. If we look at current expectations, though, the bar has been raised. Here I show the next 12, 24 and 36 months expectations for the SPX. The bar is even higher for the Nasdaq and the Russell believe it or not. The expectation is for double digit earnings growth in the next year, and each year after. This is a high bar for an economy where the trend is moving lower, not higher, and where Fed policy might finally be having an effect. Of course, for the SPX, five names might be enough to establish that earnings are fine. I would be cautious, though. The bar is really high and at some point, the numbers just won’t be good enough. We have already seen some pre-announced numbers from consumer stocks and all of these numbers are bleak. Yes, bad news tends to come out earlier, so maybe this just gets it out of the way. I think we need to be careful.
Geopolitics
The last thing I want to look at is geopolitics. Elections around the world are showing a populace that is NOT happy with the status quo. We have seen this in India and Mexico, where the expected candidate won but their mandate was weakened. We have seen in in the UK, France and across Europe, as far right or far left candidates are winning elections. We just had the first round of elections in France and Marie Le Pen’s party was the leader. While not as much as expected, she is still in the driver seat. Tomorrow, we will get UK elections, where Nigel Farage’s Reform (Brexit) Party is actually leading the Tories. OMG.
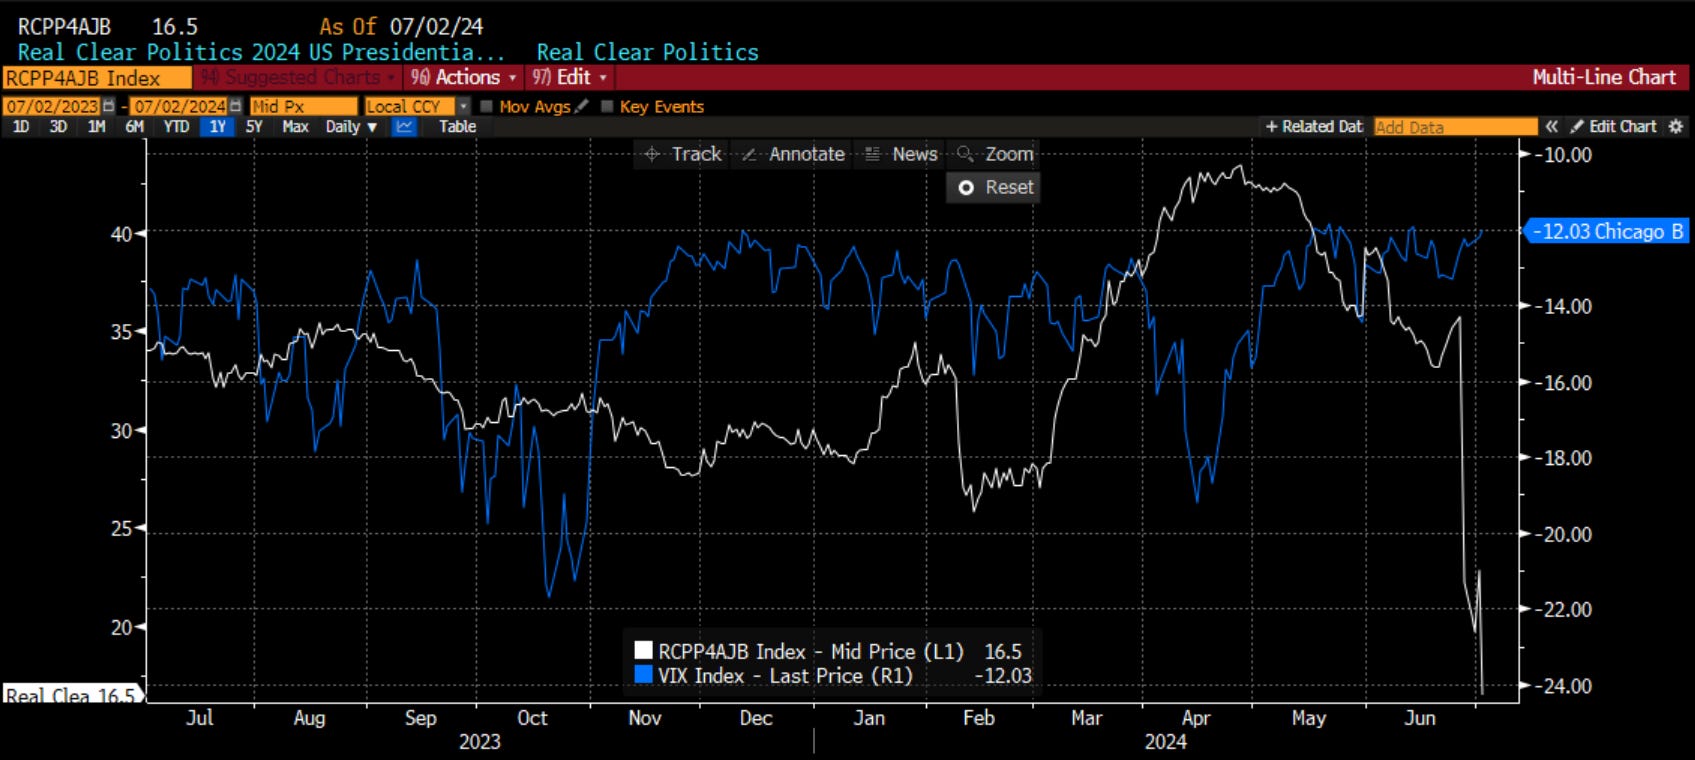
The US election season kicked off last Thursday with a debate. Depending on your view, it was a disaster. As an American, I can say it was a disaster that this is what we have come to. However, looking at the betting markets the next day, the odds of Joe Biden winning the election plummeted. You see that in white above. From 45% to 16%. Today, we have the Democrat Governors meeting in D.C. to convince Joe to step down. This is a very dangerous situation because if they say he is unfit to run, this means the Dems have been lying the last 6-12 months. It also means people voted for a candidate but now will not have a chance to vote again for a new candidate. It throws the entire democratic process into disarray. Recall that the Democratic Convention in Chicago in 1968 had severe unrest. Could we get a repeat in August in Chicago of this year? I don’t know but I do not see how this will not cause uncertainty and volatility. I have the inverse of the VIX Index on this chart. It suggests the VIX could double from 12 to 24. While that may not happen, I think it is fair to say the next month or so, as we determine if Biden will run, and if not, how the new candidate is chosen, could potentially lead to a lot of volatility. We saw this in Europe, I think we see it here.
Thus, I think this section is also negative. Sure, the economic data will surely begin to be better than expected. Will this be well-received though? Earnings may in fact beat as they tend to do, however, the bar is quite high right now, more so than the last few quarters. Finally, the state of the election might be thrown into disarray, leading to a lack of faith in our institutions, something which has been declining anyway and does not need help to spur events.
Across the board, from fundamental, to behavioral, to catalyst, I am feeling more negative than at any time this year. Maybe it is nothing. Maybe it will go away. For me, I want to reduce risk, add insurance, and watch how things unfold in the coming month. I want to …
Stay Vigilant

Happy 4th, Richard and kudos to your wife for her feedback. I love the new concise SV format.
Quick question: Is the Yardeni fundamental stock indicator publicly available somewhere? Yardeni has a ton of good free content and charts on his website. I have not been able to locate his FSI chart. Thanks