A lot has happened since we last spoke
From mid-term elections to changing Fed expectations to a massive crypto implosion, the investment landscape has been hit with quite a bit this week. What does it mean going forward?
It has been a heckuva week to say the least. We had a US mid-term election on Tuesday, where the Red Wave that some expected because Pres. Biden’s approval rating is in the 30s did not happen. In fact, it was more of a Blue Wave if anything (more below). On Thursday we had a better than expected CPI number that led to a 5%+ move in the US markets, which only happens 0.09% of the time in history (hat tip FC), even though I would argue it is further evidence that we are going into a recession. Finally, we can’t ignore that the entire week had extensive coverage of the FTX fraud/liquidation/scandal which culminated in a hack on Friday that stole over $600mm from the company. With all of these stories and price moves, it is extremely difficult for any investor, professional or retail, to sort through the events and determine what to do. When this has happened in my career, I always want to step back and look at all of the trends, all of the signals, and try to ignore the noise, so I can make sense of it. That is what I want to do today.
FUNDAMENTAL
Those who have been reading me know that I like to break my approach into three parts - Fundamental, Behavioral, Catalyst. I call the three-body problem. It keeps me balanced and focused.
For the fundamentals of risk, I look at the economy. The economy drives earnings, and earnings drive stocks as I have said many times. I also like to look at the world through both a growth and inflation outlook because the different phases of growth and inflation inform the performance of asset classes, countries, sectors and styles. For growth, I prefer the ISM (or PMI in other countries) because it is coincident with the stock market and both lead the GDP number.
I have shown the chart here before that the only period with negative average returns for stocks over time is when the ISM is below 50 and falling. Investors know this and thus try to be out of stocks when this happens. If the ISM is below 50 but rising, this is often the best period for equity returns because this is when the economy is in recovery. Above 50 and falling is also positive returns and this is why near inflections, we can see such choppy price action.
Interestingly, a recession doesn’t correspond with 50 in the ISM. This is even though 50 is the % of respondents that say things are getting better vs. worse. However, historically, a recession doesn’t happen until ISM drops below 47 actually. I have drawn those lines on the chart. You can see several dips below 50 in the post GFC era when a recession didn’t happen. You can also see this in the 90s and in the 60s. You have seen many, and I have shown several, different overlays of these various periods to see if any resemble the current. JayPo wants us to think it is the 90s and a soft-landing. Many others point to the 60s & 70s. Regardless, we are on the brink of dropping below 50 which is bad for stocks, but will we go into a recession?
If I look now at the trailing GDP, and compare both nominal GDP and real GDP, as can see that those periods when we didn’t have a recession (post GFC, 90s, 60s) were periods when the difference between nominal and real were low and steady. It was a period of low economic volatility.
The difference between the two is the GDP deflator. Those periods we reference, the GDP deflator or difference between nominal and real was about 2%. In the 60s, this deflator was trending higher and this ended badly. In the 90s, it was trending lower which is why we had a bull market. In the post GFC it was flat which is why it was a low volatility environment outside of exogenous shocks. Right now is not one of those periods.
In fact, CPI came lower this week which led to a massive short-covering rally. How do I know it was short-covering? I have this table courtesy of PD which shows the performance of the market and sectors on a market cap weighted basis and a short-interest-weighted basis. Tech, Discretionary and small caps led the short-covering charge:
Was it justified? I have shown my CPI forecast vs. actual before. I use a number of measures including money supply, commodity prices, inflation expectations etc. It has run below the actual all year. However, through time it has led the actual. Finally, we saw the move lower the market was expecting. However, if I look forward, I can see this ticking higher. This is not a good sign. If we look at what ‘missed’, it was health care costs, user car prices and airline tickets. The former was an anomaly and will reverse next month. The BLS estimates out of pocket health care from insurance company earnings. The latter two are indicative that we are going into a recession.
However, the market priced a full rate hike out of the next 1 year. You have seen my 1-year hike chart before as I have used it to look at forward earnings yields. As the number of hikes came lower, so did the earnings yield which is another way of saying the P/E went higher.
I wrote about this on LinkedIn on Friday:
“Chart of the Day - narratives. FinTwit has been ablaze of late. The crypto bulls have finally been silenced by the bears due to the latest FTX fiasco. Of course the bears do not win humbly & graciously but instead pile on even tho the best they can say is they were not involved. In the equity mkt, the bears are hurting after yesterday's multiple standard deviation move. The bulls, who have been under siege, are positing that this is an inflection point & we finally get a Santa Claus rally.
Near term trading & positioning aside, what has really changed in the last day or so? Yes, inflation had the first downside surprise of 2022. This is notable & most likely shows the lagged effects of Fed policy kicking in. The mkt responded by taking a full 25 bps out of the terminal Fed Funds, and the odds of 50 & not 75 in December moving up. This is notable & healthy for risk. However, it is still a 50 bps hike in December. We still see another 50+ in early 2023. The Fed is not stopping.
One other thing that JayPo said was higher for longer. Perhaps the doves on the FOMC (& they are there) were appeased with the CPI number, but even with an eventual pause, how long can we stay higher? As my colleague MM says 'the area under the FOMC curve just got a lot larger'.
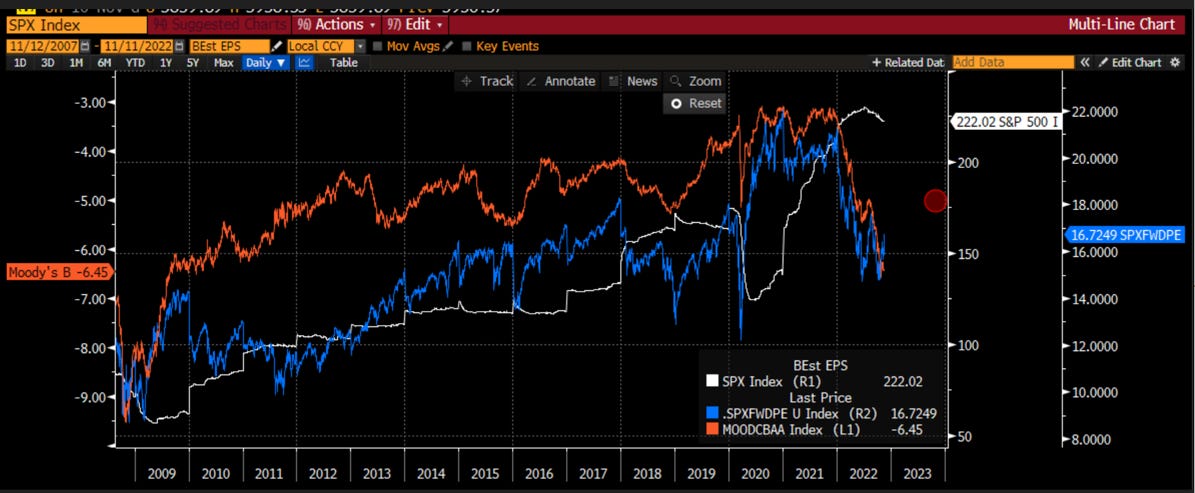
For equity investors, simplistically we care about 2 things - earnings & multiples. Earnings drive stocks but changes in multiples anticipate the move in earnings. The earnings line is in white and it is rolling over as has been forecast all year. 4Q estimates are dropping by more than 3Q estimates had. The end of year eps is around $220. I have put the red dot where some estimates for end of 2023 are & that is $180. Maybe this is extreme (really only looks to be on trend) but say we are $200 or 10% lower.
Then look at multiples. You can see in blue it leads eps on the upside & the downside. Mutliples are a reflection of the fwd looking nature of mkts & investor sentiment. They are a function of discount rates. For that the orange line is the (inverse) of the Moody's Baa corp rate. This takes into account Treasury rates & spreads. It leads multiples. In spite of the good news yesterday, these lines didn't budge. What is the best forecast for these? Will corp rates move lower? This is a function of the 10yr (higher for longer) & spreads (fincl conditions/liquidity). Will we see a 2009 or 2020 spike higher as eps collapse? That is what bulls are hoping for. What if we just moderate at the avg of the last 15yrs? That would be 5% rates & 17.5x P/E. Credit spreads have avg'd 2.5% the last 15 years. Does the 10yr go to 2.5% too? Your call.
$200 * 17.5 = 3500 SPX. That assumes a moderate decline in eps and a moderate increase in multiples/decrease in corp credit. This isn't wildly bullish or bearish. It is lower than where we are now (4000). 4000 requires flat eps for the next year & P/E back above 18. Know what you are buying.
Stay Vigilant”
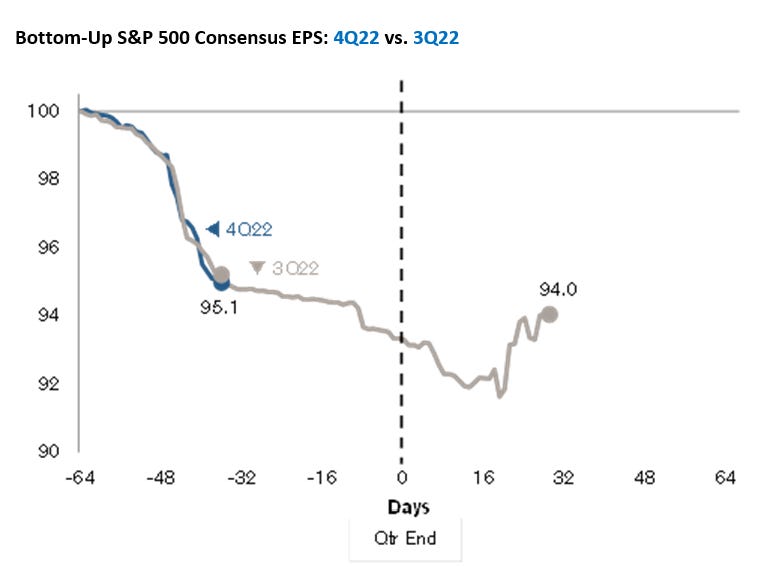
About those earnings. For the next several charts I am borrowing from Jonathan Golub at CS who does excellent work. He has actually been more bullish than the norm, particularly when it has come to earnings. However, he is not painting a bullish story now. First, bottom-up analysts are cutting estimates as quickly as they did in Q3:
An 4Q estimates are actually much worse than the historical average. It is not surprising to cut Q4 because typically analysts are bullish and in Q4 we are running out of room to get to the estimate. However, the pace of cutting is more than normal:
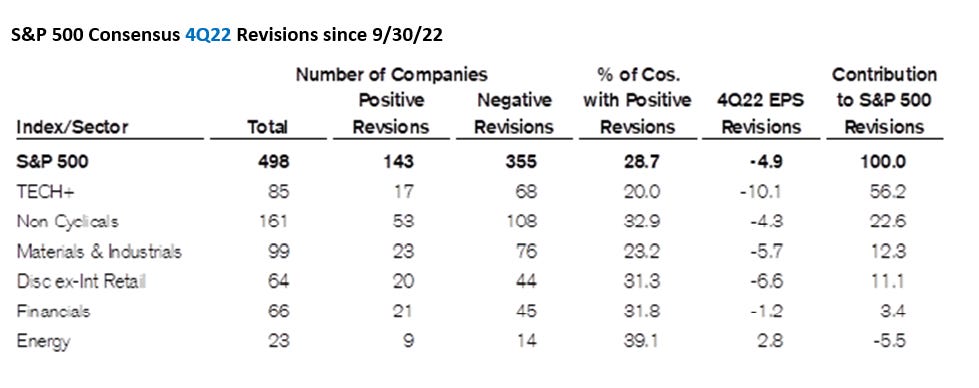
If we look at where this cutting is coming, we can see that TECH and Discretionary (recall the two sectors that had the biggest short-covering rally on Thursday) are where estimates are being cut the most. This is why hedge funds were short. This is why the rally is likely not sustainable.
As a reminder for the sectors that had the biggest negative revisions in Q3:
Now this is what those look like in Q4:
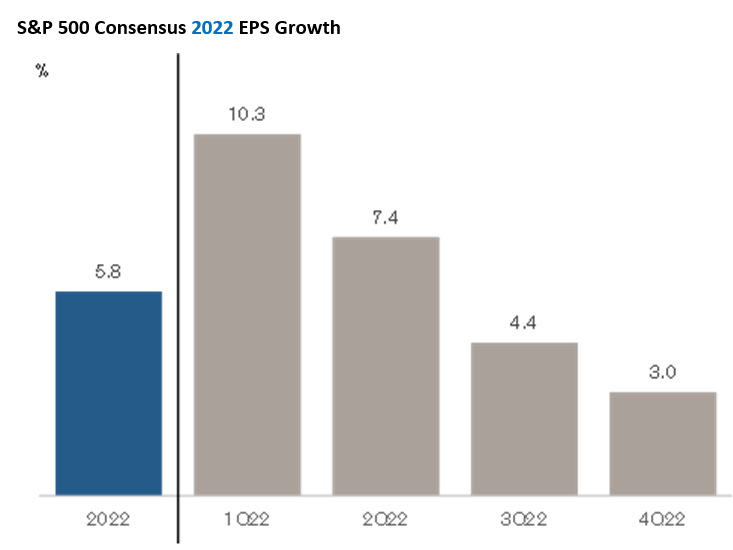
Finally, this is the quarterly progression of earnings this year. If we look into Q1 of next year, in light of the lagged effects of Fed rate hikes and rapidly slowing housing, would you bet for higher or lower earnings?
All in all, the FUNDAMENTALS for risk-taking are not attractive. We are set to move below 50 in ISM which is a negative period for stocks. In fact, we are most likely headed below 47 and a recession is in order. The reason is inflation may not have turned that corner as fast as we all hope. The Deflator certainly gives no sign of hope nor does the CPI forecast. This suggests that even if the Fed starts to slow and multiples can slowly expand, I am still not convinced, that earnings will carry the day. In fact, when the earnings bull paints a negative story, it gets me to think that the $180 number for SPX next year may not be that far off. Even if we put 20x P/E on that, which is a struggle in a recession, that still points to lower prices.
BEHAVIORAL
The behavioral portion is where I try to assess the supply and demand of the market. This positioning information can help me better understand near-term moves that may or may not be in alignment with the medium-term fundamental trend.
To start that process, I like to look at the Commitment of Traders report. It gives a good sense for what the faster moving money is thinking.
In looking at that report, we can see that leveraged investors (CTAs/HFs) are and have been short the SPX in good size for the last several months.
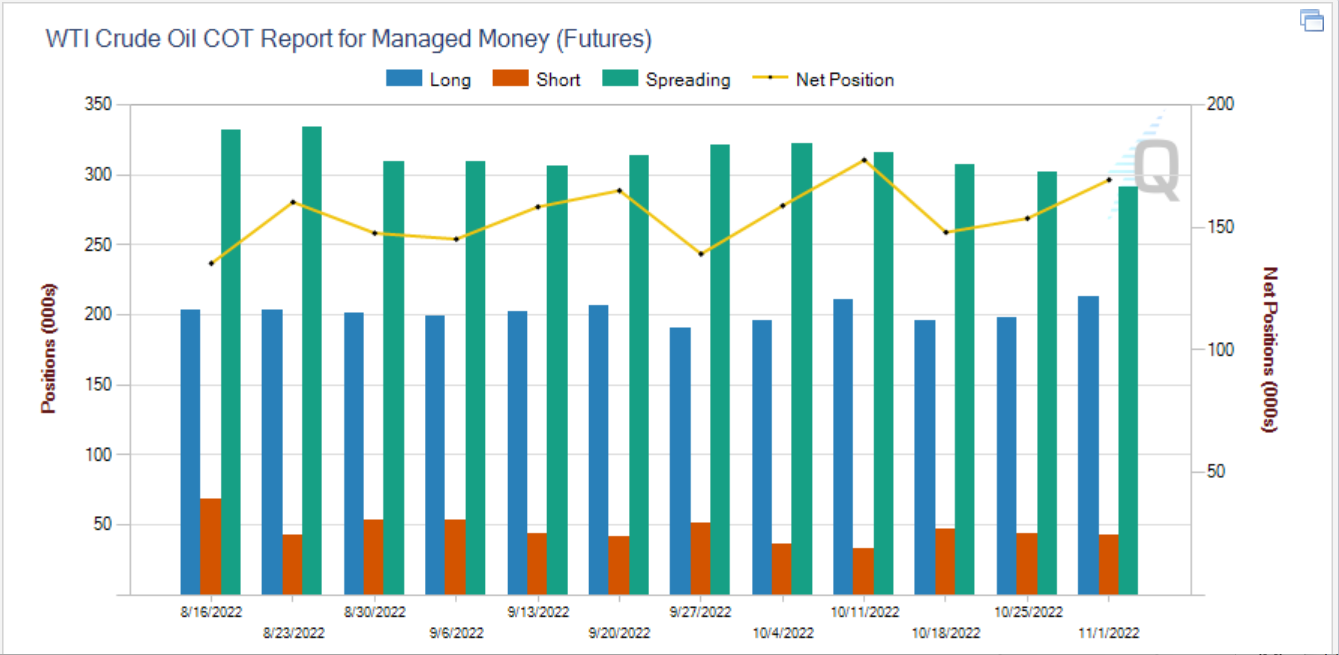
Managed money is actually still long oil futures though. Betting on a return of higher prices now that the SPR release is over and OPEC+ is reducing production? This paints an ugly picture of stagflation.
We can see the same leveraged funds are still short Secured Overnight Funding Rate futures (SOFR) betting on the Fed to keep hiking, but the amount of the short has been decreasing and is at the lowest level of the past few months.
That is all the professional investors. What about retail? Despite the criticism of the AAII data, it still remains the gold standard of retail investor sentiment imo. When the difference between bulls and bears gets above 20 or below -20, an inflection point in the short-term is typically not far away. It is a sign that too many people are on the same side of the boat. All summer long we were not only below -20 but often below -40 which is more negative than even during the GFC. We have bounced back from that a little but still sit below -20. Retail is still bearish.
Another positive sign for risk-taking is the put-call ratios. This measures the volume of put options trading vs. call options. Investors seek put options only when very nervous because this insurance is a drag on returns. I look at the 20-day moving average to take out the noise. We can see this average had gotten to one of the highest levels of the last 10 years - hedgers/traders were pretty bearish. That is now rolling over. When this measure rolls over, it is a positive sign for risk.
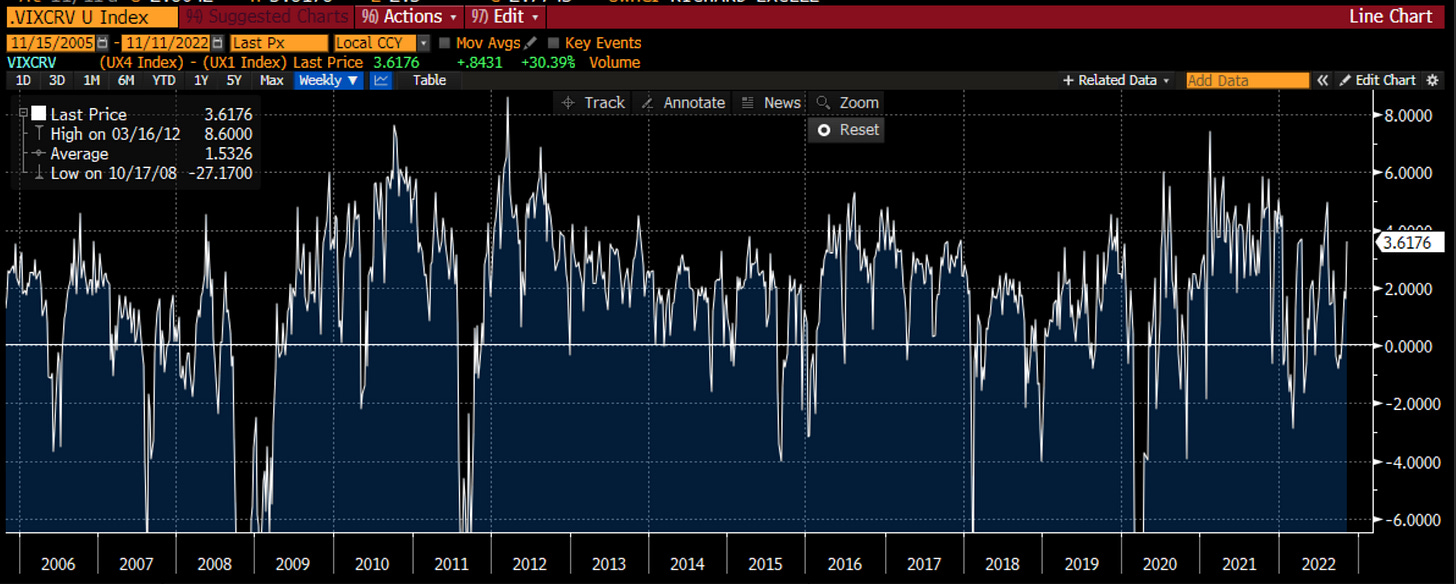
Another way to assess the sentiment in the options market, which measures what people do more than what they say, is to look at the shape of the VIX curve. The VIX curve is normally upward sloping. This is because people don’t seek insurance in the near-term unless really bearish. When that fades, the premium for the front-dated options reduces and the upward slope returns. We had gotten to a VIX curve that was inverted at the end of September/early October. That has quickly reversed and are back into a normal position in the VIX - a positive sign for risk.
The place where there is clearly negative sentiment that is growing is in crypto. One measure that people like to use to gauge sentiment in crypto is total market cap of all coins. I refer to Coin Gecko for this data. We can see that in late 2021/start of 2022, we had a total market cap around $3 trillion. With all of the scandals and therefore lost of confidence in crypto, this has fallen to about $850 billion. This gives a sense of the loss of net worth for those involved in crypto. On a plus side, and given global stock markets have lost $20 trillion this year, it probably suggests that even if this number went to 0, it probably wouldn’t have much more contagion for public equities. Perhaps for private equity/VC it is a different story.
One area of crypto that I know I and many people from TradFi could embrace and understand was DeFi. We could see the choke points in TradFi and see where there could be a potential for disruption. However, DeFi market cap has fallen in % terms even more than crypto overall. At less than $50bb, it may not be big enough to matter right now.
Now is time for a mea culpa. Two weeks ago, I said I thought that Ether and Bitcoin might have better reward to risk for an end of year rally than the NDX. I said that Ether had the catalyst of The Merge and Bitcoin appeared to have good support below 19k. On the other hand, the NDX eps were falling and JayPo was crushing multiples. Well, while I still stand by the rationale for how I came up with the thought, it was clearly wrong. We can see that since the Halloween post, Ether has fallen more than 20% relative to NDX. I have a lot of egg on my face (and some losses) as a result.
The overall behavioral impulse for risk-taking still has potential. The positioning in equities is quite negative. This means any good news will have an out-sized impact on stocks. We saw this on Thursday of this past week and we could see it again on good news from Black Friday or the Fed or Ukraine. However, there are still things that are broken and money being lost. Crypto is the latest place we are seeing things break. Recall we saw it breaking in the world of pensions with Liability-driven investing. Both ends of the spectrum - high risk-taking crypto and long-term pension/endowment - have had their businesses called into question. The biggest pain right now is in crypto. For an idea of where this might be felt the most, I submit a chart from Michael Cembalest from Feb of this year showing Asia high net worth accounts probably are feeling the most pain:
Though US venture capitalists were all in. The time for institutional involvment in crypto has probably been set back years at this point:
CATALYST
The last thing I look for is a catalyst - what will change someone’s mind? Each quarter it is earnings season, but we just finished that and it didn’t really change the calculus. As I showed earlier, the expectations are starting out a little bleak for Q4 but that is early.
Another potential catalyst is the economy. We saw this with the CPI data this past week. However, good growth is not good for stocks now because it means the Fed is in play. Bad growth is not good for stocks because even if the Fed is out of play, it hurts earnings. So the economy is not really where the catalyst will happen.
The last place I like to look is in geopolitics. Ukraine has been the big story this year but not the only story. Zero Covid in China and now Xi Jingping’s historic third term also play a role. Iran and its rising influence in the Middle East may become more of a story. Matteo Iacoviello, formerly of the Fed, calculates a Geopolitical Risk Index. While we are well below the February Ukraine spike, you can see that the level of risk has been steadily climbing all year and looks akin to what we saw in the early 00s. This was not a good time for the world or for risk-taking.
We also just had a US election. The hope/expectation was for the GOP to win at least the House if not both the House and Senate. The rationale was that gridlock would be good because fiscal spending would slow down, making it easier for the Fed to do its job, and perhaps slowing the rise of the US debt to GDP which has now hit 130%. However, as I mentioned before, President Biden and the Dems had a big positive outlier in performance.
Some suggest it was due to the topic of abortion. The polling data do not suggest this. The polls said people voted on the economy and jobs as the top issue but a wide margin.
The Dems won because Independents preferred them, not because of turnout issues. Why? Everyone is asking the same questions but it appears to be a strong repudiation of MAGA candidates that denied the 2020 election. On the one hand, this may be a good turn of events if the country can move on from that period. On the other, if Dems do control Congress, watch for the bond market to panic because of a worry of debt levels setting new records. We are still counting votes in many places and have a run-off for Senate in Georgia. This is a potential negative for risk.
Finally, I just want to leave you with one last chart. This entire crypto crash this year has a lot of earmarks of the dot-com bust and the Enron/Worldcom/Tyco fraud all rolled into one. That was the period from 2000-2003 that really negatively impacted risk-taking. This last chart overlays the Bloomberg Crypto Index and the NDX Index from the dot-com. While the internet still turned out to change the world, and blockchain/smart contracts/web3 may as well, we have to acknowledge this will be a cloud over risk-taking for quite some time.
Pulling together, the fundamentals for risk do NOT look very good. The behavioral aspects point to a market that could have these fits of pro-risk taking but the catalysts going forward all appear to be potentially negative events. Throw into this the cloud on risk from crypto and it is hard for me to be anything but negative at this time.
Stay Vigilant









Another amazing article. I really enjoy all of them. I learn so much.
Absolutely loving your content Richard, would you be open to allowing us to share it with our 60k+ audience as well?