


A trip on a rainy day
Inspired by my trip to the St. Louis Science Center, I look at technology vs. energy


Came down to St. Louis to visit my son this weekend and encountered some cold, rainy weather. While not ideal, it was certainly better than the sub-zero weather we had not too long ago. However, when it is rainy, you are always looking for good ideas of things to do indoors. Based on some recommendations, we headed to the Science Center.
It was a terrific place, though clearly much more to do for young children. That said, there are always interesting facts to learn about science and fun applications of different technology to demonstrate how things work. Besides, the Mars exhibit, we definitely spent the most time in the areas designed around technology and around energy. The technology was much more about 3D printing than AI, and the energy was much more about solar/wind/electricity than about fossil fuels.
Of course, I always turn these observances into the current trends in the market. These are all markets fads that have come and gone though there are clearly more lasting effects of the latter than the former. However, from a sector standpoint, that has not been the case.
The story in the market this year is one again the Top 7 vs. the rest of the market. Looking at the SPX Index less the Top 7 names compared to the market-capitalization weighted index, we see that we are back at all-time lows last seen before the sharp rally in November and December that appeared to be broadening out the rally. Instead, that appears to be nothing more than a Q4 beta-driven, behavioral rally to help traders’ bonuses.

The relative chart above looks a LOT like the relative performance of the SPX vs. the NDX (or the RTY vs. the SPX for that matter). The Top 7 performance is the driver for this entire facet it seems.

We can visualize that the technology vs. energy trade is part and parcel of the NDX vs. SPX trade. Yes, it is not a 100% fit, but the core driver of the relative index performance comes down to this sector decision.

Breaking down the sector performance for the last 3 months, we can see some pretty lop-sided performance. Technology (and communication services) has definitely been driving the bus, while energy has been left in the dust. In fact, it is the ONLY sector that is negative over this period. Can this sector outperformance continue?

Looking at the SPX technology sector performance vs. the energy sector performance over the last 5 years, we can see that we are more than two standard deviations from the mean. We have plunged below the levels from the end of 2021, after which energy proceeded to go up by 100% which clearly reverted some of the relative performance, but not all of it.

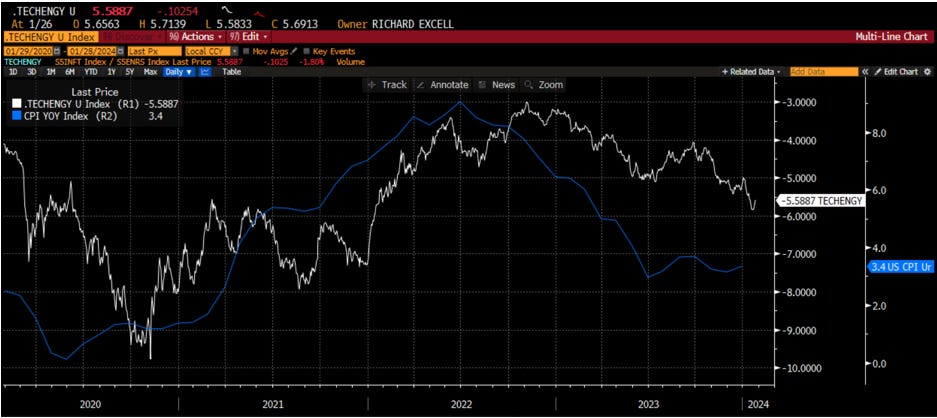
What is the driver behind this sector performance? As my students in Applied Portfolio Management have been studying the last two weeks, the biggest driver of this relative sector performance is in fact inflation. Inflation benefits energy (and other commodity sectors that have high fixed costs) as the increased pricing allows these companies with higher operating leverage to get to pricing drop straight to the bottom line. However, the technology industry is actually negatively impacted by inflation, particularly when it is high enough that it starts to impact wages. Technology has high variable costs, largely employee salaries. Thus, higher inflation means wage compression, which is a drag on sector earnings. We can see below that the move higher in CPI coincides with the relative outperformance of energy, while the falling CPI, that has been the tailwind for the markets broadly, has really been the driver for the relative sector performance as well.
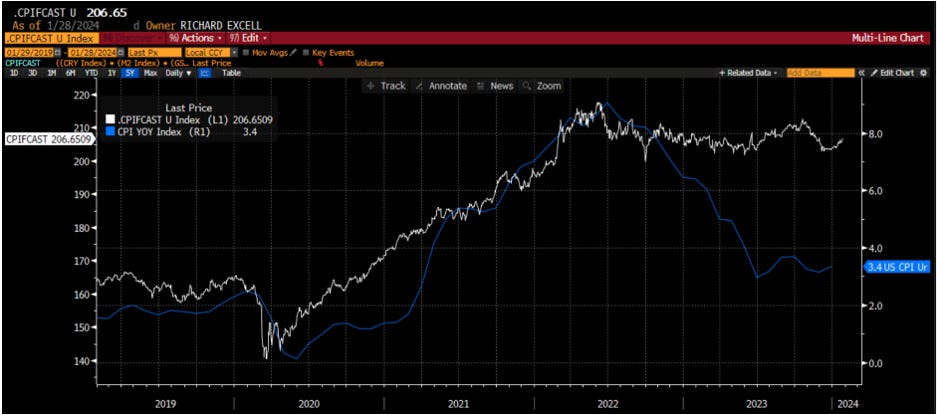
If the sector relative call comes down to inflation, and the index relative call comes down to the sector, we just have to get the inflation call correct and we should be in a good place. My students also build economic models to forecast growth and inflation. The most common variables that show up in the dozens of models I see for inflation are commodity prices, money supply growth, PPI, financial conditions and inflation expectations. I have created a CIX to forecast CPI very simply using these variables. It has been a good fit up until recently. Lately, it has started to pick back up at the same time we are seeing CPI trying to form a bottom. Is CPI about to turn higher, and bring the Fed back into play? Inflation expectations and financial conditions would certainly suggest this is the case. The CPI, with a higher weight from commodities than my index, would say no. How will this break?
If CPI does turn up, there is sector relative performance that is more than two standard deviation stretched. SPX vs. NDX is stretched. SPX 493 vs SPX 7 is also stretched. There might be a big catalyst for mean-reverting trade to be put on at some point in Q1. It may be too early to call this now, but it is something that is definitely on my radar.
All inspired by a trip to the Science Center.
Stay Vigilant

Hi Richard. I've only recently stumbled upon your substack and am greatly enjoying it. This particular entry piqued my interest. I was wondering if you've gone into more detail about how you create your
CIX index(or other indexes to forecast growth/inflation/liquidity) in other submissions. Or whether you might make any documentation on the subject matter available to those of us who'd like to audit your course from afar. Thanks for your work and consideration.
I'd appreciate a practitioner's perspective on the subject so whatever insights you're willing to offer for creating indices to forecast growth or inflation would be great. I'm particularly curious as to how you combine the different inputs? Do you calculate a z-score of each component so that they're scaled and easily combined?