AI, AI, AI, AI, AI
You can't get away from the stories about it. That's why I had to ask AI if it thinks it is going to change the world
In a very timely sense, the discussion last week with Konstantin Fominykh from Tenviz was the perfect entre to the week. After all, this week was much more about A.I. than it was about the debt ceiling really. While there were some early week wobbles because it looked like a deal might not get done, this all went away with Nvidia earnings on Wednesday night. By all accounts, these earnings and the message from management were one of the best in recent memory leaving everyone aghast that a stock with amazingly high expectations could still manage to surpass those expectations.
Thursday then became all about short-covering or FOMO or simply getting long. It has become too hard to be a doubter on NVDA and AI overall. Marvell and Palantir earnings also corroborate the AI story. Traders and investors responding sending NVDA up 25%, adding over $200bb in market cap to the name. You can see the jump in the chart below. About the only negative one could say is that it is overbought but this has essentially been the case all of 2023.
The move in NVDA caused a big jump in the Nasdaq as well. This index is at a bit more of an interesting juncture. The index is also quite overbought and does not typically stay this way for long. However, we can see from the two other times in the past year it has gotten this overbought, it was not time to sell until the MACD crossed lower. We are not there yet.
2023 is a very unique year. If you don’t own the 7 top performers, something that BAML dubs the “Magnificient Seven”, you have not participated in the rally. These top 7 stocks are up 70% on an equal weighted basis. The other 493 stocks in the market are flat. There are more stocks that are down than up this year. Thus, in spite of the great headline index numbers, many investors may not be participating in this rally even if they are invested in this market.
Source: Michael Hartnett, BAML
In fact, looking at some of the internals of the market, growth is outperforming value by over 10% this year. The equal weighted SPX (ticker RSP) is lagging the market cap weighted SPX by 10%. Small caps are lagging large caps by 8%. This tells me that in spite of the rally, there are many that are not enjoying this market.
Perhaps the most shocking number to me is SPY vs. the DVY or Dividend Leaders etf. In a year in which rates have gone higher, and now credit is expected to get much tighter, the companies paying dividends at an increasing rate are down 9% this year while the market is up 9%. This is quite the opposite of what I would expect. Clearly, AI is putting me out of a job.
The Wall Street Journal spoke about this over the weekend in an article called “The Revenge of the Quants” (hat tip TB). It had several people quoted and discussed that quantitative or systematic strategies were the ones buying the market as retail and discretionary investors are sitting it out if not selling into the rally and raising cash
This is corroborated by BAML in the flows it is seeing across its clients
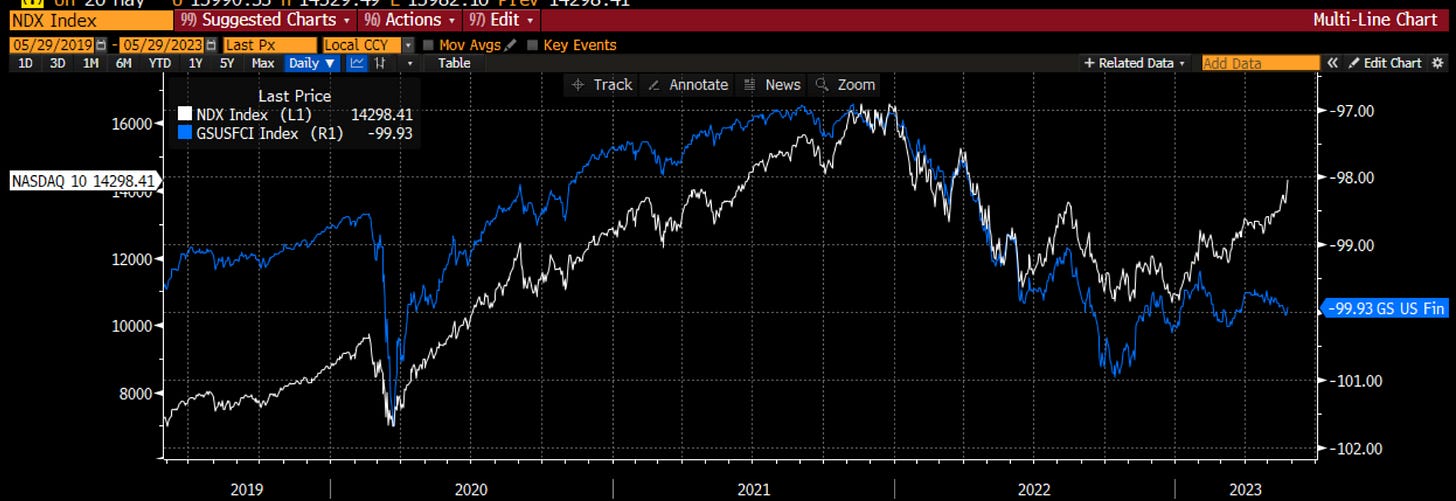
While many of us are left scratching our heads as how long duration assets can go higher with liquidity slipping, the quants are rules-based traders and it is based on the price action it sees. This is really the only way I can explain this chart. Financial conditions, which had gotten easier from October to February, have started to tighten again. This is not a good sign for NDX . This is just the last 4 years, but this relationship has held all century long.
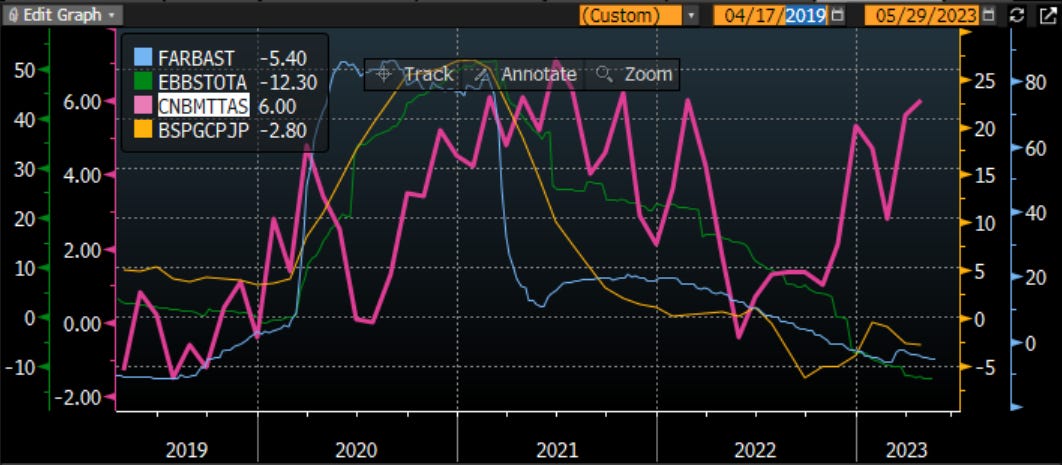
Do we think financial conditions will continue to tighten? What are the major central banks doing? China is still growing it’s balance sheet, perhaps suggesting the economy there is in worse shape than we thought, while the other Big 3 central banks are all shrinking the balance sheets.
Not only that, but rate cuts are being pushed out of 2023 and there is now better than a coin flip that we will get another hike in June. Remember when the Peak Fed was the reason to buy stocks?
Has the Fed lost its mind? CPI has been coming lower. There are many that will tell us that with debt, demographics and disruption (think AI), we should be more worried about deflation that inflation. Housing is meant to be a drag on CPI too. In fact, if we look at the Case-Shiller house price index and the Zillow rent index, we should expect OER to come lower this year too, another thing driving inflation lower.
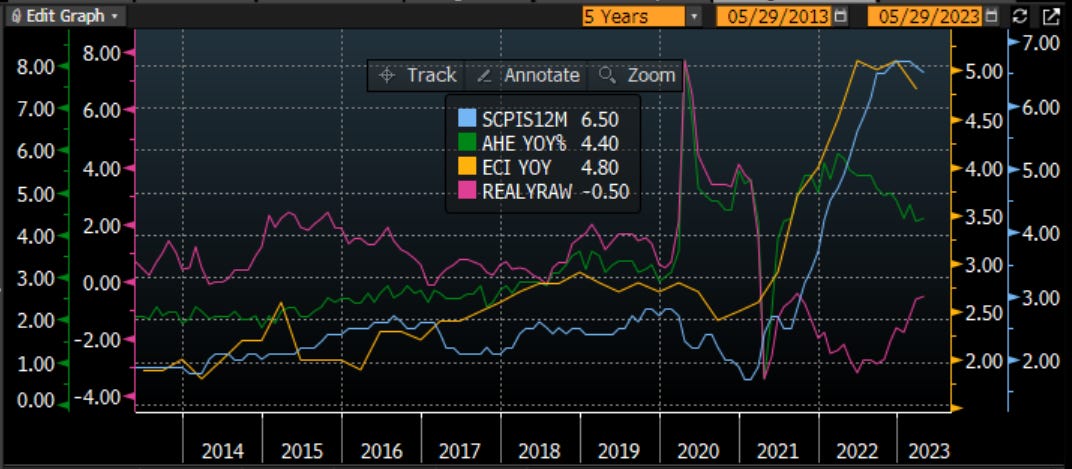
However, Jay Powell has told us repeatedly to watch core, ex-housing services inflation. This is what he is watching right or wrong. I have said many times, inflation is a mind set and not a number. 100% inflation one year and 0% the next still means it costs you double to do everything. This is clearly what people see and why we see union after union able to extract very healthy pay rises in the negotiations. You know that every other union coming up for negotiation will do exactly the same thing. We can see this in the average hourly earnings and employment cost index moves higher, which has brought the Atlanta sticky inflation up too. The real wage index is still negative this year, meaning wages have still not caught up with inflation.
These wage indexes only capture the bottom 85% of workers too. The high end is not captured in this data because bonuses and options paid to investment bankers and high tech workers , which forms the bulk of compensation, is not here. This is the group that is really getting hit right now too. Why? Because they cost too much and these firms are getting squeezed on margins in spite of higher nominal revenue growth.
If we look at the sticky inflation and compare to real yields, we can see that real yields need to go higher. At about 1.5% now, real yields may not get to the 6.6% sticky inflation is, but given these two don’t usually get more than 2% apart, one might think they are going higher.
Back to BAML, as they show than it took 4% real yields to pop the dotcom bubble and 3% real yields to pop the subprime bubble. What will it take this time?
Why does this matter? We can see the relationship between real yields and forward P/E (inverted here). As real yields go higher, forward P/E should go lower. Said another way, as the cost of capital is marched higher, the price investors will pay for a stock should go lower.
This probably matters more for NDX. Yes, I fully get the AI story of transformation and growth. I also know only a few stocks, and only a few people, will benefit from this. If we look at the forward P/E of NDX, SPX and RTY, we can see that it is the NDX that stands out relative to the others. It isn’t as if the SPX is cheap, but the NDX looks far more expensive. It can get more so though too. If I looked at this back to the late 90s, we clearly saw a disconnect. I understand what can happen. I am just saying that the NDX looks most vulnerable should real yields continue to go higher.
Now, let’s look ahead to this week to see if there are any catalysts out there. On Thursday, we get the latest reading of ISM. The SPX returns have disconnected from ISM this year, marching higher as ISM went lower. Over the past week we got a number of regional Fed surveys as well as the S&P PMI. These have some relationship with ISM. The regional Fed surveys collectively are still bouncing along the bottom. The S&P PMI fell this month after being up last month. Thus it is bouncing too. It will be very interesting to see the reaction to the numbers. A lower ISM should be negative for growth, but probably gets Fed rate hikes priced out. Not that these June hikes slowed stocks. A bounce in ISM and one should expect another hike to be fully priced in. Will stocks care or will stocks focus on the soft-landing narrative? I would guess the latter.
ISM and the Leading Economic Indicators give us a clue not only about the relative performance of stocks vs. bonds, but also the direction of GDP and employment which are both lagging indicators.
I have talked about H.O.P.E before. We have seen a bounce in the NAHB realtor index giving some optimism that housing has bottomed which will lead new orders, profits and employment. However, the bounce is more a function of low inventories. Anecdotal evidence across a number of areas suggests people with 3-4% mortgages are not moving nor looking to move. This means no one is trading up and boomers have to hit a lower bid to sell their house and move south. Some of this is still happening, but sales of existing homes are at levels not seen since the Great Financial Crisis, telling me that this realtor survey is a bit more hot air than reality.
Does housing lead the economy? Don’t ask me, ask AI:
AI is clearly the future. However, there are also some core tenets about the economy that need to be remembered. The economy leads earnings and earnings drive stocks. This is probably why there are more stocks that are down than up this year.
Stay Vigilant


