


Capitulation
Noun: the action of surrendering or ceasing to resist an opponent or demand.


Anyone who has worked in financial markets for any period of time will know there are periods in the course of the year where we all have had to capitulate. We either are self-aware and know we can’t take the pain anymore, so we close down risk. Or we get the proverbial ‘tap on the shoulder’ from the risk manager telling us to close down risk. You don’t want to get to the latter time, because it doesn’t take too many ‘taps’ before you are asked to leave. The former is usually the result of experience, with experience being another name for getting yelled at by investors a lot.
Capitulation can happen on upside or the downside. One can capitulate out of shorts or underweights just as much as one can capitulate out of longs. If we look at the price action in the Nasdaq Composite this month, it feels like a broad sense of capitulation across the board. Every sector in the index is positive and we are being led by banks and other financials on this latest move higher.

We also see this in the master options flow model put out by Macro Charts which I got via Top Down Charts. This shows us that traders are going all-in chasing this rally buying calls. We can see the past times that this model has hit the “Euphoria” level have not been the most opportune times to add risk yourself.

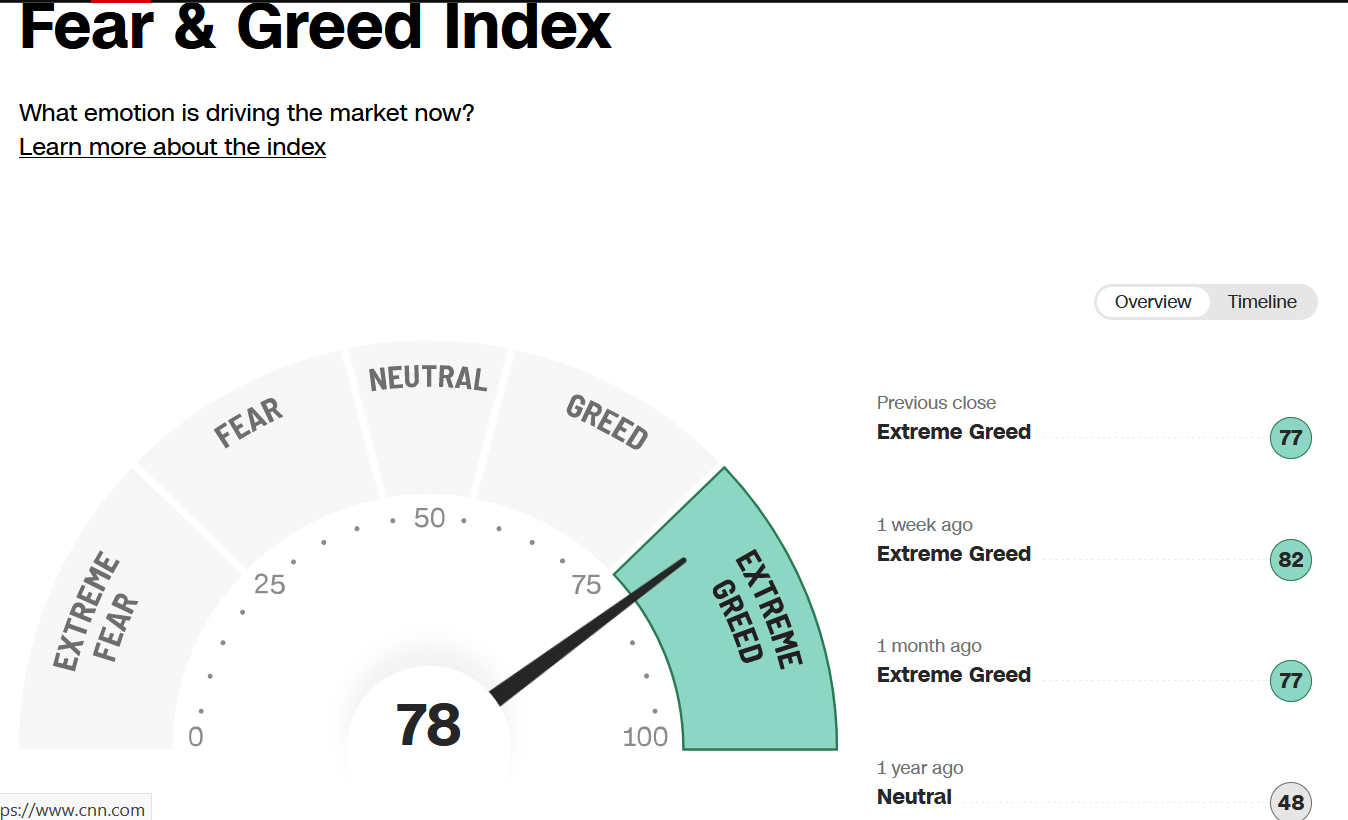
This is clear in the aggregate sentiment index - the Fear & Greed Index - published by CNN. I have shown this before and this index is still solidly in extreme greed. If I go through the subcomponents, this is where we are currently ranked:
Market momentum - Extreme greed
Stock price strength - Extreme greed
Put & Call options - Extreme greed
Market Volatility - neutral
Safe haven demand - greed
Junk bond demand - greed
Perhaps it has cooled off a touch from last week, but it is still at uncomfortable levels.
Speaking of put & call demand, I have shown you before the 10 day moving average of the put/call ratio. It is my favorite market timing indicator. It has turned up again (shown as down here because I invert it when comparing to the stock market). Yes, this happened at the end of June and we did not get much of a pullback. However, the move in the ratio is sharer than before. it is giving me a yellow warning signal.

However, I totally get why people are saying ‘no mas’ and buying the market. After all, we got another hike this week to 5.25-5.50% range (hey FOMC, just use a single number) and we can see from the short-term interest rate market that there are basically no more rate hikes priced in. In fact, there are cuts priced in again if we look into 2024. The market is clearly at Peak Fed, and while one could argue that either bulls or bears could hear what they wanted in the FOMC press conference, a dovish hike appears to be the most common interpretation. This is an all-clear for risk-taking.

Also, the economic data has continued to surprise on the upside in terms of being better than expected. This means growth is holding up better than thought and inflation is coming in lower than thought. It will be a big, big week this week with ISM, jobs data and the Senior Loan Officer Survey. However, it is obvious that the economic surprise index put out by Citi is moving higher. This index has historically plotted well not vs. the SPX itself, but in the distance the SPX is from the 200 day moving average i.e. how far from trend, above or below the market is. This makes sense since the economic surprise data basically gives us the same information i.e. where is the data relative to expectations and not in absolute terms. We can see, though, that while the economic data in blue is better than expected, the distance above the 200 day moving average far exceeds that. Yes, the data has been better; however, the stock market has more than anticipated this. It can, at times, dislocate like now. However, it always gets back in line at some point.

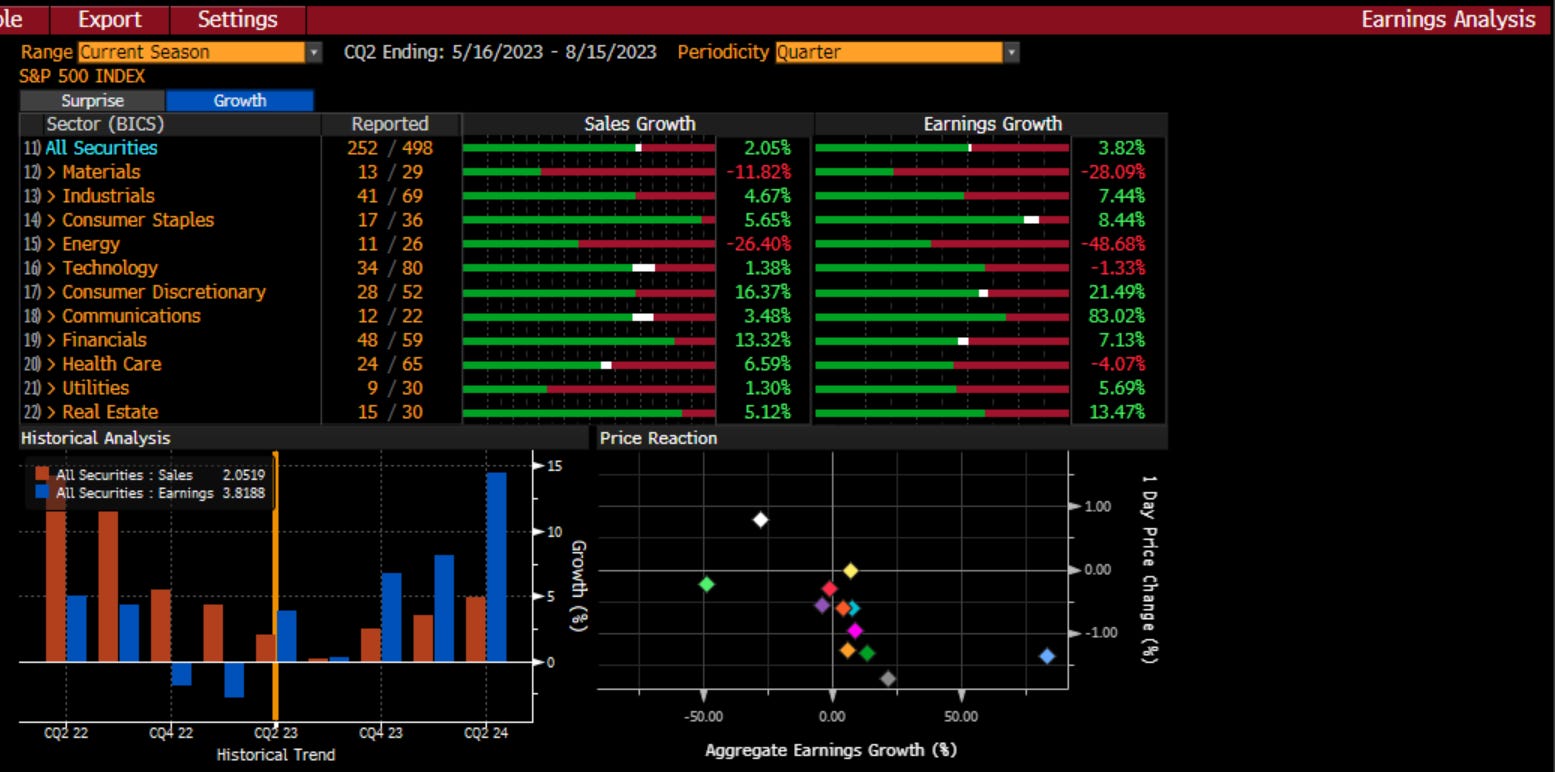
It is not just the economic data that has been better than expected. Once again, the earnings news has also been better than expected. We can see that so far, with about half of the market reporting, we are getting positive surprises on both sales and earnings, with the earnings surprises across every sector. The next two weeks are also extremely busy for earnings, where we will essentially get the second half of the index. At this time, the news has largely been quite good.

It isn’t just on the surprise front. On the growth front, news is also positive in aggregate on a quarter over quarter basis. This absolute news has not been as widespread, as energy, materials and health care are all down qoq. They are lapping some tougher comps however. The one commonality in the chart above and the chart below is in the lower right corner. Even with good news, the one day price change has tended to be negative. This suggests the stocks are moving in anticipation of this news, and then sell-off on the news itself. All of that said, stocks are still higher after the earnings than before in aggregate.
I have copied here the earnings summary from Jonathan Golub at Credit Suisse. It is an excellent summary and Jonathan has had one of the best calls on the market this year, having been one of the more bullish strategists at the start of the year. He is still bullish.
“Below is our 2Q23 earnings season summary. Select link for detailed report.
Projected 2Q EPS growth for the S&P 500 is skewed to the downside by 3 sectors: Energy (-48%), Materials (-29%) and Health Care (-16%). While a decline in commodity prices is driving the EPS contraction in the former 2 groups, the latter is the result of difficult Covid-related comps. These poor expected results are concentrated in Pharma, Biotech and Life Sciences (-25%), while the rest of the sector is expected to grow 1%.
53.9% of the S&P 500's market cap has reported. 2Q expectations are for revenues and EPS decline of -0.5% and -5.6%. EPS is expected to grow +7.9% and +9.2% in Financials and TECH+, but fall -16.2% and -8.6% in Cyclicals and Non-Cyclicals.
Earnings are beating estimates by 6.3%, with 74% of companies topping projections. EPS is on pace for -2.7%, assuming the current beat rate of 6.3% for the rest of this season.
Value is delivering stronger revenue and EPS growth (+1.3% and 2.1%) than Growth (-3.6% and -11.5%). Value results are beating expectations by +7.9% vs. +4.0% for Growth.
While the U.S. is projected to deliver higher revenue growth vs. EAFE (-0.5% vs. -1.2%), EAFE is forecasted to outpace U.S. on EPS growth (+4.9% and -5.6%). However, U.S. results are topping consensus by 6.3% vs. 3.3% for EAFE.
More globally-oriented S&P 500 companies are experiencing a greater decline in EPS growth than their more domestically-oriented peers: -8.1% vs. -5.1%.
Companies beating on both revenues and EPS are outperforming the market by +0.5% vs. an average of +1.7%, while ones missing on both are underperforming by -1.5% vs. -3.1%.
Next week, 166 companies representing 28.7% of S&P 500’s market cap will report results, including Apple, Amazon, Berkshire Hathaway, Merck, Pfizer, AMD and QUALCOMM. Today, 11 companies report results, including Exxon Mobil, Procter & Gamble, Aon, Colgate-Palmolive, and Charter Communications”

My thoughts - revenue is positive because nominal growth is still positive. Margins are coming in negative as costs structures are getting more challenged. We see this with all of the wage negotiations. However, we throw in some buybacks and still get to positive eps growth on a yoy basis. I was surprised to see margins hold up as well as they did for financials. This companies have been the fastest to cut staff which may be why margins are holding up. However, I thought there might have been more pain. Margins are also not that bad in tech which is also cutting. The biggest hit to margins is from the commodity-focused industries. Looking below, the biggest surprises are in the sectors that have been the best performers this year. Perhaps investors are not so dumb after all.

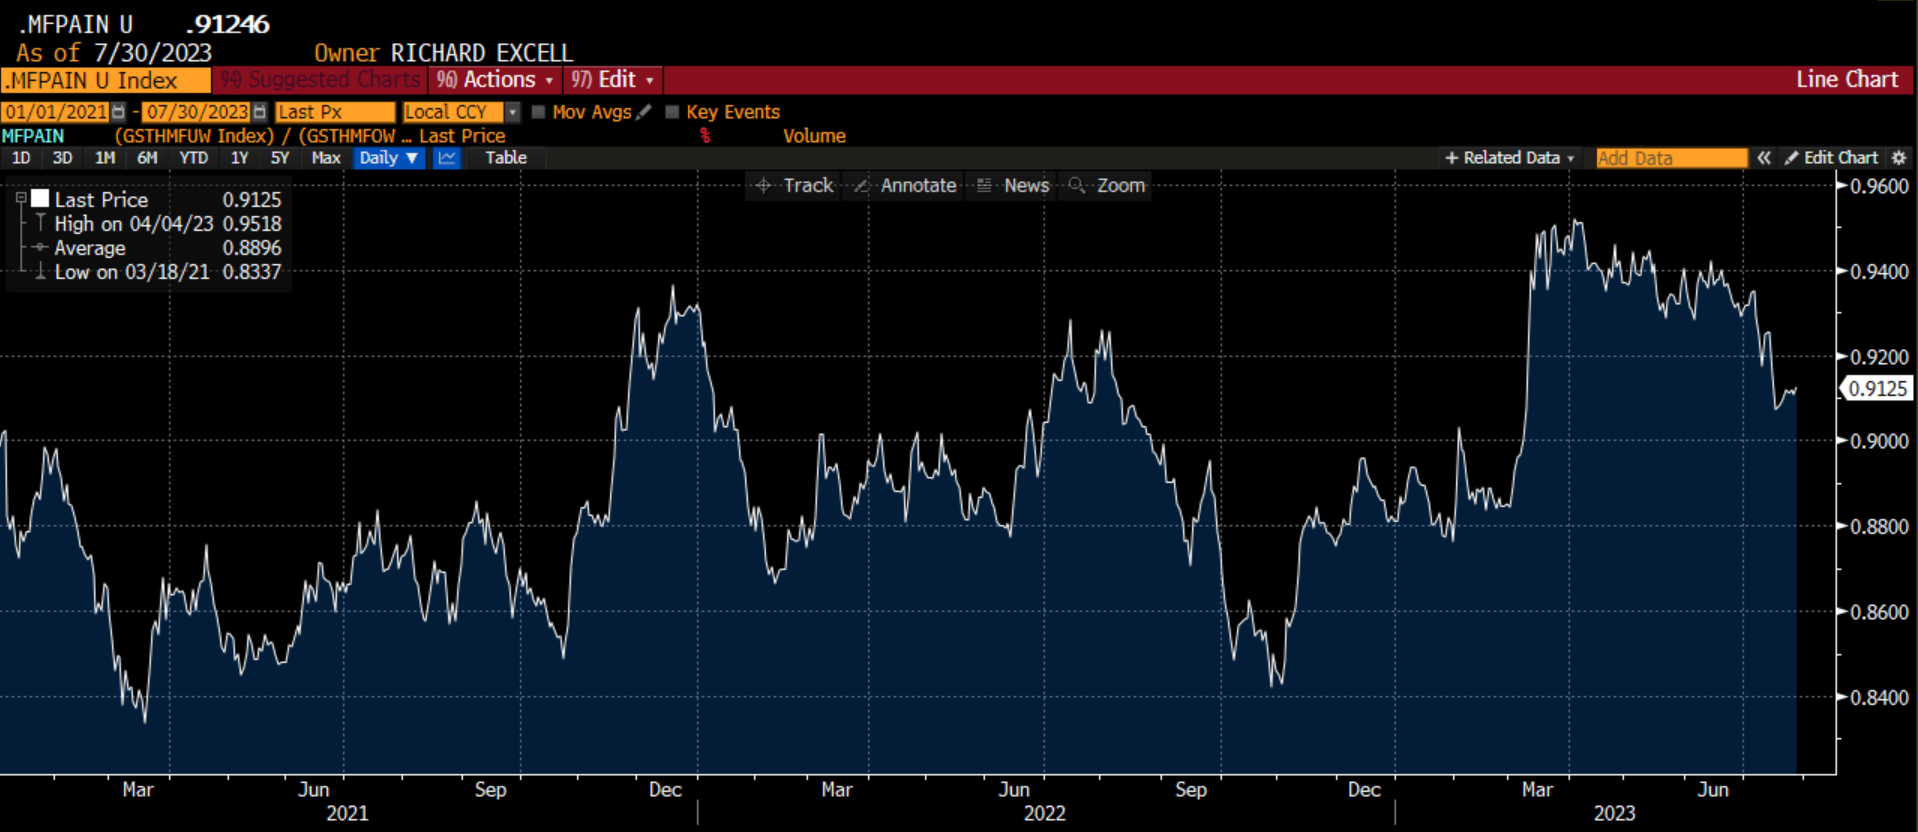
Another way we can see the capitulation that has happened is by looking at a few different charts showing performance given positioning. The first I call mutual fund pain and it compares the performance of the largest mutual fund underweight stocks vs. the performance of the mutual fund overweight stocks. Both of these measure are kept by Goldman Sachs. We can see in March we hit maximum mutual fund pain, presumably as their overweights materially lagged the underweights. This might have been a long financials vs. short tech type of bet. However, we can see since that time, mutual funds have started to see some improved performance. They are still struggling a bit overall, but the pain threshold has lessened. Putting cash to work as well as seeing financials have a very strong month this month has certainly helped the long only crowd.
We can also see this for hedge funds if we look at the most short stock index vs. the broader market. I have shown this before and we still see shorts outperforming the broader market suggesting there is de-risking still involved. Covering shorts and letting the longs run, increasing your net exposure, is a classic tactic by hedge funds that can’t take the pain anymore.

We can see why the pain is happening. I have discussed this on LinkedIn before, but this is the performance of the Zombie companies. These companies are those for whom their earnings before interest and taxes (EBIT) is less than their interest expense. They are the walking dead because they can’t make enough money to cover their debt costs. In a time with rising debt costs, one would think the businesses and stocks are struggling. If one were a hedge fund, one would want to be short these companies as they are the weakest in the market. Within the Russell 3000 total market, this comprises 10% of the overall market. Within the Russell 2000 small cap subcomponent, it is 15%. This means almost all of the Zombies in the market are small caps. We can see that these Zombies are up over 29% this year, about 20% more than the index itself. That spells a lot of hedge fund pain. It is about 4% of the Russell 1000 larger cap and these names are also doing well (e.g. Coinbase, Roku, Spotify, Doordash). When the weakest companies are outperforming, it tells me that shorts are capitulating. One might argue that junk companies always lead the rally off the lows. However, this happens when the cost of capital is coming LOWER not moving higher. Yes, we are at Peak Fed, but the cost of capital has not changed for these stocks. This move is all about risk reduction and not improving fundamentals.

I have used lots of different valuations to show you how extended the market has gotten. The one today comes from Top Down charts where they use a composite of trailing earnings, forward earnings and cyclically adjusted (CAPE) earnings. This aggregate measure is over 1 standard deviation expensive. There is very little margin of safety in the market. Yet, if we look through time, we can see that stocks can still get more expensive.

Another measure Top Down used was the forward earnings yield vs. the 10 year Treasury yield. I have used variations of this as well this year. Once again, we see almost no margin of safety.

If I compare the forward earnings yield to the Moody’s Baa corporate bond yield, we get a better comparison on a like for like risk basis vs. comparing to the risk-free rate. I call this ERP for equity risk premium. We can see that stocks are in the expensive zone, with earnings yields lower than the corporate bond yields. This can get more extreme, but it is another sign that there is no margin of safety in the broader stock market.

However, most will keep coming back to the strength of the tape. Don’t Fight the Fed and Don’t Fight the Tape are the two long-run mantras. With the Fed presumably finished, one is no longer fighting the Fed by going long. Looking at the daily charts, if you are not long, you are fighting the tape. The trend is still moving higher. If we look at a measured move from the break above the 420 level and compared to the rising trend line, we would get to a target of 495 in SPY. Yes, we are a little overbought on the RSI right now, but this is what investors see and want to go with the trend.

The weekly chart is not showing this strong trend yet. Yes, we have broken above the cloud, but we are also overbought on the weekly chart.

In sum, I get the sense that the wall of worry is not only being climbed, it is going away. Investors are giving up on hopes of a weaker economy. Investors are giving up on the fears of an earnings slowdown. Investors are putting cash to work and buying upside options.
That said, there are many measures, from valuations, to put-call ratios, to RSI’s to sentiment measures that suggest this has gone too far, at least for now. I think that message will fall on deaf ears for most, because most are probably not up as much in their investment account as the SPX is much less the NDX. This is why we are seeing the capitulation and exactly the wrong time.
We get more economic and earnings data this week. Will it change any minds? Will investors take some chips off the table? I am not counting on it thought I acknowledge there is no margin of safety.
I wrote about this on LinkedIn this Friday when looking at the factor performance this year:
Chart of the Day - corn tortillas
My wife & I were out for dinner last night & we chose to get some Mexican food as it has been a while. I looked forward to a plate of tacos. When the dinner arrived, I hope the disappointment on my face was not apparent to the server
You see, they made the tacos out of corn tortillas. I really don't like corn tortillas. I like flour tortillas. I know corn tortillas are slightly healthier for you. I also know that the distinction is usually one of where the chef is from, with corn more popular in Southern Mexico and flour preferred up North
However, corn tortillas fall apart more easily making the dinner just a bit messier. They also have a more savory flavor vs. flour that I don't think goes well with the rest of the meal. You can't convince me, flour is better than corn
The stock market is equally as stubborn as I am on this topic. The chart today shows you the factors, on a sector neutralized basis, that are working best this year
You can see that the only factors that are positive are growth, liquidity and size. Investors went mega cap, highly liquid growth stocks. They want the Magnificent 7
Growth is always preferred when economic growth is declining. When growth is harder to come by for all, investors want the companies that have proven thru time that they can grow consistently
However, there are other factors, that are perhaps healthier for you, that are being left behind. Factors such as share buybacks, value, ESG, dividends, momentum, quality and low volatility. All of these factors are negative on the year
These factors are often the core of many diets err I mean portfolios. High quality, low volatility companies that are returning cash to shareholders in some way you might think would be the rage with some uncertainty on the horizon
This suggests to me that perhaps investors do NOT feel that uncertain about the future. They seem now collectively convinced of the soft landing if not no landing thesis. Sure, growth is slowing, but the sense is it won't go negative an jobs will stay strong
They also are convinced inflation is falling. I can tell because value vs. growth on a sector neutral basis tracks very well vs. inflation. Value stocks do better on a relative basis as inflation rises, but suffer on a relative basis when inflation is expected to fall. Almost 17% relative performance tells me inflation expected to fall
These healthier factors are the corn tortillas of the market right now. They are better for you. However, they can be messier and some people think they just don't taste very good. Bring up buybacks or ESG in the wrong crowd & you are in for a long conversation
Right now, much like I was at dinner, investors are saying they prefer and will only eat flour tortillas. Mega cap growth stocks are all people want

Let me know if you like flour or corn tortillas…
Stay Vigilant

Thanks for the post, Rich. I'm curious how you're thinking about adding convexity to your portfolio during this time. As you pointed out, the put/call appears very low and I believe Francois Trahan recently posted that the relative cost of a 95% 1 year SPX put is the lowest its been in 15 years. Do you think the capitulation just has too much room to run to where the timing is suboptimal and you'd prefer to cash in on 5% money markets?
Additionally, I think you've alluded to most active managers underperforming the index so far this year (your custom index on MF pain has gotten better but it's still not good) - which has lent itself to capitulation. Do you think there's an opportunity to capitalize on active managers effectively swinging for the fences in the back half of '23 as they try to catch the index? Or do you think active managers are just going to hug their benchmarks to avoid underperforming even more?
Great analysis! I always appreciate your insights, thanks for sharing them.