


Chillin' like a villain
The official end to summer in the US is here. What's on your radar? This is what's on mine


My wife and I enjoyed some pool-side hot weather and cold drinks today as we celebrate the end of summer. Truth be told, Fall is really my favorite season as I enjoy the warm days with cool evenings, the colors on the golf course in the afternoon, and the weekends full of American football. Thankfully, I can celebrate this weekend as my Illini won a hard-fought battle. I have been known to have my moods dictated by football, as irrational as that is.
There are probably quite a few moods that are on either side of the fence this week. Some may be because of the outcome of football games. Most others are because we went through a week of weaker than expected data, giving the bears something to chew on, but more positive than expected price action, giving the bulls some fodder as well.
For me, August is really a lot of kabuki theater as trading desks are not fully staffed and most are on some sort of vacation. As we get back from Labor Day, people start to play their cards a little bit more, having tried to pass and hold for the past month.
I want to quickly go through the important categories to get our minds out of the pool-side drinks and into the trading in the weeks ahead. Buckle up!
Economic Trend
As I mentioned, there has been quite a bit of economic data in the last two weeks. For me, it all hinges really on one data points - the ISM. This measure is the best economic measure that is timely, coincident with the market (and not lagging), and not subject to revision. Few other data points can fit that bill.
The falls in ISM for the past year, even from extremely high levels above 60, approached the 45 level that has indicated recessions in the past. However, it has fallen short of that and last month was a little bit higher, given hope to the soft landing crowd. This month would be important because 1 point doesn’t make a line but if this print was also higher, there is even more justification for the soft-landing crowd.
They were not disappointed. The print came in at 47.6, above 46.4 last month and the expectation at 47. Yes, we are below the 50 level of expansion/contraction but above the 45 level of recession. Importantly, the internals of the measure - the new orders to inventories ratio - also continued to rise, suggesting that we may very well have seen the lows for now. This came out on Friday, and admittedly many had probably left, at least mentally, on vacation. I imagine it is digested more in the week to come.

Reminding you of why I think the ISM is so important I want to show you again a chart I have shown many times. It comes from Jonathan Golub at the investment bank formerly known as Credit Suisse. There are two takeaways here. The first is that there is only one period when equity returns are negative and that is when the ISM is below 50 and falling. The second take away is that the BEST returns are when the ISM is below 50 and rising. Thus, being in this area below 50, it is EXTREMELY important to know if we are rising or falling. Have we established now that we are below 50 and rising? This is what portfolio managers will ask themselves on Tuesday morning.

The second take away is that the ISM also correlates well with 10 year Treasury yields. Has the recent move in the bond market been signaling to everyone that the economy is set to strengthen?

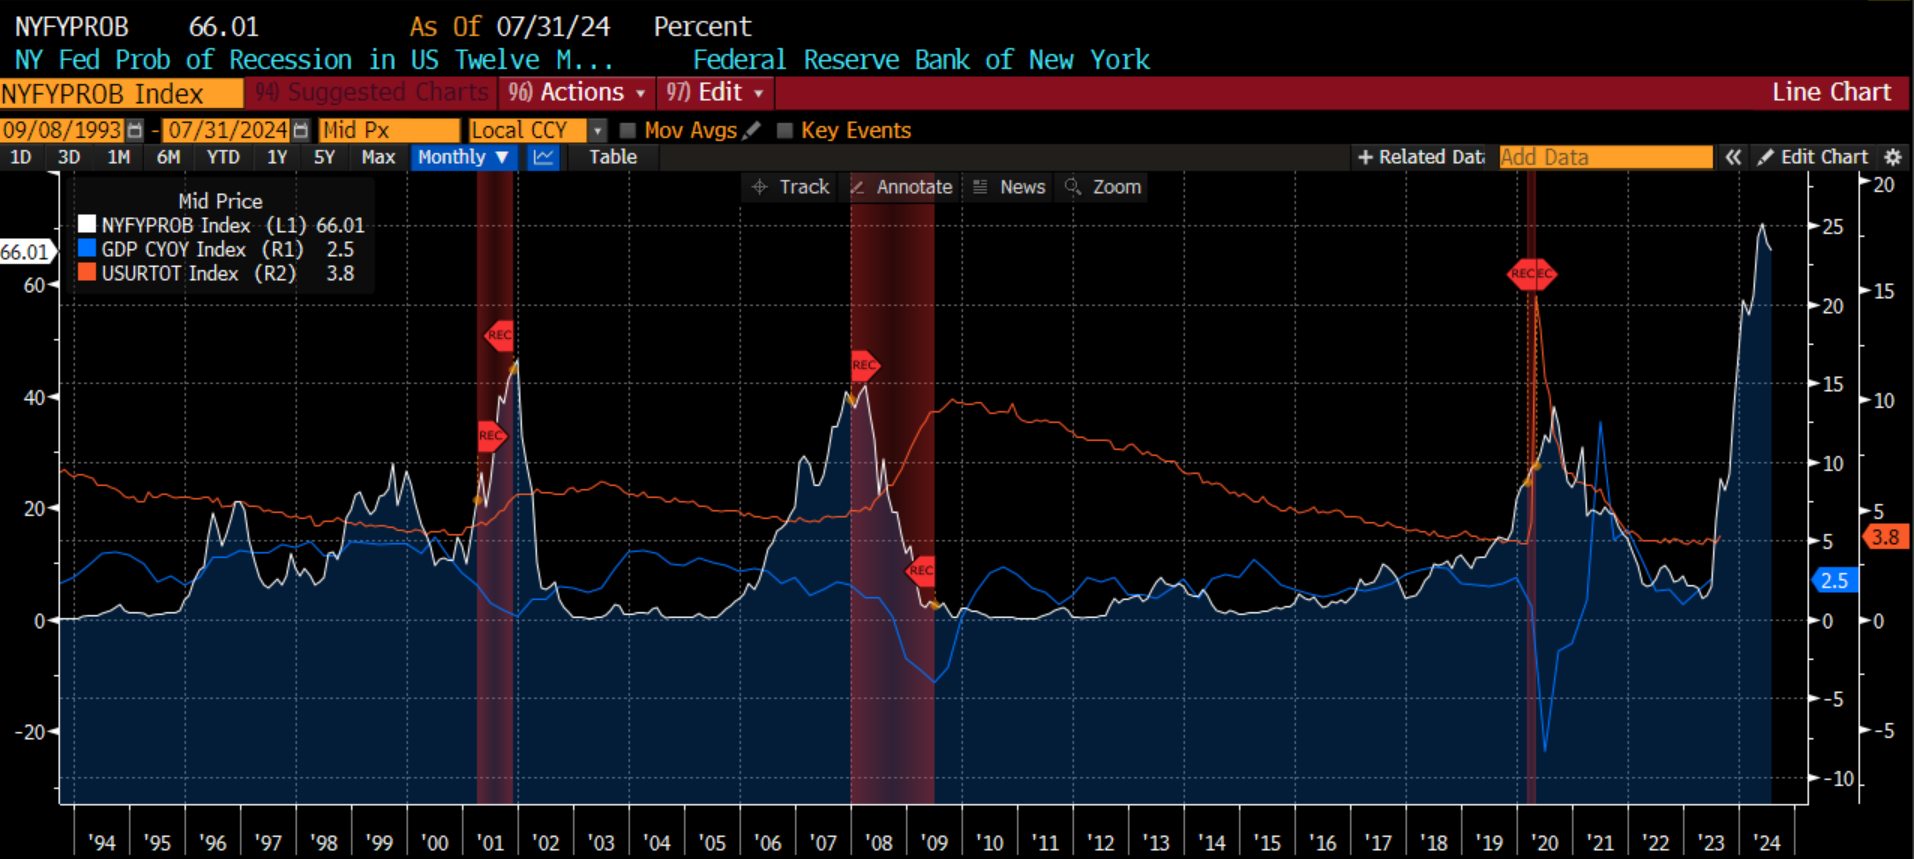
If you are bearish, there are still some things on your side. The NY Fed probability of recession is still at the highest reading in the past 30 years. This is driven primarily by the steeply inverted yield curve. However, it is indicating that while we might be in for a bounce in the economy, there could still be struggles ahead as we look into next year. I overlay this measure with GDP and unemployment, both of which are lagging indicators, but both of which show you that spikes in the NY Fed measure have lead to sharp declines in GDP (blue), sharp increases in unemployment (orange) and recessions (red). Perhaps the rest of this year looks better for the economy, but we may not be out of the woods yet.
What is holding up the economy so that it has performed much better than the consensus of economists (and me as well) has thought? Perhaps it is the impact we are seeing from Washington D.C. I wrote about this on Linked In this week:
Chart of the Day - D.C. impact
We have gotten a lot of economic data over the last 2 weeks. Today we will get the Grandaddy of them all. No not unemployment which everyone will focus on. That is horribly lagging (with multiple revisions). I mean the ISM
Yesterday I mentioned that the economic data matters for the Fed because the bad news means Peak Fed so risk assets like it. Given the expansion in multiples already seen, not sure Peak Fed has a lot more juice
Bad news also means a slower economy which means slower earnings. The mkts are pricing in a rise of earnings from here which seems a bit optimistic to me
But Peak Fed not only means no more hikes. For many it means rate cuts next year. There are even Fed dot plots that see rates lower next year. However, Jay Powell has taken pains to tell us (or maybe his committee members) otherwise
I agree with Jay on this one. You see, while the Fed has raised rates historically & we should be seeing this impact, we are still getting a pretty big tailwind from DC that are allowing growth to hold in better than almost all expected. This also means inflation may prove more stubborn
I created an index called DC Impact. It measures, in % of GDP, the size of the Fed balance sheet & the size of the deficit spending. I have left out the rates impact because that should be normal & cyclical. This is the extraordinary driver imho
Both fiscal spending & the extraordinary tools of the Fed (read balance sheet growth) are meant to be counter cyclical offsets to support the economy, unwound when no longer needed
The DC Impact was so cute back in the late 90s/early 00s. It was less than 10% of GDP and just bounced around. You see around 00 it moved to the high end during the recession. It is meant to be counter cyclical after all.
Same thing happened in 08 however it was a new paradigm. That number that used to go between 3-8% of GDP moved up to 25% of GDP at the recession. Counter cyclical. It had the desired effect (eventually). Yet it stayed at that level and never came lower
Politicians (and markets) became addicted to these measures & could not bring themselves to unwind them when times were good. What could go wrong anyway? Besides having your debt downgraded that is
They DEFINITELY shouldn't be growing when times are GOOD. We are debating soft landing vs. no landing now. Atlanta Fed says GDP is almost 6%. Unemployment still near all-time lows. Yet what is the DC Impact?
It is almost 39% of GDP still. It is down from over 50% sure. The Fed is modestly shrinking the b/s but that is more than offset by fiscal stimulus keeping this impact intact. And we wonder why the economy is better than we thought
Do we think more stimulus impact on top of the economy will bring inflation down? Given that, do we also still hold onto that notion that rates will be lower at some point? That may be wishful thinking

The economy might be going through the soft-landing many in the market think. There is certainly enough to suggest that. My hunch is portfolio managers coming back from vacations will need to consider this as they engage in the next week or two.
Technical Set-up
There are scores of charts I could go through on the technical side, but I wanted to choose a few that stand out to me as the most important right now. The first is one I don’t think we should lose sight of. It is a 40 year chart of the 10-year US Treasury yield. I have said many times, this is the single most important metric to watch because it is the price that underpins all other pricing. We know that yields have gone up a bit more than many expected in the past 2 months. However, not much is made of the notion that we have firmly broken out of a 40-year bear market in yields (bull market in bonds). I would wager that almost all of you reading this, and everyone I speak to in the markets, have traded their entire careers with bonds in a bull market, and yields eventually going lower. This impacts how one invests in all assets. This impacts the type of mortgage one takes out. This impacts everything. However, this has all changed imho. I am not suggesting we will go back to double digit yields soon, but I think we need to come to terms with the idea that bonds are no longer in a bull market and yields can stay high and possibly go higher.

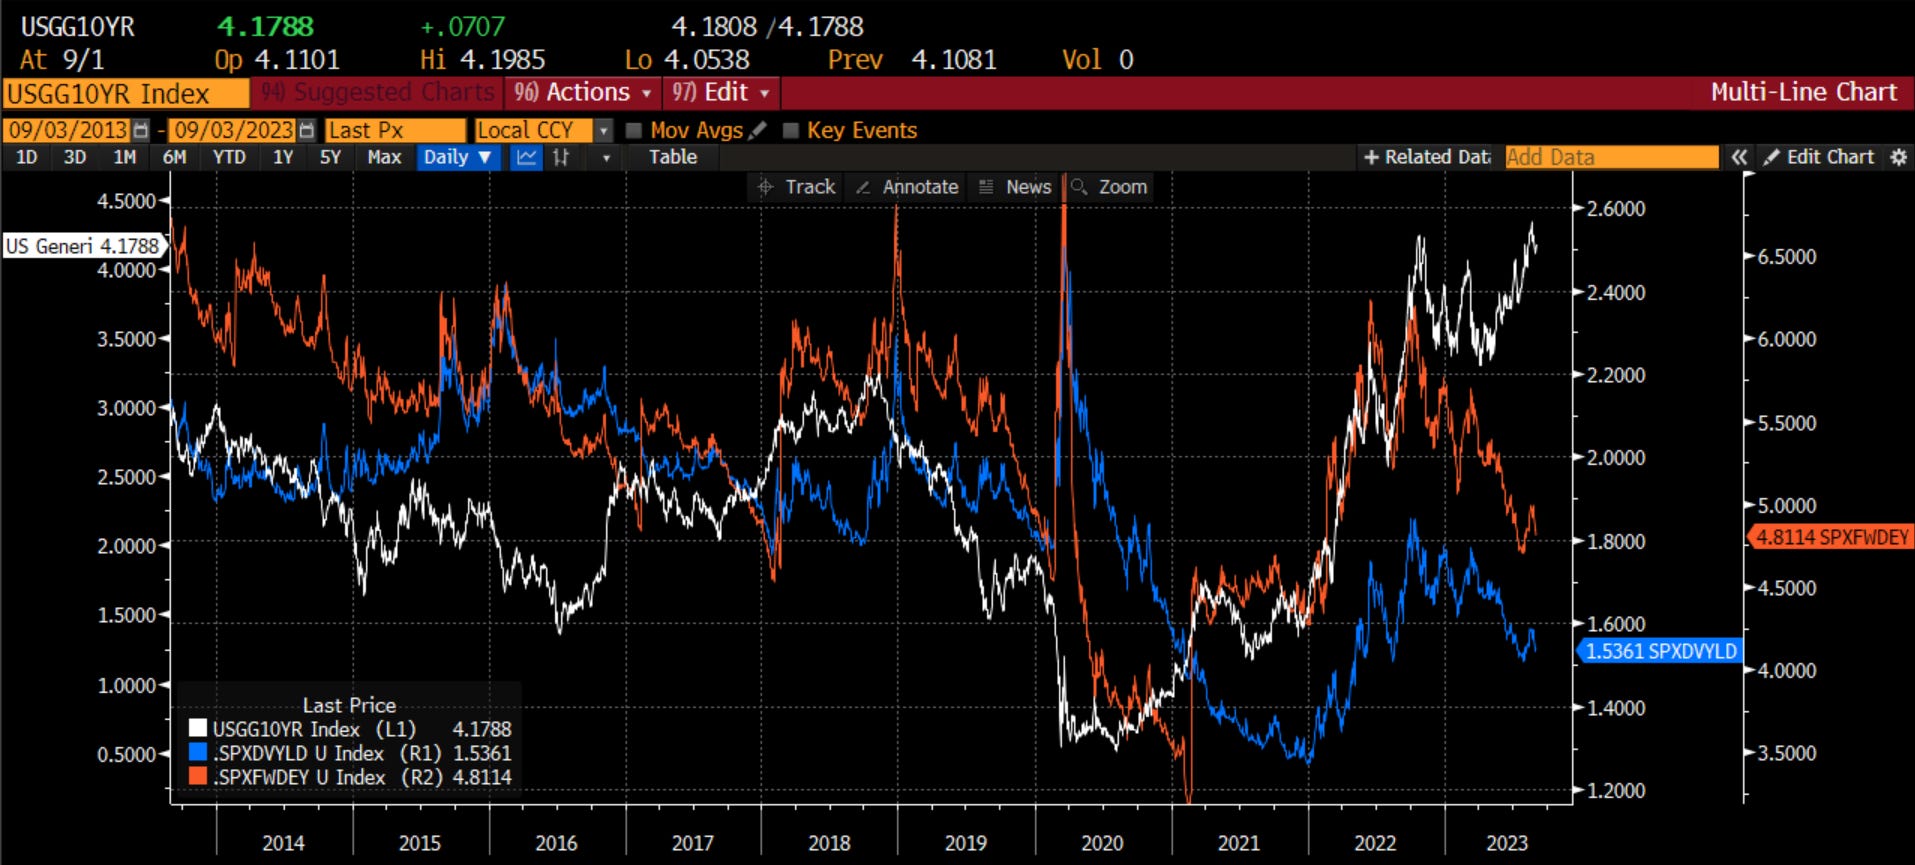
As I mentioned, this has valuation considerations for all asset classes, not the least of which is the equity market. Here, I put a shorter term time frame for the same 10-year Treasury yield and overlay the SPX forward earnings yield and the SPX dividend yield. Two different valuation measures we could use for the stock market. Both have de-coupled from the bond market. As yields have gone higher in bonds, both the forward earnings yield and the dividend yield have gone the other way. My sense is the coming 6-12 months will see these measures move back toward each other which suggests to me that the stock market deeply needs to see much better than expected earnings in the months to come.
However, while stocks may look relatively overvalued, there is no reason to think bonds will outperform stocks in the near-term. The best measure I can find to suggest what will lead to bond market outperformance is the jobless claims data. When it is trending lower, stocks do better. When it trends higher, bonds do better. It has been bouncing along at very low levels but has yet to turn higher permanently. This tells me that stocks will probably continue to outperform bonds for now.

Another thing to watch is the rotation within the stock market. The sectors that have been leading - Tech, Communications and Consumer, are falling into the weakening relative performance zone. Overweight and starting to struggle on a relative basis. The sectors that are improving are energy, financials, materials and industrials. This is consistent in my mind with the economy thought to improve and inflation staying higher than thought too. Will portfolio managers buy the laggards as they rush to catch up to the market?

On its own, the daily SPX chart is showing some near-term strength. The SPX index held support within the cloud and has broken back above the range. The zone is still moving higher. Moving averages are turning back up and crossing over in another bullish sign. Daily charts look healthy for traders.

So do the monthly charts. Here I look at a chart with the 1 year, 3 year and 5 year moving averages drawn in. You can see the 5 year moving average has supported all pullbacks since the GFC. We should typically not look to panic unless the 1 year moving average trades below the 5 year but it is actually doing the opposite now, and turning back higher. Another green light for risk.

There are holes one can find in risky markets, however, the near-term looks healthy. I think this would particularly be the case if we see money come back into the market and buy the laggards, adding more breadth to the rally we have seen this year.
Near-term Catalysts
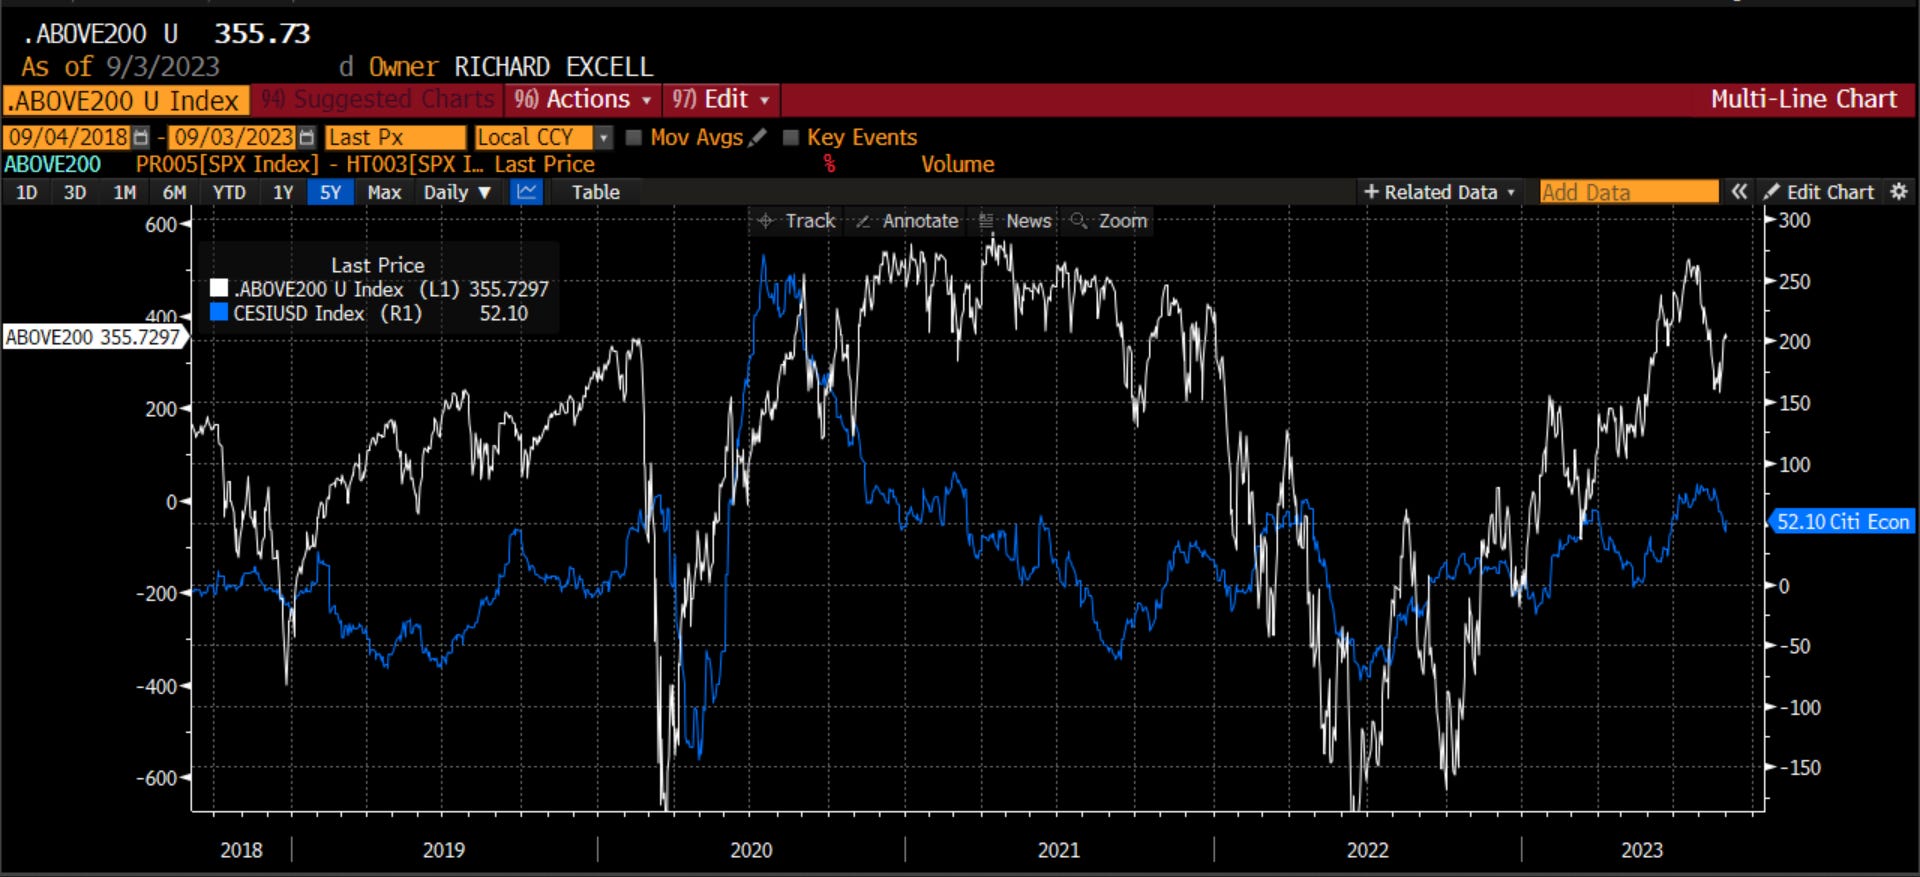
What will get anyone to change their minds? For one thing, it might be the economic data that is starting to disappoint and come in worse than expected. The Citi economic surprise index is a mean-reverting indicator, but it is starting to head lower. While this has not had a strong correlation with stocks directly, it does have a bit of a correlation with the distance the SPX is from its 200 day moving average or longer term trend. If the economic surprises keep heading lower, we could potentially see the SPX move back toward to 200 day, which itself is still rising.
September is also not a good month seasonally. In fact, over the last 20 years, it is the single worst month for stocks seasonally. While Q4 historically is quite strong, September is the opposite. Is this another risk to stocks if we do not get the post summer buying that we may expect?

Another risk factor not discussed is the potential supply of equities coming to the market. You can see the league table for equity offerings the past 10 years. The last 2 years have been nothing short of dreadful. This is why investment banks re laying people off, extending the start-date on offers, and calling people back to work 5 days a week, hoping many quit instead. There is no business to be had. However, with the stock market near all-time highs, and the VIX Index remarkably low, this could also be the ideal time to begin equity issuance. Whether it is private money that is looking for an exit, or companies looking to shore up a balance sheet, a September equity calendar of issuance before we get into the next earnings season would be met with happiness among bankers. However, it would also absorb a lot of the cash on the sidelines that could otherwise go into the market and begin to weigh on risk.

For now, the market is chillin’ like its the end of summer at the poolside. Sure, we know there are some risks out there the same way we know we have to go back to work on Tuesday. For now, we don’t want to think about those. We want to focus on the positives - the friends, the sun, the camaraderie, the ISM turning higher, the better technicals and the help we are getting from fiscal stimulus even though the economy is still strong.
There will be a time to worry about work, about valuation, about rotation, about issuance, and about seasonality. It just may not happen for now.
Stay Vigilant

Richard - So many great pointers in this post. This is why I read / listen to your stuff every weekend as soon as it comes out. I found the following particularly interesting...your commentary on the ISM index, market rotation and the DC impact index. Cheers and good luck with the first week of back to school!