Crossroads
Better economic data and better earnings have taken risky assets higher. Can it continue?
When we came back from the 4th of July holidays, I mentioned in “Fireworks” the next month or so would be critical for risky assets:
“We are in the midst of the summer reset for consumers, for markets, for policy makers. Growth and growth expectations might finally be slowing enough to start to bring down inflation. This will have an effect on bond yields and those things that are affected by bond yields - everything from mortgage rates to equity multiples. This will set us up for the 4th quarter move at some point. Before we get to that, we have a few more weeks in July, where bankers will try to get some deals done before family holidays happen in August around the world. Portfolio managers will react to the earnings news and try to get their positions where they want them before trying to go on those vacations. Congress will want to get something done before the summer recess. Finally, central bankers will be re-assessing what needs to be done, before possibly announcing a change of intentions (or not) at the Jackson Hole Summit of central bankers in August. The reset can be a time of continued risk or a time of opportunity if you can correctly anticipate. It is definitely a time when you want to be fully on top of the news and your portfolio.”
So, how has the news been? If we first look at the economic surprises, we can see that the economic data in the US has been coming in better than expected since the end of June. The measures of growth are not slowing as quickly as feared and inflation may have just started to peak.
The economy leads earnings and earnings lead stocks. The concern coming into this quarter was that earnings were going to slow and this would take stocks lower. If we look at the actual growth rates of sales, they were double digit positive and strong across the board. On the earnings front, the story was a bit more mixed, with extreme;y strong growth in energy, but negative growth in discretionary, communications and financials.
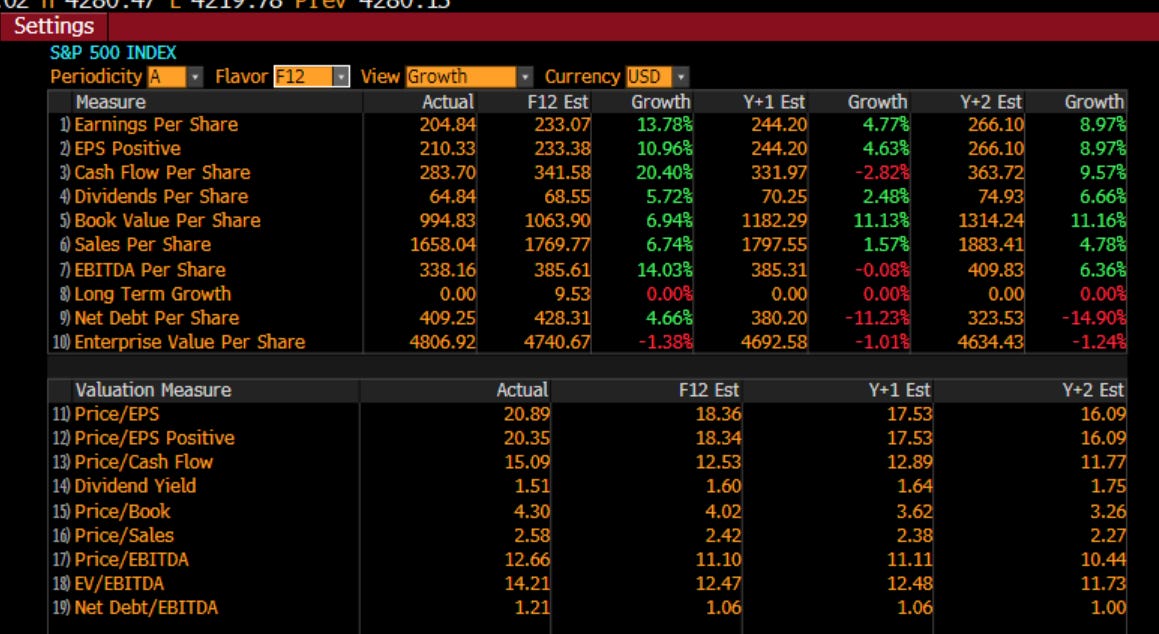
If we look now at how these came in versus expectations, we can see that again, earnings and sales were better than expected.
As a result, we can see that the expected growth going forward is till positive for the next two years. This has lent the bid to stocks for the past month. However, we can also see that we are getting back to the upper end of the range of forward multiples as well.
The bond market has also taken notice. The number of hikes priced in over the next year has gone up by 2 in the last two weeks.
If we look at the price action of the equity market, it is the most cyclical parts of the market that have responded to this news.
On a style/factor basis, the riskier parts of the market have been working better as we can see with high volatility stocks outperforming low volatility stocks. In contrast, the factors that are not working are those such as profitability and revisions. This is why you hear many people referring to the recent rally as a junk rally. The highest quality, lowest volatility stocks in the market are under performing while the lowest quality and highest volatility names do well. This is largely the opposite of what we have seen the rest of this year.
As I wrote on Linked In on Friday, this is having an effect on investors who allocation decisions use volatility as an input:
“Chart of the Day - forced in. Yesterday I was getting some DIY product at a big box retailer & the fire alarm went off. Those in the store were herded up & forced in to the line leaving the store. While we didn't want to leave (without checking out), we understood the program, & followed suit even if we didn't necessarily think it was the right call.
In the financial markets, the fire alarm is the VIX Index, a measure of SPX 30 day implied volatility (across a range of strikes). It is a universal hedging vehicle, as even though it is an equity options index, given it trades all night long, it is used by macro, credit, & global equity investors alike to hedge risk because it can provide an asymmetric payoff when things go pear-shaped.
Implied volatility, as proxied by the VIX, is also an input to capital allocation decisions among many investors. The two that come to mind are risk parity investors & HF platforms. In its simplest form risk parity, allocates between equities & bonds with the allocation a function of its volatility, the higher the volatility, the lower the allocation. The idea being the portfolio has a risk-adjusted & more equal allocation of risk across constituents to achieve a targeted volatility level. If volatility is too low, leverage is used, If vols are too high, cash is used. As vols move higher, these portfolios first move into bonds & out of stocks, & if it continues, they eventually move to cash. Right now, the exact opposite is happening. As vols comes lower,bonds are bought. As it continues, they buy more equities to maintain the portfolio level target volatility.
HF are similar to this in the capital allocation. Especially when we refer to the big platforms, capital is allocated across the various teams of people using a Value at Risk approach. VaR is calculated on a portfolio by using volatility & determining what loss could occur 99% of the time over a 10 day period. This way the overall CIO knows her downside & can then lever up the firm. As volatility moves higher, risk capital is withdrawn from the various teams, & positions are closed. As volatility goes lower, teams are urged, if not ordered, to take on more risk. This is why we can get highly correlated actions among HF at either extreme.
The chart today looks at the VIX (actually, the 2nd futures contract to smooth the noise, inverted, in blue), risk parity in white & the smart money flow index in orange (hf proxy). You can see as vols move lower in 2021, these indices move higher. As vols move higher, the indices come lower. Right now, both HF & risk parity are being forced in to the mkt. The opposite of the fire alarm going of forcing people out, the all clear siren is going off & they are being forced in, even if it is against their better judgment, because there are investment mandates to be met. These flows can persist longer than you might think so just beware.”
We have to ask ourselves how much further this can go. If we look at it from a technical standpoint we can see we are soon getting into an overbought zone at the same time we are getting near the 1 year moving average.
If we look at the Commitment of Traders report, we can see that leveraged accounts are getting very short, in fact the shortest they have been in the last year. This coudl well be that as HF add risk back into their portfolios, they initially look to hedge with futures instead of the same short stocks they have been squeezed out of. it is the first step in starting to reposition their books.
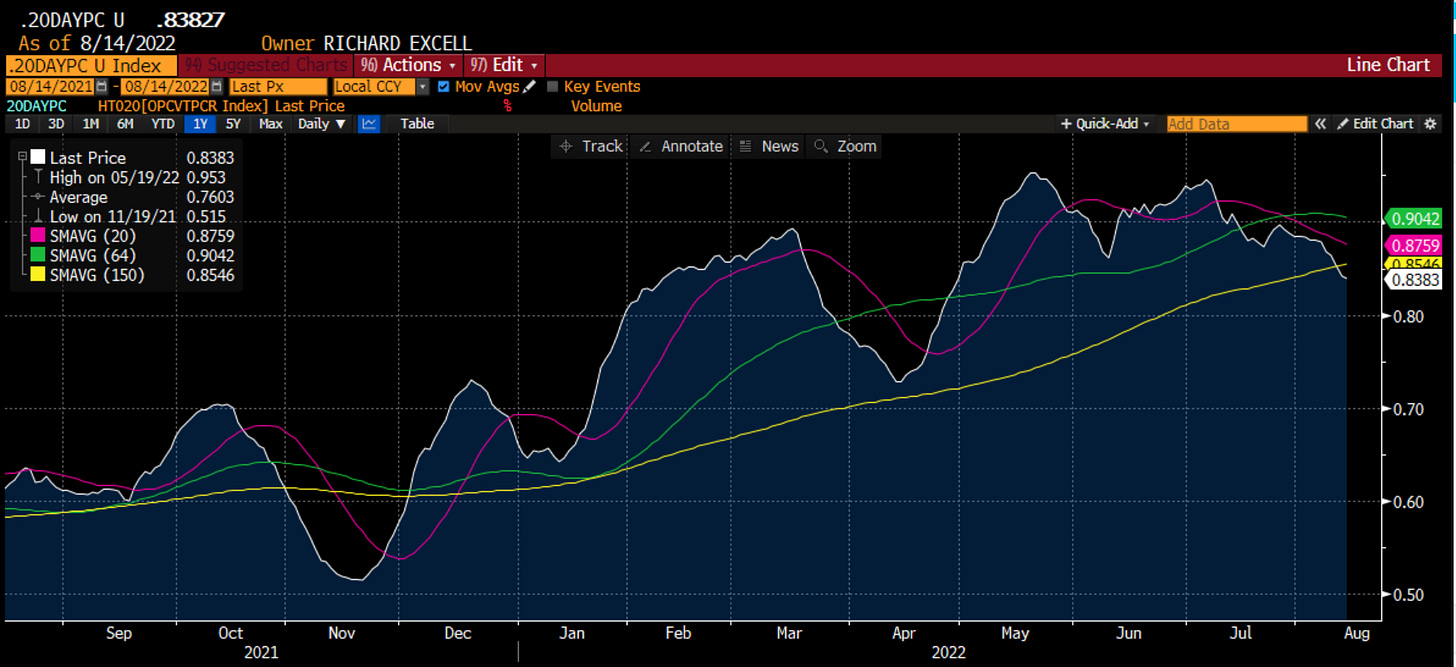
If we look to the options market, we can see that the number of puts trading relative to calls has been falling for the past month. This unwinding of hedges and adding to tactical upside is helping to drive the market. We want to see this turn before one gets too bearish.
Finally, as we look at risk-taking across markets, we again get a mixed message. We can see in purple, that Ether has been materially beating Bitcoin, driven by the upcoming merge catalyst, but also due to the return of risk-taking in crypto. The majority of coins are at their 1 month highs as well. However, if I also plot credit spreads on here (inverse) we can see that the credit market is not believing this rally. We are still near the highs of the year on credit spreads. As I have said many times, credit leads equities. This is reason to have some doubts about what might happen going forward.
So we are at a crossroads. A market that we said was too pessimistic a month ago, has been met with better than expected news on the economy and on earnings. Investors are being forced into the market and are unwinding hedges. However, we might be getting close to the point where we have gone too far. The credit market is not buying this move. Multiples have expanded back to the higher end of a range. Technically we are getting stretched. This does not necessarily mean the market goes straight back lower. Unlike what you read on Twitter, where everyone is a mega bear or perma bull, sometimes markets go sideways. With no meaningful catalysts until Jackson Hole Symposium at the end of the month, things might quiet down. The old adage is “Never short a dull market”. This is a time to now what you want to do when the time is right. It is time to work on your entry and exit disciplines for the ideas you want to put on. It is a time to …
Stay Vigilant


Thanks for this. Could P/Es just be pricing in more optimistic earnings, on the basis that higher inflation and, by extension, rates were priced into the most recent earnings forecast? What's the catalyst to change minds and trigger a sell-off (e.g., higher employment numbers, next inflation print, etc.)?
Sideways market would be AWESOME. appreciate the article, well written and well said.