Curiouser and Curiouser
If Alice was looking in the markets instead of Wonderland, she may have cried Seriouser and Seriouser
It has been a busy few weeks for the Vigilantes as we have had quite a bit of travel on the docket, as well as the early year work/teaching which is the busiest time for us. This is one of those parts of the year where we keep our nose to the grindstone and don’t look up until Eastertime. After that, we can cruise into the summer and then coast all summer long. For now, though, it is just focus, focus, focus.
We that in mind, I need to go back to my process to constantly remind, reassure and reassess whether the data and the outlook is consistent or inconsistent with my prevailing view. Without further ado, let’s dig in.
FUNDAMENTAL
I have been writing all year about how there is tension between the fundamental analysts/strategists and the technical traders. The fundamentals have been pointing lower through most of last year and into this year. The technicals, on the other hand, have been supportive of a rally, of THE rally, that we have seen to start the year.
The debate had been about recession vs. soft landing. Increasingly, as my colleague Tony Zhang pointed out on the Macro Matters webcast I posted this past week, there is a discussion of whether we get ‘no landing’. In my Portfolio Management class, we speak about the performance of sectors and assets in different phases, and when we look at the performance of the market, we can get a good idea of what the market is pricing in for the economy. On this front, Tony is definitely correct, that a no landing, is increasingly the view.
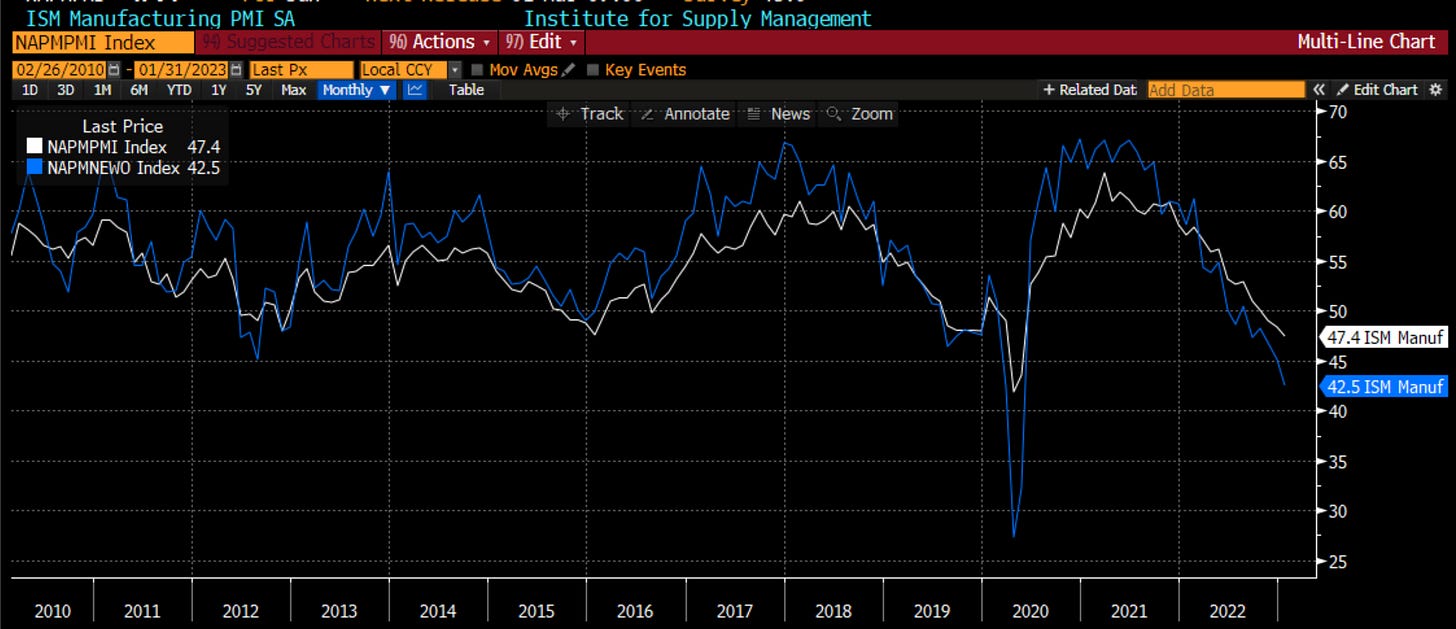
What do I think? I think I need to look at the data to form this view. You know of my interest in and favoritism toward the ISM as my preferred measure of growth. You also know that I feel ISM new orders to inventories leads the ISM itself. What leads the ISM new orders? Why? Because if we anticipate a turn in new orders, then perhaps we can anticipate a turn in ISM and therefore the SPX. With that in mind, I came across these three charts courtesy of Francois Trahan, who first started speaking of ISM back in the late 90s. He is a bit of an O.G. on this front. These three indicators - 5 year US Treasury yields, core PCE and Money Supply - all lead the ISM new orders. All are painting a bleak picture in the coming 6-9 months.
As you can see, all are pointing to ISM new orders headed to something in the 25-30 range vs. the current level of 42.5. What would that mean for ISM itself? If Covid is the comparison, it would put ISM at 42.5. If any other period is the comparison, it would put ISM nearer to 30.
What else is ISM new orders good at forecasting? The amount of positive surprises on earnings. More on earnings below and in the last section. However, just know that if new orders keeps falling as above, earnings are going to be under pressure for some time.
This is a twist on a chart I showed on Linked In this week. I spoke about how many want to suggest the economy will be strong because GDP is strong and jobs are strong. However, I try to show in this chart that GDP and jobs (measured here with unemployment, inverse) are very much lagging indicators. In fact, I also add on here the SPX forward earnings. Earnings have held up until recently. Are earnings a sign we won’t go into recession? Not really. Both earnings and jobs peak and roll over when the recession has already started. ISM clearly leads. Even GDP leads by a little bit. According to these measures, there is still danger ahead.
Jobs have held up very well. In fact, I have go on record suggesting we could get a job-full recession. When I mentioned that on a Linked In post this week, long-time follower Sekhar Kanuri asked me if a job-full recession was even a thing. This is how I answered":
“It isn't but I am trying to get across the idea of the opposite of the jobless recovery we had post GFC. At that time, the economy got better but no one was hired so the Fed had to stay lower for longer. Now I think the economy will get worse but many industries will be very slow to fire because it has been so hard to get people in the first place. Thus the Fed will need to stay higher for longer.”
Maybe helping my cause is a chart that comes courtesy of Mr. Risk at State Street Bank. You will recall Mr. Risk from a podcast last year. We are due for another one. Risk - of you are reading, we need to schedule. Mr. Risk points out that the small business bureau NFIB has a survey on compensation plans. This month’s reading was the smallest in 18 months. This chart overlays very well with average hourly earnings. Perhaps the wage pressure we have seen is starting to stall out even though there are some 11 million jobs still open. This helps on the inflation front, but may hurt on the economy front if consumers start to see some headwinds.
If wages are slowing could that be some reprieve on earnings? Not likely. We have already seen earnings slowing and even quite strongly the smaller we go in market capitalization. We can see in blue that Russell 2000 earnings have fallen about 30% already on a quarterly basis. They have fallen about 11% for mid-caps. It is really just beginning for the large caps.
This chart comes courtesy of Nanzy Lazar at PiperSandler. She is an earnings bear ‘to be sure’ as Nancy likes to say, but the point is well-taken. If we look at S&P earnings, whether using the S&P DJ calculation or the FactSet calculation (which are different actually given what is determined to be one-time etc), both suggest we need a 16% fall to get back to trend. You can see we don’t tend to stop at trend itself but let’s say we do. That would still put S&P earnings at about $185 (0.84*$220). That is more bearish than consensus.
I have gone through this argument before, but the view from some bulls is that even if earnings decline, multiples will expand and the market will be fine. That is simply not consistent with what we have seen in history nor what we have seen of late. For the past 18 months, forward earnings multiples have been driven by the Fed Funds terminal rate. For this rate, I proxy the Fed Funds future 6 months out. This future has taken another leg lower the past 2 weeks as the Fed has been more hawkish and the market realizes this. This could suggest, probably does suggest, that the multiple should easily fall to the 16-17x range from 18x right now and close to 20x it was when the market thought the Fed was pausing. For your edification, I did the math on the multiple * earnings or 17x * $185 is 3145 in the SPX. The SPX closed at 3970 on Friday.
I try to look for the potential in the economy and the market. I see the signs of relative strength and anecdotal evidence of the economy holding up well. However, when I go through the time-tested tried and true evidence that works in cycle after cycle, I just struggle to come out as anything more than downbeat from a Fundamental standpoint.
BEHAVIORAL
As I said at the top, the fundamentals have been negative for some time. I was out with some college friends on Thursday and one of them (looking at you D.O.) gave me a hard time for predicting 11 of the last 4 recessions. Not sure that is entirely accurate but at least he recognizes I have been a bit negative on the economy. That which has changed and changed my views in the past has been the supply and demand of the market or what I call the behavioral. You may recall I got upbeat for a trade last summer because traders got too downbeat. I did highlight earlier this year the possibility the rally could continue based on the technicals. I will be the first to tell you I did not participate in the rally because I preferred the high Sharpe ratio of cash as I did not believe there was much to it.
Speaking of Sharpe Ratios, Mr. Risk had another chart I wanted to share. It looked at his investor survey of forward-looking returns back in November and what the subsequent returns, on a risk-adjusted basis, have been. Maybe surprisingly, in spite of the volatility, crypto leads the way. One of the best? Cash of course:
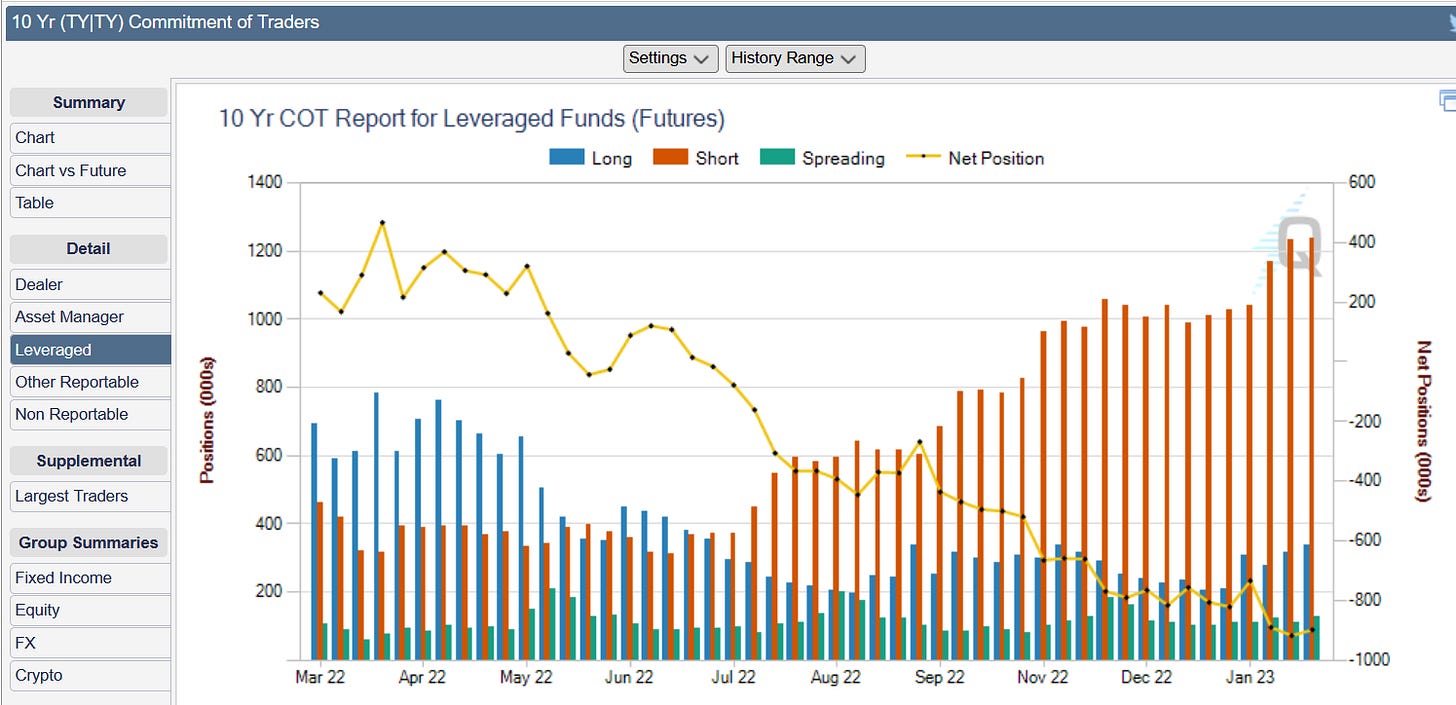
If I look at the Commitment of Traders data I get via CME Group, we can see that a lot of the short-covering from the leveraged community in January has turned into putting those shorts back on.
Interestingly, the shorts are also growing in the 10 year futures. Perhaps there are concerns inflation is still a concern and risk parity is going to go through another painful period.
EJ at Cantor does great work. He had a call this week and one of the slides he showed was that of CTA (commodity trading advisor) positioning. CTAs are a big driver of flows in the market and of the rolling 1 month returns in the SPX as EJ shows. These accounts have gotten max long but this may be rolling.
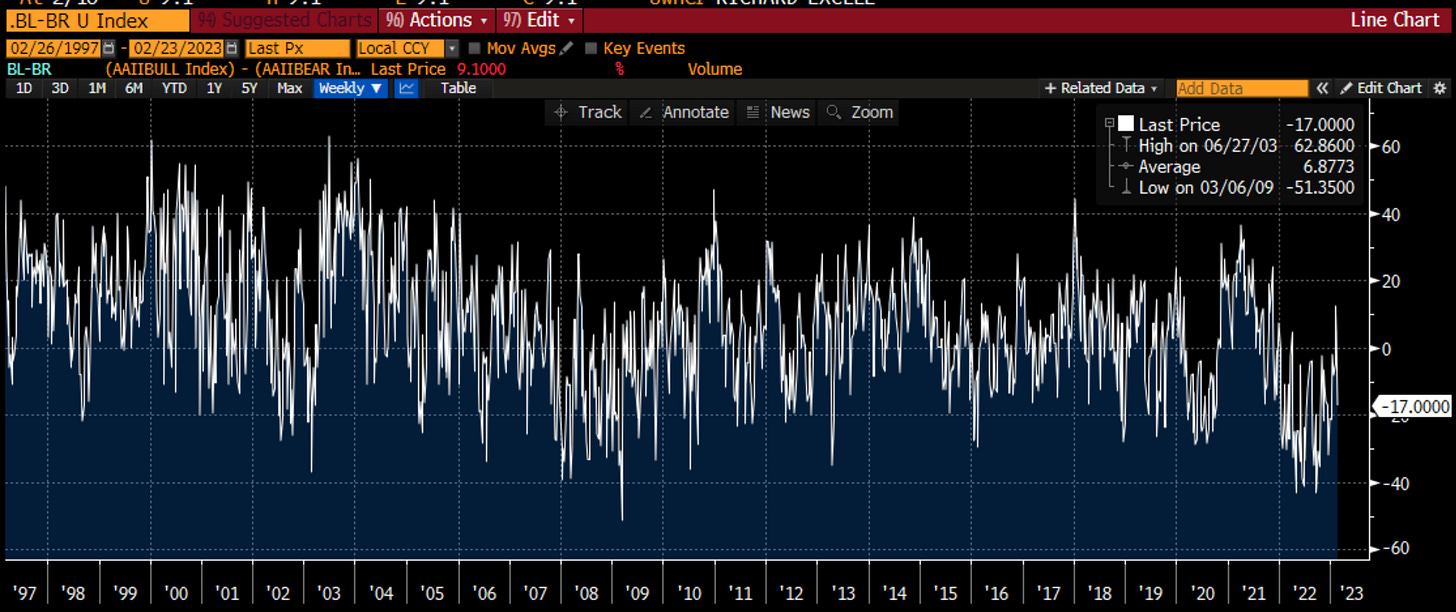
Another measure that has always worked well for me is the AAII bulls less bears index. The American Association of Individual Investors has tracked this for some time. The signal is strongest at extremes. Last year, when the bearishness for to e as bad as the Great Financial Crisis, we knew it hit peak. From the end of December through early this year the index moved from max bearishness to small bullishness. It has started to roll over again. This signals to me some trying times ahead.
Maybe my favorite sentiment measure is the 20 day moving average of put-call ratios. I have discussed this before but when investors are seeking the risk management and insurance of puts, and this average climbs higher, the market is in trouble. When investors either sell their hedges and close the puts, or turn and begin to speculate in calls, taking the average lower, the SPX sees better returns. One may argue that the 0 Days to Expiry options are messing this up. I have put in the chart the same moving average for both Cboe only and all US exchanges to try and see if there is a difference. There really isn’t. Ever so slightly, we can see the 20 day average turning back up telling me there may be some trouble ahead.
Wait a minute, I thought we had moved above the descending trendline, and the breakout was pointing much higher. I think I also heard some references to golden crosses and the like. For me, the three pictures on a daily chart that matter most are the ichimoku cloud - that area where the buyers and sellers are positioned from on average, giving us a sign of which group is in control - the MACD and the RSI. I also drew in here the trendline that has been referenced. You can see that we are moving back down to the trendline and ichimoku support. There is going to be a battle between bulls and bears this week. The moving average convergence-divergence is pointing lower, however, giving bears the advantage. The RSI is in no-man’s land.
Perhaps the reason that moving through the daily trendline did not lead to a breakout - besides the fact there was little reward to risk in the market - is because we moved right up to resistance on the ichimoku cloud on a weekly basis. That resistance stalled out the rally. Now, we are pointing lower to the 3200-3500 range which is gleaned from the Fibonacci retracement of the entire Covid low to 2022 high. Not surprising that is also approximately the 17x * 185-200 eps range. This is the level where longer term bulls and bears will do battle.
A quick look across other markets to see what the tone is. The longer bonds had led the risky asset higher. As these bonds rallied - proxied here by the TLT asset - the market interpretted that the fear was switching from inflation (where it had been all of 2022) to growth. As growth data came in well, risky assets rallied. However, lately, the bond market is moving lower on the data suggesting that maybe the Fed is not down and maybe there are still concerns on inflation. We are at a very critical level of support right now. It must hold this week.
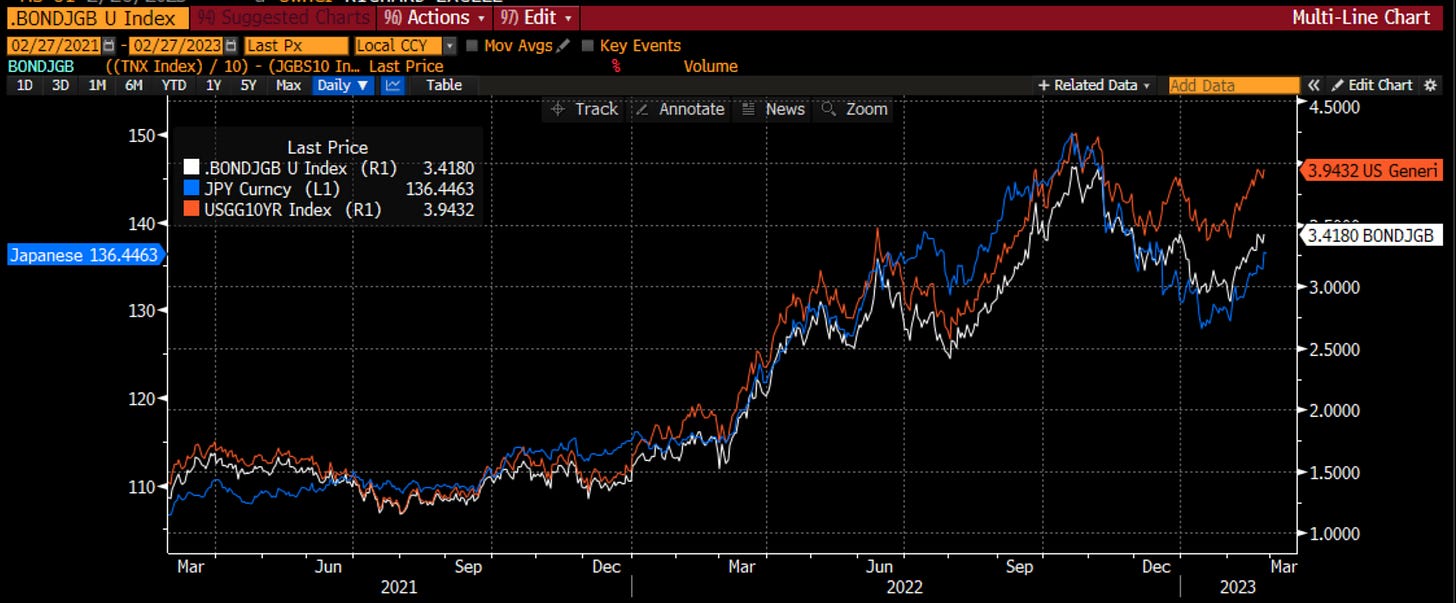
What are the other crosswinds driving the US bonds. As my students know, the 10 year US Treasury is THE benchmark asset for all asset classes. It affects all asset classes and sees inflows and outflows from everywhere in the world. The largest foreign investors in the US bond market are now the Japanese. The Japanese have their own issues and have a new governor coming in for the BOJ. The Yen has started weakening again and this is impacting the spread between US Treasuries and Japanese Government Bonds (JGBs). Since the JGB yield is so small, most of the damage is in the Treasury. If the Yen continues to weaken, the US bond may not hold the support it needs to this week.
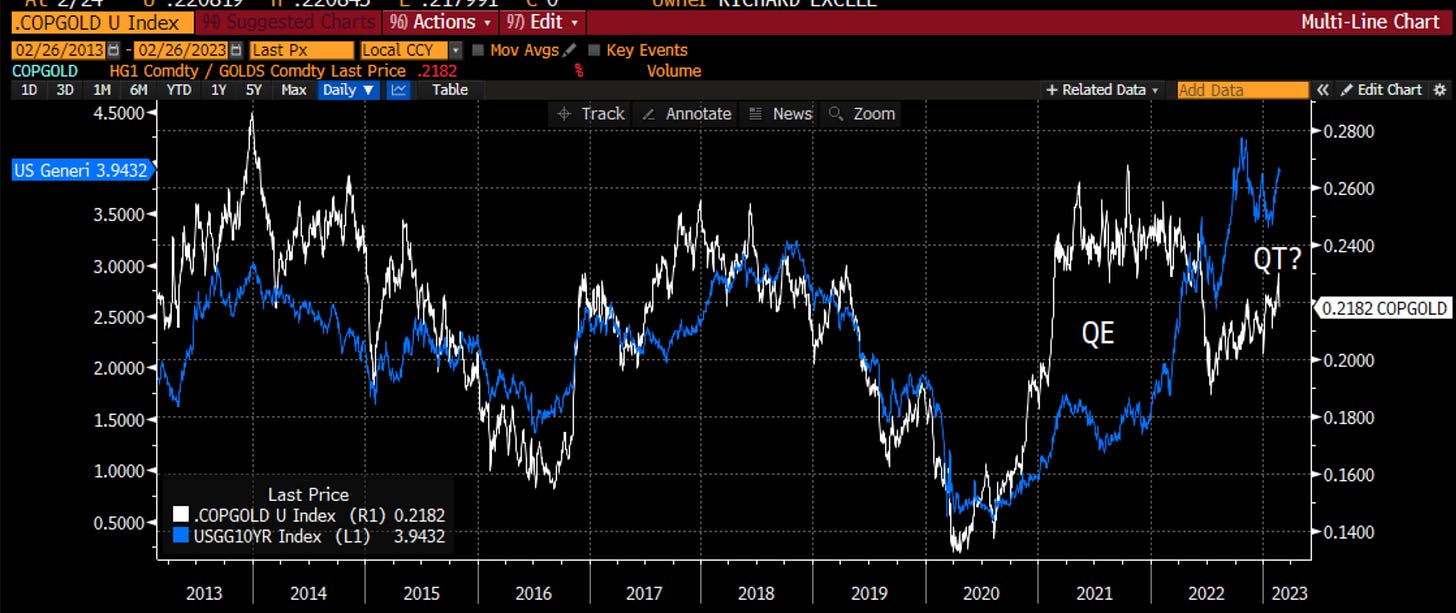
Another great indicator for US yields is the ratio of copper to gold. Jeffrey Gundlach has popularized it of late but I think it was Bill Gross who first started using it. Either way, I poached it from them both long ago. You can see this ratio of two metals - one known for economic growth, the other for safety - has historically had a tight fit with 10 year yields. There was a disconnect in 2020-2021 as QE was distorting the bond market. There is again a disconnect in the other direction. Perhaps it is QT impacting it now. Perhaps it is Japanese investors repatriating their money back to the domestic market. Either way, 10 year yields look to be above fair value.
I want to end with a quick look at other commodities. Commodity prices are a key driver of inflation. The falling prices in the last half of 2022 dragged down the key inflation measures. Many expect that to continue. However, there is another camp that suggests the Chinese re-opening will lead to a bid to commodities, given the high demand for all commodities from China. My preferred measure of Chinese growth is the Li Keqiang Index. Right now it is not suggesting we are seeing any re-opening economically. On this front, perhaps commodities do have some room lower which could help the Fed, even though it is now more focused on ex-food, ex-energy, ex-housing services inflation.
The technical picture has been the big change of late. What was a positive picture, neutralizing the negative fundamental view, has now moved to neutral with a risk of going bearish. There are many key levels to watch in the equity and bond markets. There are big potential catalysts with Japanese repatriation or Chinese re-opening. The leveraged money and the options market are giving us a warning sign. If the CTA flows turn, it is time to be careful.
CATALYST
What will happen now to get us to change our minds? Probably very little if I am honest but it always important to take a quick look at the economic, earnings and geopolitical catalysts.
First, the economic data in China and the US have been surprising to the upside, while the opposite is true in Europe. As I showed above, this may not yet be leading to signs of a Chinese re-opening bid, but the surprise level is worth noting. I am cautiously optimistic China’s re-opening may be legs. With the US data, we are now to the point where the market is again worried about inflation. Remember a VERY important point. When the market is worried about growth, stocks and bonds are negatively correlated. When the market is worried about inflation, stocks and bonds are positively correlated. This is a major difference. The latter is true right now.
We are almost finished with earnings season, as about 93% of the market has reported. I am going to show you some charts from Jonathan Golub at Credit Suisse, as he summarizes nicely the results.
First, we can see that across the board, revenues were still pretty good, growing at 5.8%. However, margins were hurt by almost 10% which took earnings down about 4%. Across the sectors, Energy had by far the strongest earnings, followed by Industrials. the weakest earnings came from internet retail where margins got absolutely hammered. I wonder how long those free shipping models are going to last. Led by Energy, cyclical sectors fared much better than defensive sectors and this is a big part for the pro-growth stock rally. TECH+, where a lot of people are overweight as these stocks led the last cycle, had a very tough earnings season all in all. We spoke about it above, this is the beginning of a trend like this that will continue for another few quarters for sure.
How did investors respond? You can see that companies that beat on both revenues and earnings were rewarded, while those that missed on both were punished. Outside of that there was a positive drift to the other names.
Finally, a good look at how each sector did when further parsed into growth vs. value WITHIN the sector, and then rolled up to the top. Value struggled across almost all sectors with the exception of Energy and Industrials. Value particularly struggled in Financials and TECH+
The last catalyst section I want to focus on is the geopolitical area. I have written before that this section is almost always negative, it is just degrees of negativity. In fact, many times, getting past an expected negative event as a non-event can be a big positive. Right now, there is growing geopolitical risk. PolicyUncertainty.com has a nice index showing us these risks and the current acceleration in them.
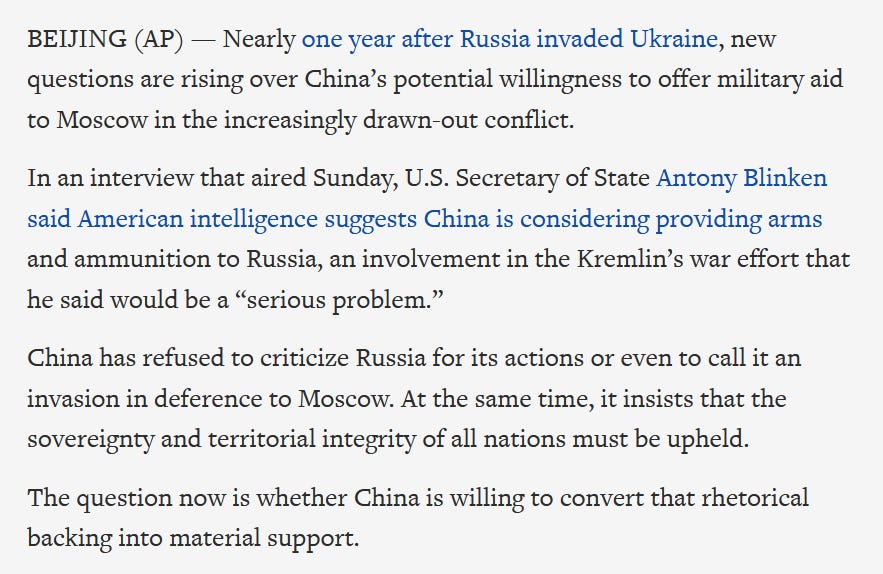
I was particularly struck in the last week or so by three stories, all in relation to Ukraine, that all pointed into a deepening of a Cold War II and had the makings of the beginning of a deeper proxy war between US and China in Ukraine. To wit:
In a speech to Russians 5 days ago, Putin continued to blame the Nazification of Ukraine on Zelensky et al. He also told the people that NATO is taking part in the war, and then made the most unnerving remark by suspending Russia’s involvement in the START Treaty. The Strategic Arms Reduction Treaty has been a key part of the US-Russia post Cold War relations. Even when things got tough, neither side moved away from this. Until now.
In addition, Biden made news of his own given a surprise visit to Ukraine where he characterized the US support for Ukraine as ‘unwavering’ and told the audience the US would do ‘whatever it takes’. This doesn’t sound like someone who sent a message of backing down or peace when he was speaking to the Ukrainian president.
Finally, I read this story by the AP:
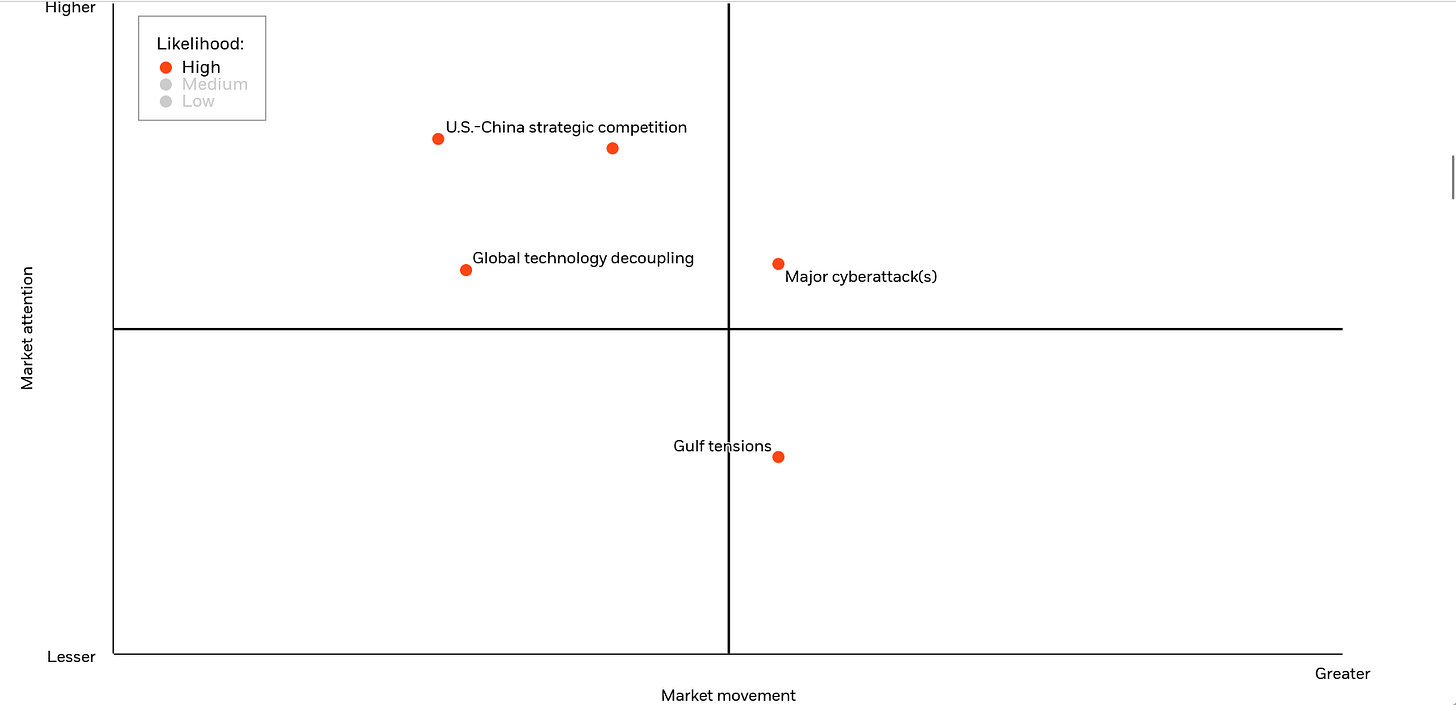
My antenna are very much perked up that a proxy war in Ukraine may become the new status quo. The Russia-NATO conflict is the second red dot on the top of this chart by BlackRock, right next two US-China strategic competition. You can see that both are in the quadrant of high market attention but some far, below average market movement. Could this change?
Finally, I will leave you with my thoughts from last Friday on fiscal spending given the speech Biden gave about ‘whatever it takes’ in Ukraine. This has feelings of ‘guns and butter’ from LBJ in 1966, when he doubled down on his spending on a war in Viet Nam with domestic spending. Is this the direction Biden is going? This is going to be a very real issue in the coming year and a half into the election, because it seems the incumbents, as wont to do, are going to be spending money making the Fed’s job even harder than it is:
“Chart of the Day - fasting. The season of Lent has started for me. That means we have moved into a phase of fasting on Fridays. We have come a long way from 'Fat Tuesday' where everyone could enjoy their favorite delectable (and more) just earlier this week.
It is this same sort of feast or famine that we have been witnessing in spades in fiscal policy world recently. Though the famine in the past year really has been because we are lapping more difficult comps.
The 'reduction' in fiscal spend has had a meaningful impact and drag on GDP growth. Remember the old GDP = C + I + G from your econ days and realize the change in G has been negative the past year, masking strength in other parts of the economy.
This change in fiscal spend has also been dampening inflation. You can see the change in fiscal spend and the change in CPI in the chart today. The big busts of fiscal spend lead to moves higher in CPI which then slowly fades.
The burst around Covid was epic and not before seen in this time series. Should it be a surprise that we saw a massive spike in inflation which is and will take a while to subside?
Then we have to consider what the future of this fiscal spending is goign to look like. The Budget calls for new spending initiatives focused on public health, education, housing, crime prevention and more.
Then there was the speech given in Ukraine that said our support there would be unwavering and do whatever it takes. Let's throw in the mix that both sides have said there will be no entitlement reform.
What do we think fiscal spend will look like in the coming year or two, particularly with an election next year? What impact do we think this will have in inflation? Do we think this will make the Fed's job harder or easier?
We can argue it could be good for nominal revenues for companies. However, what does this persistent inflation mean for margins?”
Stay Vigilant
#markets #investing #stocks #bonds #inflation #fiscalspending
Thus, we close the final category where things are getting more negative as well. In quick conclusion, the fundamentals are negative, the technicals have moved from positive to neutral with a very real risk of going negative, and the catalysts are turning negative. This is going to be a very nervous few weeks for the market. Beware the Ides of March and …
Stay Vigilant!


