Didn't see that coming
Well, I may not have been pounding the table on the recession as much as #FinTwit, but I am as surprised as others by the events of this past week
Last week I laid out my case for why the rally we are witnessing is a bear market rally and not the start of a new bull market. I looked at the developing narratives from a number of angles to avoid cognitive dissonance and still stuck with the conclusion upon which I had been working. The non-farm payroll number on Friday calls that into question somewhat.
You see, as I found out during the Great Financial Crisis, being early can be the same as being wrong. I had gotten very bearish on risk markets at the end of 2006 because of the developing housing implosion. As I have talked about, I knew of the importance of housing to the economy, and given the downturn was national, I knew it would be bad for the stock market. However, as you can see from the chart, in spite of the drop in the NAHB Housing Index, from the summer of 2006 to the summer of 2007, the stock market rallied 40%.
My colleagues had so much fun at my expense for being wrong, they even auctioned off a ‘lunch with the biggest bear in the woods’, a pun on the lunch with Warren Buffet, on social media. There were no bidders.
Ultimately, I was proven right. However, the lesson learned is that being early is no different than being wrong in the world of investment management. That is the pain that many professional investors are facing right now. You see, if you run an equity or credit fund, that has a beta to the index, and you are not keeping up with the index, the investor calls each month are not going to go well. You may be ‘right’ in the end, but if you have no AUM at that point, it won’t matter. That is why I view the Michael Burry episode of “The Great Short” with some reality check - no investment platform would have allowed one to stay short through that much negative performance and investor outflow. The vast majority would have been fired. It is only friends and family that may allow that. The vast majority are nervous right now.
This is what professionals are facing. They are trying to enjoy a family vacation before school starts but are either getting stopped out of bearish positions or lagging the benchmark badly because they are underweight. It will be attributed to the noise of summer but how long can that last? The market is 14% off the lows. Do you wait for 20%? Wait until the market is flat for the year? You need a plan.
It is not my first rodeo though. I have seen downturns of all shapes and sizes: the first Gulf War, the Tequila Crisis, the Asian Financial Crisis, Y2K, the Tech Bubble, 9/11 etc. Through it all, you have to play the cards and you have to play the players. You know what two cards you have in the hole. Right now we have seen the Flop and the Turn. We still haven’t gotten the River. After the Turn (NFP number), there are now different players betting more aggressively than there were after the Flop. How do you react?
You need to go back to the odds of success. The risk vs. reward of the various ideas you have on in your portfolio, be they long or short. You need to also consider the implementation of your ideas: are they or should they be relative value ideas? Should you use options either for insurance or as a replacement for your deltas? What catalysts or news do you expect and need to see to be more confident that the hand you hold is the right one?
There are lots of technical charts being shown around on social media right now. I am going to put on here with a lot going on just to show you that right now, I can make a bullish or bearish narrative using charts. Look at the daily chart of SPY. It has moved above the Ichimoku cloud level (bullish). There isn’t meaningful resistance until the area where the downtrend from December high and the Fibonacci 61.8% level coincide around 435 (also bullish). However, the MACD is starting to roll over (soon to be bearish) and the RSI is the most overbought it has been since November of last year (also bearish).
But if you look at the weekly chart, there are more bullish than bearish signals with a positive MACD and RSI and no resistance until 450:
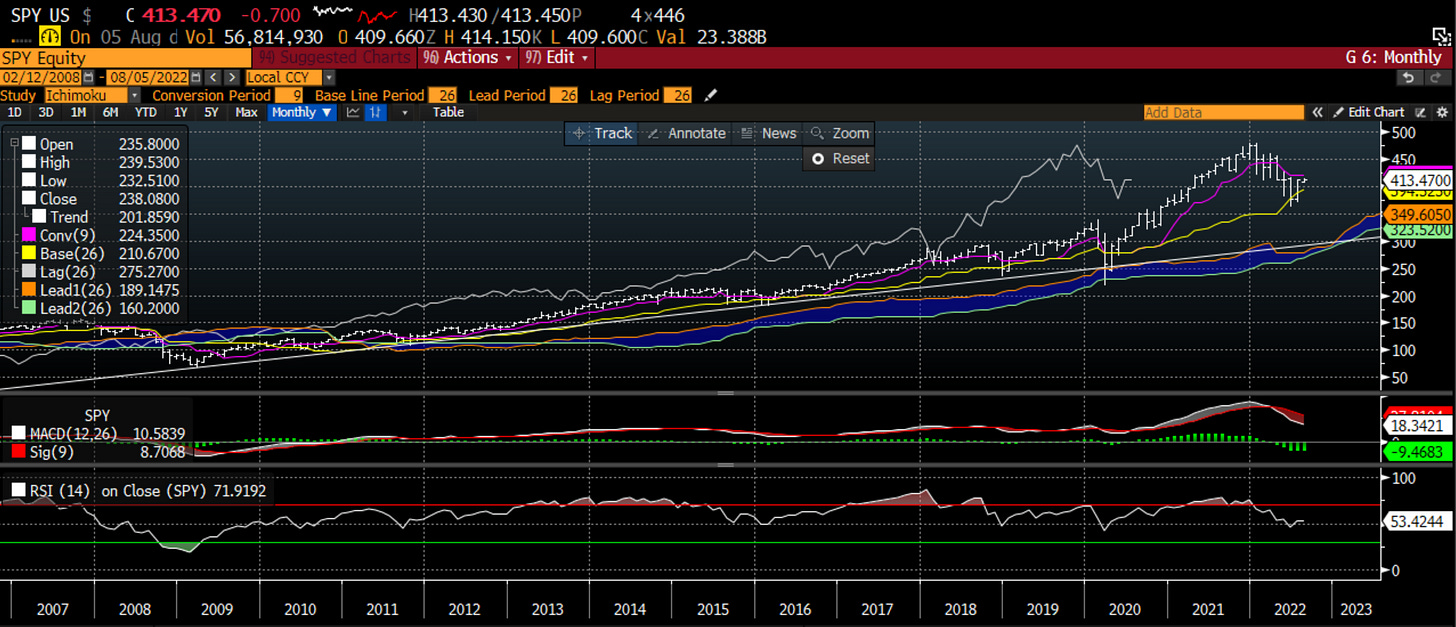
But, if you look at a monthly chart, there are more bearish than bullish signals with no support until the low 300s:
What are you to do? Well, it depends on your time horizon. If you are a day trader, you need to respect the daily charts. Both bulls and bears should lack confidence and should probably be using more options to express views. If you are a swing trader, you should focus on the weekly charts and be looking to buy any pull back in risk for a move higher in the coming weeks. If you are a long term investor, you want to sell into any strength you see over the next month or so because there are bad things to come. You see, sometimes, most times, the markets are not so straight-forward that a big obivous directional move is imminently on the horizon. Those positioned accordingly, are at risk of being burned by news that gets one of the groups above to become more aggressive. This is what we saw on Friday.
The data we have seen this month is causing many to change their views on the path forward. The chart below is the number of hikes by the Federal Reserve priced in for the next 1 year. You can see at the end of July, this dropped from over 6 to about 3. This was the ‘Fed Pivot’ being priced into the short-term interest rate market. With the stronger ISM Manufacturing and ISM Services, combined with a much better than expected NFP, the number of hikes priced in has gone back to almost 5. That is a big change in opinion in short-term rates.
It wasn’t just the STIR market. Several Fed officials were out during the week prior to the NFP number telling the market that it was wrong. They said it explicitly that the market is far too dovish, far too optimistic on rate cuts in 2023 and those were likely not happening. All of this served then to move the 2 yr yield much higher, which dragged the 10yr yield with it.
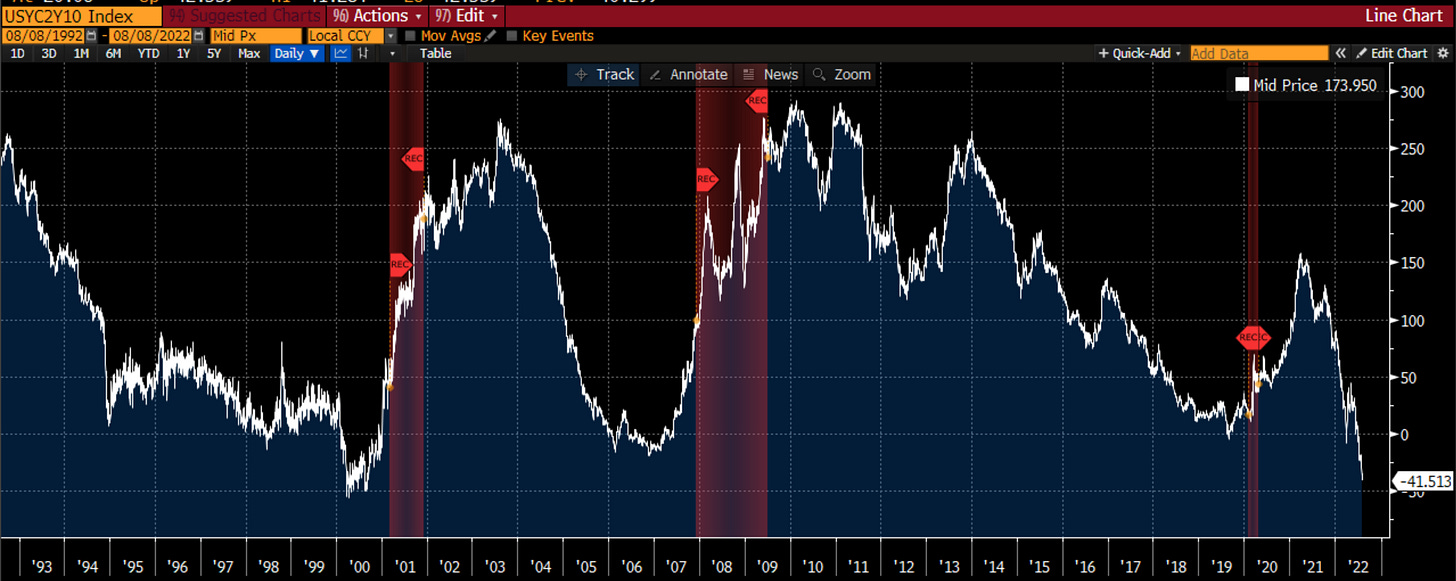
The 2yr moved more quickly than the 10yr which means the yield curve flattened even more. Ironically, this then serves to increase the odds that the market will be right at some point. The thing about that yield curve is that it leads by anywhere from 6 months (pre-Covid) to almost 2 years (GFC). Being early is as bad as being wrong. Remember my lesson from the GFC:
This isn’t just bad for bonds though in the near term. It is also a headwind for equities. Why is that? Because yields matter for equities too. The yields are inversely correlated to the multiple investors will pay for earnings. This multiple has moved higher (from 15 to 17 for the foward P/E and from 11 to 12.5 for the forward EV/EBITDA) as the bond yield has moved lower from 3.5% to 2.5%. As the bond yield moves higher, the multiple investors pay will move lower. This is the headwind for stocks.
But the multiple is only half of the story. Prices are driven by earnings as well. We can look at the ISM Total compared to the Actual eps in the SPX so far. Earnings are holding up well on a relative basis.
While the actual in Q2 holds up well, the expected in Q3 has taken a nose dive. This will be the interesting figure for stocks to watch in the weeks ahead. If the economy is stronger than expected, the Q3 number must go higher, which means that even if multiples contract, stocks can stay flat or move higher. However, if the expected Q3 earnings do not change in the coming weeks, and multiples contract, stocks are going to move lower with bonds.
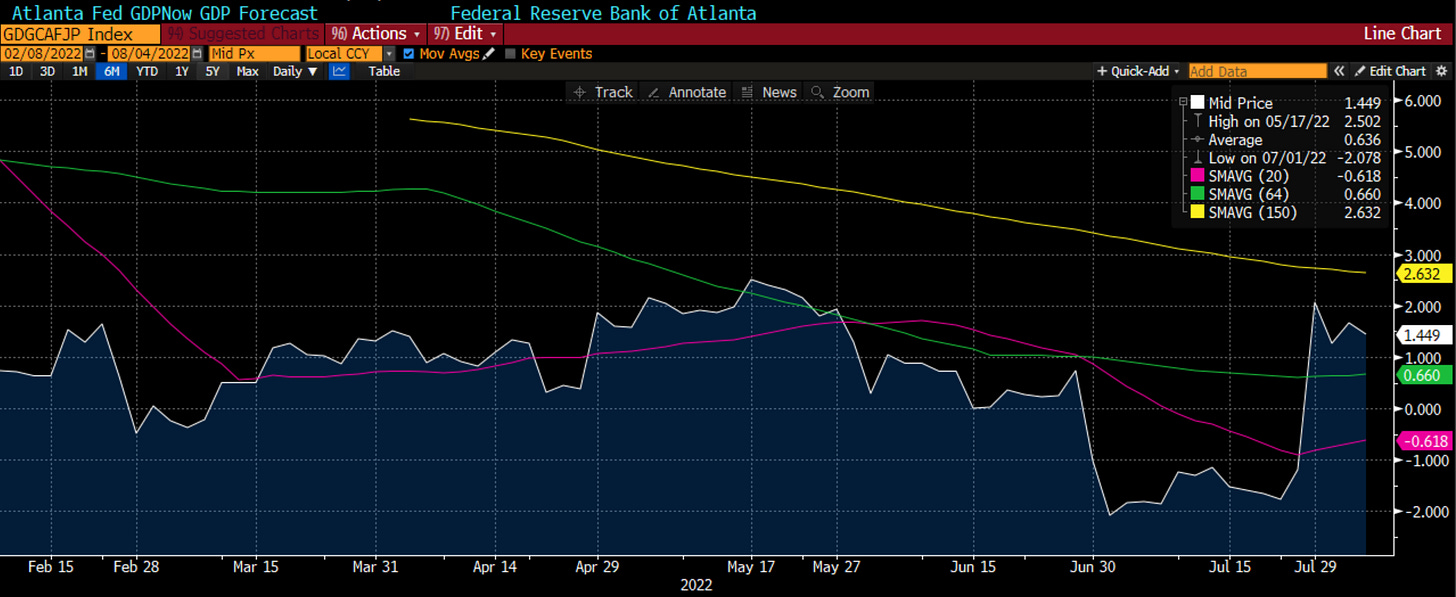
Investors are just as data dependent as the Fed is. This week we will get CPI and PPI as well as the Univ of Michigan inflation expectations number. While the Fed prefers the PCE inflation figure, these will all be important in setting the narrative for investing in the coming weeks. The Fed is telling us they think the economy will stay strong and it will need to hike more aggressively than the market thinks. The Atlanta Fed nowcast currently sits at 1.45%, which is stronger than last quarter.
The US economic data has been coming in better than expected and this may be set to continue. This could put more pressure on the STIR market.
I myself see the yellow warning flags. I see the multiples compression that will set back in. I see the negative monthly charts and sense what the September/October period may bring. However, I have also been burned by being too early. I know I need to play the players too.
I can sense what the discussion at investment management firms is right now, because I have been there for those discussions. There is much disbelief that this is real. There is also much pain and concern for the loss of AUM. Throw into all of this that we are still in the illiquid, choppy summer months. Markets can and will move more on headlines than you would expect. Portfolio managers are at the beach and have told their traders to only call in the case of emergency.
I would expect little change in the real money flows of assets in the next two weeks which means day traders and swing traders will be ruling the roost. Make sure you have a plan for your portfolio, make sure you know what duration you investment ideas are, make sure you are accounting for how others are thinking, and most of all …
Stay Vigilant


Bought the June lows. While your general comments are helpful, many bears were just way too bearish in June. Sorry but nominal GDP/gdi very strong. Earnings "shoe" didnt drop. Inflation keeps rolling over and I see economic expansion. Market and economy can take 3.5-4% FFR imho.
Thanks. Timing isn't easy. Ultimately the Fed will decide.