The past couple semesters, I have worked with different student groups to use the latest in machine learning techniques to quantify my investment process and determine if I can improve on the results that I have found qualitatively through the years. This past semester, some grad students used a number of random forest models in another attempt at this process improvement.
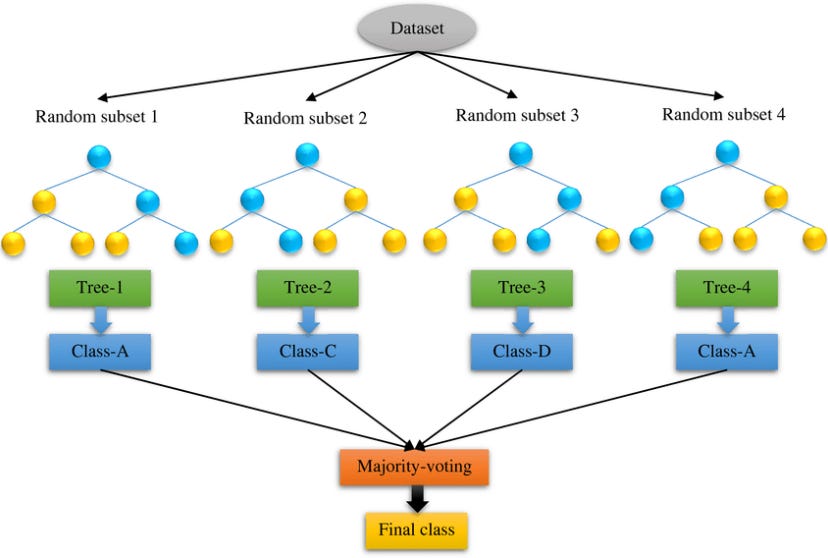
Before I go on, for those not familiar, per Wikipedia: random forests or random decision forests are an ensemble learning method for classification, regression and other tasks that operates by constructing a multitude of decision trees at training time. For classification tasks, the output of the random forest is the class selected by most trees. For regression tasks, the mean or average prediction of the individual trees is returned.
The process begins by determining a number of variables to start. As I have mentioned many times in my writings, I break the variables I consider into three categories: Fundamental, Behavioral and Catalyst. I find this process is fractal in nature, allowing me to use to for a single security or idea, as well as for an entire cross-asset portfolio. If all three categories are pointing in the same direction, for example positive for risky assets, this would tell me to have a full-size position. If one category is positive and one is negative, these would cancel out and no position is taken. If one is positive and the others are neutral or cancel, a smaller position would be put on that could be added to as the data changes.
The variables I use are plentiful but within each broader category are sub-categories:
Fundamental: Relative valuation, economic trend, liquidity & velocity
Behavioral: Surveys, option market indicators, technical analysis, & market flows
Catalyst: Economic surprise, earnings & geopolitics
Not every category is important every month as there are times when the market is more heavily focused on one category vs. the others. For instance, in late summer, I believe the market was focused the most on Fundamentals. By November, it was the Behavioral category that led.
As we start the year, the market is focused to some extent on all of these categories. Within the Fundamental, will we have a hard landing or soft landing, & will the Fed cut rates or not. Within the Behavioral, are markets overbought, what are the flows into risky at the start of the year, & how bullish are the investor surveys? Finally, within Catalyst, we have earnings data coming out & the Red Sea attacks keep a heightened focus on geopolitical risk.
I think the beauty of this process for me through the years is to collect anything people may care about, aggregate and organize, determine if the news broadly is positive or negative, and then assign higher weights to where you think the markets cares the most. This has helped me stay relatively objective, but I still thought that could be improvements. This is why I turned to the random forest models.
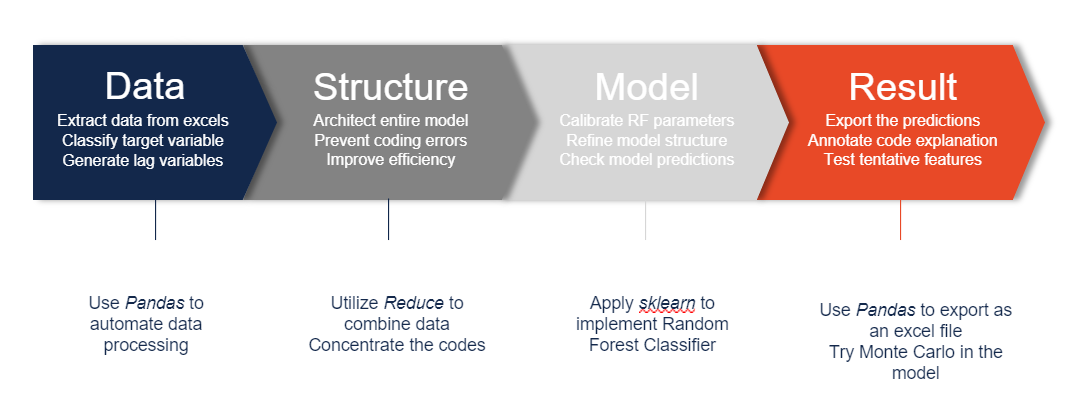
The students were discipline in their approach:
I always enjoy these real-time projects because the students, who largely have been given very easy and clean data sets in all of their classes, get a rude awakening to the time it takes to find and process data for a project. Clearly 80% of the time is spent on this aspect which throws many. However, they quickly worked through this and began using the models to determine which, of the dozens of variables I use, were the most important to look at.
Fundamental variables:
All of these features were deemed important enough to use in the final model, but I thought it was interesting to see the most important variables were those that I would have intuitively chosen myself: Changes in corporate bond spreads (the credit market leads the equity market), CEO Capex outlook, Housing data, the yield curve & the Chicago Fed credit conditions index. All determine the cost and availability of money that could be spent on projects, and how the end-users are feeling about putting that money to work.
We can see other variables like M2 money supply, jobless claims, small business optimism and CPI as being important as well. The cost and availability of money is always the initial driver of risky decisions.
Behavioral
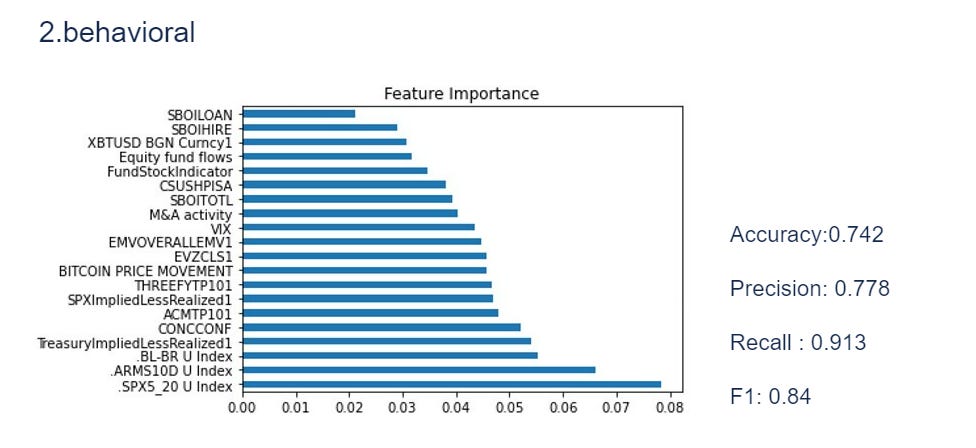
In the Behavioral category, there were some surprises in what the model felt were the most important variables. the most important was a short-term technical measure, the 5 day vs. the 20 day moving average. Even though we looked at decades of data, this measure was the most important. When we broke the data into periods, it rose in importance even more, with more short-term behavior now than earlier this century.
There were other important measures such as the ARMS Index and Bulls minus Bears. I found this interesting because many tell me this type of data doesn’t matter anymore. Finally, the option market data, equity and bond, proved to be quite important. One last one that was important but which surprised me was the 10-year term premium in US treasuries. However, maybe I should not be so surprised given the duration-led rally we say in November and December of this past year, as well as duration-led moves higher and lower in risky assets in 2021 and 2022.
Catalyst
The economic uncertainty index and the St. Louis Fed stress index led the way on the catalyst front. This was a difficult category because there are times when earnings are the only thing that matters. Then, there are long periods of time when earnings don’t matter at all. Ditto geopolitical events. However, uncertainty and stress are always important to bear in mind.
The next step is to take this data and use it to make predictions going forward for each of these categories, and then take the category predictions and use them to make predictions for the overall market. The overall process uses a combination of random forest regression, random forest classification, and ARIMAX models.
When we do out of sample back-testing of the model, we find it is not perfect, but it does a pretty solid job. In fact, it is the last couple of years when it has struggled the most, and I might attribute this to both the Covid-era distortions to the input data, but also the extreme measures the US went to on a fiscal front, a variable that is only capture on a second-order basis.
The model was downbeat on risky assets for the latter half of December and into January. It did not look too foolish until the recent 1-day rally this past week. I will continue to update this model and let you know what it is telling us.
For now, though, we can also take a qualitative look at the most important factors. Remember, the most important Fundamental variables were credit spreads, Capex outlook, MBA purchase & refi data and Chicago Fed credit conditions. These are all seen below. the Capex outlook is still plugging along the lowest of the last two years, but it did perk up in the latest reading. Too soon to give that an all-clear. The MBA data had collapsed at the end of last year but has picked up of late. Looking at some other housing data, there is reason to believe there may be green shoots again, like last year, but we will have to keep our eyes out. The biggest bring spot is on the credit conditions, whether we use the Chicago Fed or Moody’s data, the credit markets are still pretty sanguine. I would say this category is generally positive.
Behaviorally, I show three variables. The short-term SPX technicals were pointing lower all of early January but have started to look better. The move back to all-time highs will most likely bring in another wave of buying. The ARMS Index is elevated but does not quite look overbought yet but this is something to watch. Finally, the AAII bulls minus bears has been very exuberant and so I think this is another reason to be careful about chasing. I would suggest this category is neutral with a risk of being negative.
Catalyst - I look at two variables only. Both of these, the economic uncertainty index and the St. Louis Fed Stress Index are both near their lows. There is no sign of concern for market players coming from these signals. I personally am amazed at how apathetic the market is toward the continued fighting in Ukraine and the escalation in the Middle East, not just the Red Sea but the dozens of attacks on US bases. There is also a non-zero probability that there is some level of coordination by the BRICs in all of these. This Cold War II is looking to be quite a bit like Cold War I which should serve to depress multiples over time. However, no one seems to care now. I would have to say this is positive now, with the ever-present risk of a headline changing that.
All in all, while downbeat at the end of last year and into this year, the model is picking up a bit. Qualitatively, I feel the scenario where we have a soft-landing, but no Fed cuts, is the most likely scenario. I would generally think this should lead to a re-pricing of stocks, but the flows and fiscal spend may very well overwhelm that. Thus, I am trying to remain as flexible as I can in trading these markets, keeping powder dry, and using plenty of options to express my views on the upside and the downside.
I hope you enjoyed this walk through the move toward automating more of what I do. Would love to hear your thoughts. As always …
Stay Vigilant


Think about what your universe frame is, define it's constraints. Your approach on the 3 categories is TOP
Fabulous exercise. Love your students’ work. Looking forward to reading more about how the model works through 2024. Should be an interesting year