


Fool me once, shame on you
Looking at some historical analogies for the current market


I was at an event with my Investment Management Academy students, and we were talking about the latest news on nuclear energy. As one student referred to it as ‘nuke-u-lar’ I was reminded of George W. Bush who famously mispronounced it that way. Anyway, that turned into a discussion of other Bush-isms, which I was surprised to know that they knew quite a few of. The title of the piece this week is a Bush-ism and it came to mind as I listen to the debate among many in the market about which historical time most resembles the current period. I will try my best to lay them out and let you decide.
Scenario 1 - the mid 1990s
Global growth was strong in the early 90s as we came out of a recession. Companies were beginning to expand rapidly to Asia, mostly Southeast Asia as Japan was just beginning its long hard slog of de-leveraging while the Asian Tigers were beginning to take over. I know this time well because I moved to Southeast Asia in 1992 and spent all but 18 months there. It was a bull market from the get go as investors were sending billions of foreign direct investment attracted by the high growth rates. This FDI drove equity markets higher as you can see in the orange line. Many of the currencies were pegged or in a managed float and so the currencies didn’t adjust. This also led to a rapid expansion of credit and widespread speculation in real estate. The mid 90s were definitely a bull market, primarily in Asia.

With the US and global economy so hot, the Fed embarked on a rate hiking cycle in 1994 that took Fed Funds from 3% up to 6%. As we exited 1994 and looked into 1995, investors began to see higher rates on US assets and a stock market that looked more attractive on valuation terms. There was a rush to move assets out of Asia and into the US. With the Asia currencies pegged or in some sort of fixed rate regime, this put considerable pressure on central bank balance sheets in the region. As you can see, in spite of an aggressive Fed rate hiking cycle, the US yield curve never inverted. Stocks went sideways in the period of rate hikes and then exploded higher after.

You can see that the Price/Earnings ratio for the SPX took a hit in 1994 but the overall market was never down even double digits that year as earnings were still growing rapidly with all of the global growth. Once the Fed started easing in 1995, as strains on Asian central bank balance sheets were already evident, this led an expansion of P/E combined with already strong earnings. The US market was up over 30% in 1995 as a result.

If I overlay the period from 2020 until present to the period from 1992-1999, I can see a similarity in the valuation of stocks. As rates moved higher in 1994/2022, P/E came lower. When the expectation and reality of lower rates happened, P/E expanded. One difference I can see is that earnings grew over 30% in 1995 (in line with the market returns) and were quite positive throughout the rate hike cycle. Conversely, earnings over the last couple years have been flat, and all of the heavy lifting has been done by multiple expansion.

However, if we have a soft landing, the current period would line up with the soft landing witnessed in the mid 90s which was a very good time for US stocks. You can see the overlay of the current period vs. the 90s in the US and in percentage terms, it is following along pretty well. This scenario is definitely the bull scenario, because it would suggest that the current AI-driven rally, compared to the internet rally of the late 90s, is only about half-way complete.

Scenario 2 - the late 60s and into the 70s
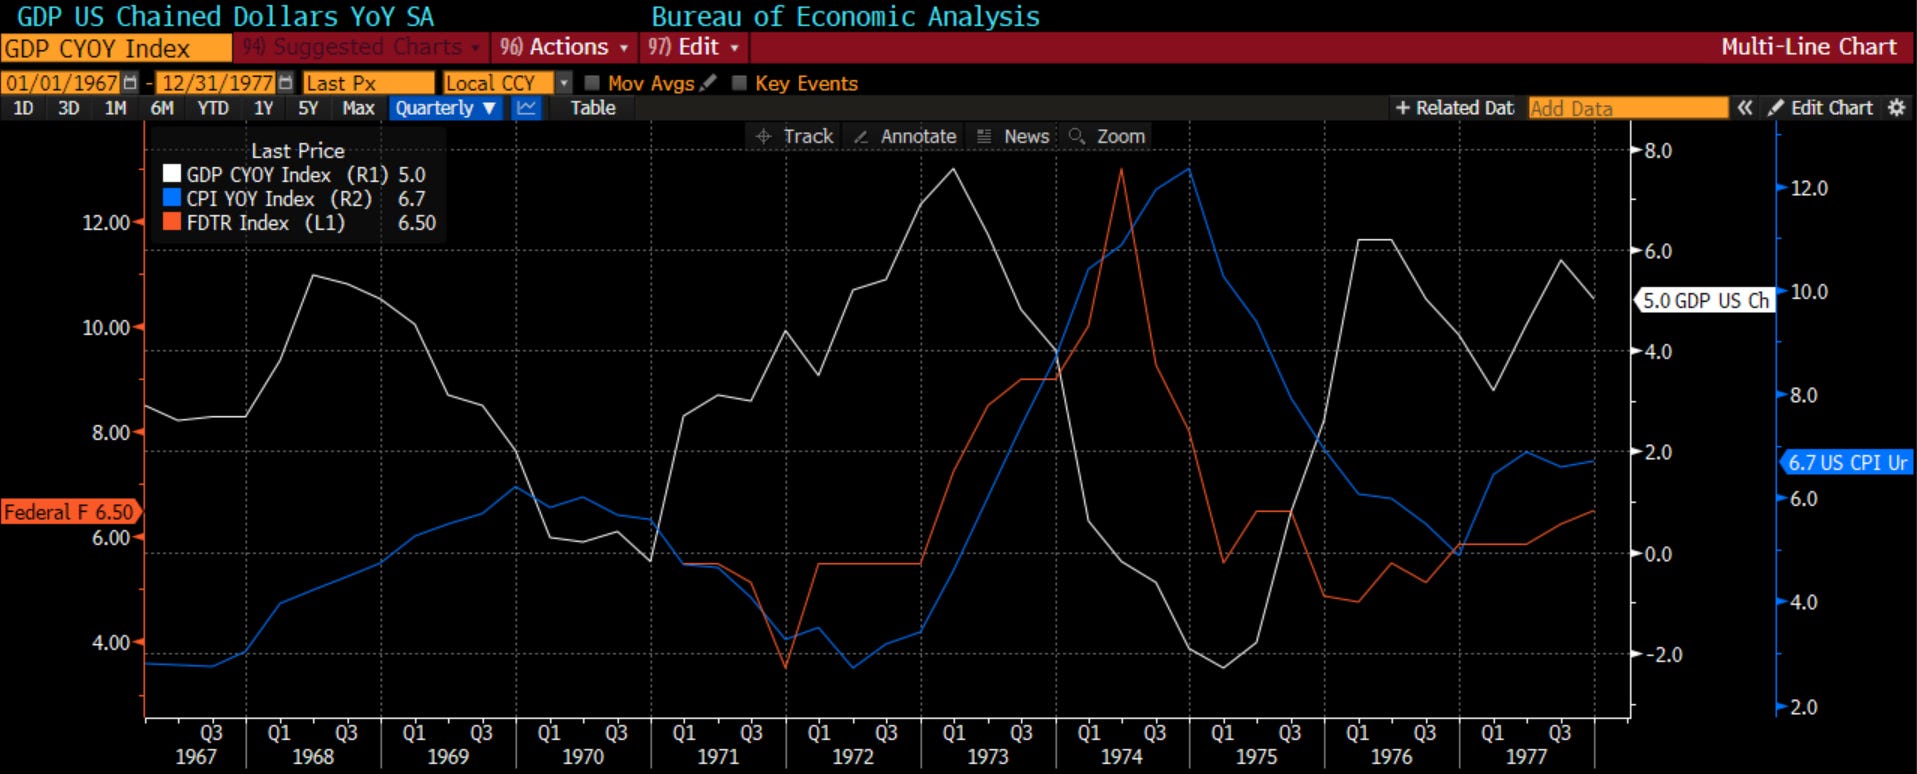
Those who advocate for this scenario see the expansionary fiscal policy we have witnessed by both parties over the last 5 years as being akin to the “Great Society” guns and butter program of Lyndon Baines Johnson. The other similarities have included plenty of social protests on a range of issues, much like the late 60s and early 70s. Back then, the US was involved in the Viet Nam War and now the US is involved in multiple proxy wars. In addition, the 60s saw rising wages and inflationary pressures as wages didn’t quite keep up with price levels. William McChesney Martin, the central bank chair of the time, was criticized for running policy that was too accommodative, with the concern being political pressure and a fear of slowing growth. Any of this sound familiar? As CPI fell from 1970 into 1972, the Fed saw the chance to ease policy, even though the inflationary consumer mindset had not been squelched. Arthur Burns had taken over in 1970 and he faced the same mounting political pressure particularly in the run-up to the 1972 election. Nixon took the US off the gold standard in 1971. The Fed had to wake up and fight inflation that rose from 3% in 1972 to 12% by the end of 1974. Fed Funds went from 3.5% to 13% slow inflation which brought GDP down from 8% to -2% in real terms.
That move by the Fed to regain control of inflation, which it thought it had extinguished, crushed the economy and the stock market. In 1973, stocks fell 48% as the GDP fell from the aforementioned 8% to -2%.

This overlay may suggest the aggressive fiscal expansion can carry growth into next year, but at some point, there will be a price to pay, with growing collapsing under its own weight as private investment is squeezed out.

This overlay also suggests that as inflation re-accelerates in 2025, as it did in 1972 with a too easy Fed and expansionary fiscal policy, the Fed will have to reverse course and potentially even be more aggressive. This would not bode well for the stock market as we saw in the 1970s. The Fed not respecting that inflation is as much a mindset as it is a number, and refusing to listen to workers across the country who tell them inflation is a problem, is the tell-tale sign why many believe in this scenario.

Scenario 3: 2007 overlay with quant meltdown vs. Yen de-risking
While many readers probably do not recall either of those periods (for what it is worth, I was born in 1968, so I don’t remember the second one either!), most may recall the Great Financial Crisis in 2008. What many people don’t remember is that in August 2007, we got an early warning of the excessive misallocation of investment dollars that had happened. That month was known as the quant meltdown. Quant strategies, which had just started to gain significance, all largely below up, causing massive dislocation in the markets. Market neutral quant funds were down 7-8% on the month which was unconscionable. I recall this well as our fundamental market neutral fund had one of its best months ever in the midst of the meltdown. These quant funds had pushed the relative valuation of stocks to extreme levels and fundamental investors were feeling a good amount of pain. As the funds blew up, not only did returns pop right back up but investors wanted to pull from quants and move back into discretionary funds. I thought of this in August of this year as we had the great de-risking, which some blame on a Yen carry trade unwind, but even if it wasn’t, it was a Value-At-Risk based deleveraging of multi-strategy platforms and systematic investors. While prices in both Augusts snapped back, there was damage done and perhaps the canary in the coal mine didn’t survive.

Another move that was identical was that the FOMC cut rates in September of 2007 the same way it did in September of 2024. In both periods it cut by 50 bps. In both periods it was criticized for being too aggressive. Back in 2007, don’t forget the ECB had just famously raised rates in the summer, so the Fed cutting seemed to make no sense. Here in 2024, growth numbers are strong, stocks are at all-time highs and credit spreads are tight. However, perhaps in both periods, the Fed knew there was market stress beneath the surface via the outstanding recon done by the NY Fed. It cut in 2007 as it knew there were bigger problems in investment funds. You think that is happening now? I am on record as saying before the September FOMC, if the Fed cuts 50 bps, we should be scared because it may know something that we do not know.

The market started to sniff out these problems even before the end of 2007. The market was off in Q4 2007 before falling 40% in 2008. Right now, the market looks quite strong, hitting all-time highs. Perhaps there are no problems as the market might sniff it out. However, this overlay would suggest 2025 could be trouble if the August de-risking was a precursor of the extent of misallocated capital.

At the start of the year, I said the three scenarios I saw were: 1. The Fed cuts rates and there is a soft landing - good for stocks but this is solidly the consensus view 2. The Fed doesn’t cut rates because there is no landing with inflation re-accelerating 3. The Fed cuts rates because we are about to go into a recession. Right now, scenario 1 clearly is playing out in real-time.
However, perhaps consider the three overlay scenarios now as we looking into 2025. The first is the same continuation of a soft landing, more rate cuts, and earnings picking up. These are bull market conditions. If this is the case, we may only be in the 4th or 5th inning of the move higher in stocks.
Consider the other scenarios, though. The first is where the combination of an inflationary mindset that has embedded in consumer opinion and a rapidly expanding fiscal deficit, combine to re-ignite inflation. This is all fueled by a Fed facing political pressure and thus is too accommodative. This will bring the Fed back into play perhaps even more so than before ultimately crushing the economy and stocks.
The final scenario is one in which the Fed cuts rates more aggressively but perhaps it is because it has some awareness that the investment community, either at home or abroad (and remember, there are many global investors in US assets, so it does matter), has trapped misallocated capital. This presents a risk to the global financial system and the Fed would want to ease to forestall any problems.
Overlays and analogues are never perfect. However, they do present a model of how we might want to think about what could happen going forward. There is more than one outcome that could occur and so as portfolio managers, we want to assess the probabilities of each.
As George W. Bush would say, “Fool me once, shame on you. Fool me - you can’t get fooled again”
Stay Vigilant

That final scenario about potentially trapped misallocated capital is very intriguing, Richard.