Happy New Year!
It's a new year - are the markets like all of us in saying this year will be different?


Welcome back to a new year of Stay Vigilant. After a great time off and a relaxing vacation, I am sure I am not the only one that is suggesting they need to eat better, exercise more, turn over a new leaf in the new year. That is a time-honored tradition, after all. Have a little too much fun in the holiday season and then work to get back to normal.
In the financial markets, it is very much the same. While the Santa Rally did not really materialize, at least not for the stocks outside of the Mag 7 and some other fringe names, the start of the new year is the time to think about what are the major trends that are going to impact the investing year. One has to start with new Trump Administration and the conflicting ideas that spending (on Greenland?), extension of tax cuts and tariffs will be inflationary, while deregulation and DOGE will be deflationary. No one knows what will be prioritized and how long it will take, but that is the pendulum on which markets will swing, at least in the first 100 days of the Administration.
While I was on the beach in Hawaii, I had a think about this and wrote about what this could mean for 10 year yields and what the trade might be early in the year. I wrote about this for the CME Group in my bi-weekly Excell with Options:
About 10 days later, I finally got back to my desk and started to look at what had been happening in the data and the markets. This was my second post of the new year on LinkedIn. In the first, I focused like many on the headline ISM and the new orders to inventory ratio. You all know I care about these, and they painted a good picture for growth in the new year. The next day, I thought I needed to consider the ISM price data too:
Chart of the Day - the story for 2025?
Yesterday I looked at the ISM number which clearly is giving some positive indications for the US economy and potentially the US stock market as well
However, as I mentioned, there was one piece of information in the ISM report that was potentially a bit more troubling - ISM Prices Paid
This data also came out higher than expected. Why does this matter, you say? Isn't inflation gently falling back to the Fed's target? Isn't that what we hear?
Look at the chart today. ISM prices paid is in white. PCE (Fed's preferred measure of inflation) in blue. US 10 yr yields in orange. Which leads which?
Prices paid leads everything. The first place we will feel inflation pressures is in the supply chain and the purchasing managers at companies will feel it & let us know
Then, that starts to get passed along and consumers will feel it in their personal consumptions. The competitive landscape dictates the pace & magnitude of the amount this gets passed along, but when it is strong enough, it will
The bond market is less focused on the month to month noise in inflation data and more focused on the longer term trends that impact inflation expectations and consumer behavior
Prices paid have been rising for over a year now. PCE is starting to turn the corner. The bond market is starting to sense this and yields have turned higher
The US 10yr yield underpins the pricing of all other assets in financial markets. If this yield keeps heading higher, how will assets be affected? Will stocks stay supported? Will corporate credit spreads be able to stay tight? Will mortgages & US housing be impacted?
Still too early to tell, but the trend is something to keep an eye on for sure. I sense that many are complacent on the risk of a re-ignition of inflation in 2025

Inflation. This was definitely a focus for me in 2022 and 2023. It started to move the right way in 2024 and this was a big reason why we had such a strong year in the markets, and why the FOMC cut rates. However, I do think we are in a new paradigm for inflation and what we saw in 2022 and 2023 is just the start, which is why I am equally as worried about the ISM price as I am excited about new orders to inventory. Ultimately, inflation matters because it will impact the 10-year yields, and as we know, the 10-year yields impact everything, which is what I wrote about on Wednesday on LinkedIn:
Chart of the Day - reconnect?
In yesterday's post I mentioned that I thought the direction of inflation this year would be the story of the 2025 as it has a strong potential to put upward pressure on yields
I mentioned the US 10yr Treasury has influence on all asset markets. Today I want to look at the influence on just two of them - corporate bonds & stocks
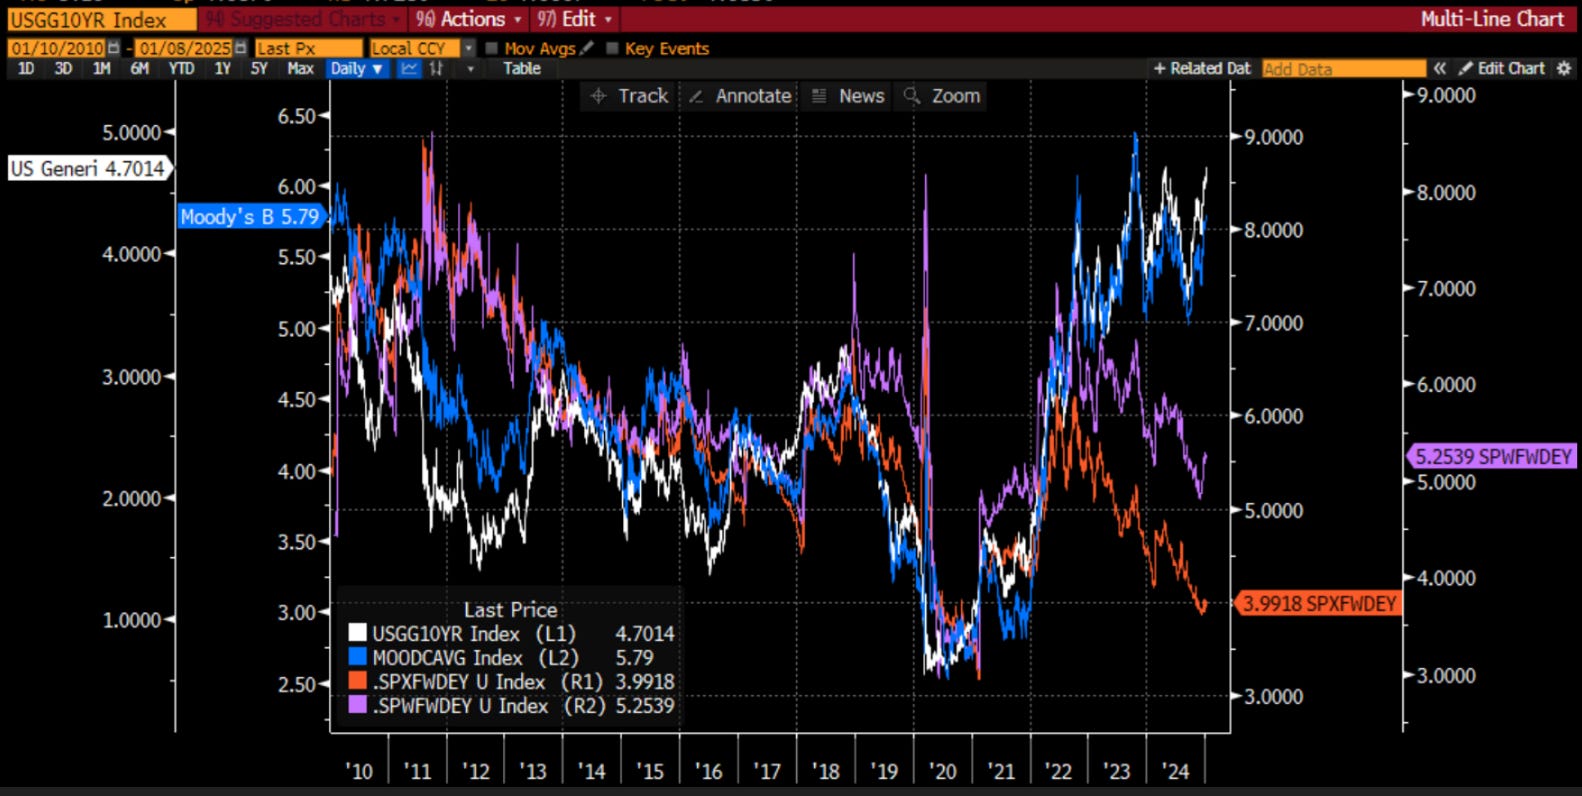
The four lines below are the 10 yr US Treasury yield (white), Moody's corporate bond yield average (blue), S&P 500 forward earnings yield (orange) & equal weighted S&P 500 forward earnings yield (purple)
All of these lines should roughly connect with each other because the corporate bond yield and the equity earnings yield (inverse of P/E) are priced off the risk-free rate. That is, until recently
Over the last 15 years, the corporate bond yield & the Treasury yield have tracked very well, at least from a co-movement perspective if not a correlation perspective
Even with that strong co-movement, the corporate bond spread is tighter now than at any time the last 15 years. The spread between the two yields is 116 basis points vs. 190 basis points avg over 15 years, almost 2 standard deviations from the mean. Thus, corporate bond investors are feeling exuberant
However, their exuberance pales in comparison to equity investors. You can see the obvious disconnect in these yields. The knee-jerk reaction may be that this is due to the 5-10 largest names impacting the index, however I include both the market cap weighted index and the equal weighted index
Both are disconnected and have been since the beginning of 2023, when growth surprised to the upside. It is now expected to continue to do so quite extensively. Can earnings growth continue at such high levels with yields starting to suppress it?
If you look closely at the purple line, you can see very recently the earnings yield moving higher, possibly indicating this yield will begin to follow other yields higher. We have not seen a similar such move in the market cap weighted index
If 10yr yields continue their march higher, we will see a move higher in earnings yield. This was the panic in late 2023 & early 2024. If yields stop at 5%, it won't be too bad. However, what if yields don't stop at 5%?
Inflation, yields & the impact on other assets. This will again be the story of 2025
Of course we care about financial markets, but these markets are just a reflection of the real economy. What is the impact on the real economy of the 10-year US Treasury yields? That all comes down to the H.O.P.E. framework. In this, housing leads everything which drives orders, then profits and finally employment. What could a move in yields mean for housing? As I wrote on LinkedIn:
Chart of the Day - 10yr & housing
With financial markets closed today in remembrance of Pres. Carter, I thought I would pivot to the real economy & how the US Treasury yield may impact it
I think many understand that their mortgage rate is tied, in some way, to US bond yields. I think too many people probably think it is tied to some yield the Federal Reserve sets. I think some of these think the Fed sets long term yields
The Fed actually sets short-term yields. The market itself sets long-term yields like the 10yr. The market will consider the future path of short term yields set by the Fed in its forecast. It will also consider other metrics such as inflation expectations & term premium (the extra amount one wants to be paid to hold bonds long term)
The term premium has been the biggest (not the only) driver of 10yr yields of late. The concern of continued excess govt spending & a skepticism that the govt will be able to cut spending feed into this
This is important because then it is the entire govt, and not just the Fed, that is impacting the 10yr yield. It is the entire govt (and maybe even what is happening abroad), impacting the 10yr yield & therefore the mortgage rate
Mortgages trade at a spread to Treasuries. This spread historically has been a bit under 2%. It widened in 2023 to almost 3.5% when the Fed was more active in QT & disrupting liquidity in the Mortgage Backed Securities mkt. It has been falling back to long-term avg but is still elevated at 2.65%
The other line you see on this chart is the inverse of the Natl Assn of Home Builders real estate index. You can see that as mortgage rates rise, housing activity slows down & as mortgage rates fall, housing activity picks up
It isn't perfect because the unemployment rate also plays a part. After all, if rates are 0% but you don't have a job, you won't buy a house
Housing leads the economy into and out of recessions. Housing has a high multiplier effect. If housing is doing well, the entire economy is doing well. The opposite is also true
With 10yr yields headed higher, mortgage rates are headed higher. We will hear about jobs tomorrow, but this puts pressure on housing activity. This will slow the economy potentially. A slowing economy will slow earnings
You can see how the impacts from the 10yr, this time on the real economy, will feed thru into everything we care about, not just housing, but also our investments

The importance of the 10-year yield is not lost on anyone. Bob Elliott is a good follow on Twitter, not just for the content he creates, but also for the discussion he can create. This weekend, Bob asked the question basically if we have seen the move in the bonds already, and they are a buy here, or if the move lower in bonds/higher in yields is the start of something bigger. He got over 10k votes and it looks pretty even at this point. He asked those that said No, of which I was one, at would level they would buy. The consensus of those seemed to be something in excess of 5%, with many pointing to more like 5.5%

Stepping back, then, we really need to consider what the move in the 10-year yields could look like. A lot of tweets asking if bonds are a buy here don’t ask the important follow-up question ‘what is your time horizon’? Are we talking about a trade, or a buy and hold for the next 10 years? This most likely colors your impression. I tried to address this by looking at a quarterly chart of yields and the long-term bull markets in bonds that may be coming to a close:
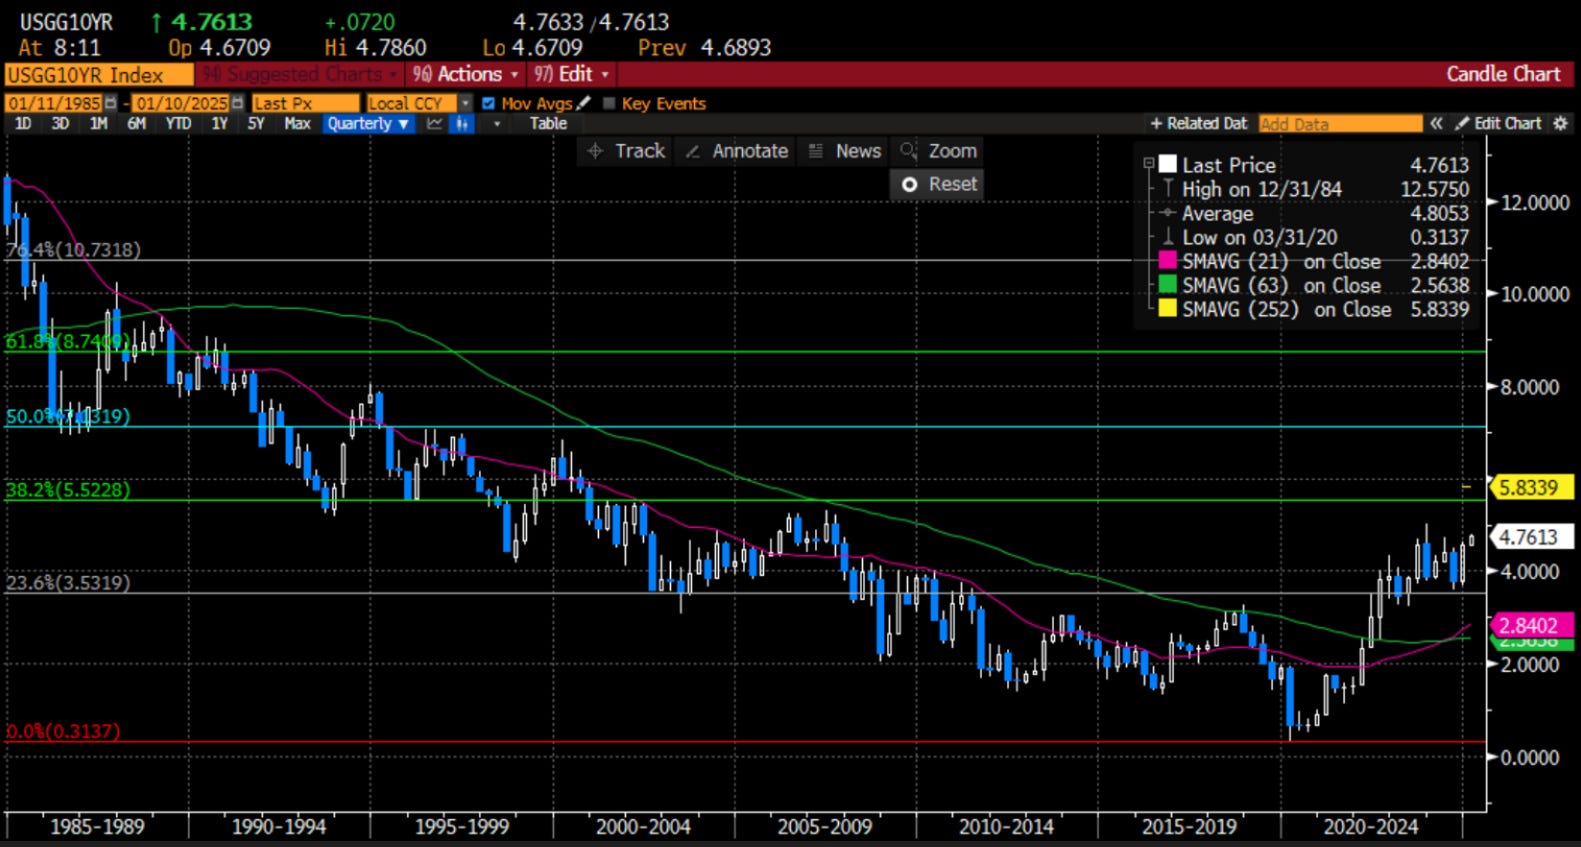
Chart of the day - 40-year bull market
It would be interesting if we look back in maybe 5-10 years and say 'that post Covid period was definitely the end of the 40-year bull market'
I am not talking about stocks, though these would surely be affected. I am referring to the bond market. You see, from 1985 until 2022, bonds were in a very strong bull market
The bond vigilantes in the 80s had forced the hand of the govt & the central bank. It started with Volcker breaking the back of inflation, It culminated with Bob Rubin/Bill Clinton finally bringing the govt to balance. This created the bull market that has characterized most everyone's investing career
However, that all changed in 2022. Inflation like we had not seen since the 80s, driven by aggressive monetary & fiscal policy that we had not see since WWII, signaled and end to this bond bull market
the chart today shows the bond yield, the inverse of price, because this is how most people think about bonds i.e. in terms of the yield it pays not the price that paid. Thus this would say 'the end of the bear market in yields' just that's not how we characterize it
If you took the labels off and thought of this as a stock, you would say something changed in 2022, the narrative changed and the direction has shifted. The same is true here
You see, the market narrative for those 40 years was growth. Volcker broke inflation so we were in a period of disinflation the entire time with bouts of inflation here or there. In periods of growth, stocks & bonds are negatively correlated
This is important. When we worry about growth, higher growth is bad for bonds but good for stocks. Lower growth is good for bonds (rate cuts) but bad for stocks (earnings). Risk parity & the 60-40 portfolio developed on this premise
When we worry about inflation, as we are again right now, stocks & bonds are positively correlated. Good news on growth, like the jobs today, is bad because it means inflation which will hurt margins (bad for stocks) and lead to rate hikes or at least no rate cuts (bad for bonds)
Now, this is a quarterly chart over 40 years so it will take a while to play out. However, the 38.2% retracement of that bond rally from 1985 to 2022 is 5.52% in the 10yr. That is not out of the question even this year
In 10 years, it suggests we could be at 7% again. Many will scoff at that. They will point to demographics, debt & disruption
However, the demographics are offset by immigration. The debt is deemed to no longer be sustainable & the disruption (AI) has yet to lead to the promised productivity gains
Last point, on debt. The US has too much debt. We won't default, we don't have the will to restructure. We can't grow out of it. This means the only way out is to inflate. Japan sees this now. US politicians see this as well. DOGE to the rescue?
I reference the risk parity and 60-40 portfolios above. This is a chart that I think highlights what I am talking about. Is the market focused on growth, a time when equities and bonds are negatively correlated, or are we focused on inflation, a time like 2022 when these assets are negatively correlated. This is EXTREMELY important, because if the focus turns back to inflation, many portfolios are not built correctly.

The last question we need to consider, then, is ‘who is buying these bonds’? In this chart, we can see that the supply of bonds has gone up considerably the last two years. This is at a time when the Federal Reserve holdings in light blue are coming lower. Foreign holdings in orange are roughly flat. The biggest buyers of US debt right now are the so-called ‘Other Holders’ which is essentially US retirees. We can say that this would also include US financial institutions, however, after the SIVB bank crisis in early 2023, this number has declined if anything. The holdings of US bonds outright, and importantly in target-date funds which increase systematically, has soaked up the additional US supply. Where do US retirees want to own US debt? I think the Bob Elliott post with a lot of ‘>5%’ answers, is instructive.

The last word. A new Administration which appears to be going out of its way to stir up some angst among our major trading partners, which have historically been big owners of US bonds. Even before Trump takes office, we can see that China and Japan have been reducing holdings. The UK holdings have gone up, but that is likely because of the unfolding Gilt crisis. It doesn’t look like these price insensitive buyers are looking to load up on US bonds, which means the price sensitive US retirees could set the price. This, at a time when the US has to sell $7 trillion of bonds this year.

Inflation and US yield → definitely the story of 2025. New year, new theme. It won’t be about Fed cuts and higher stocks. It will be about how high bond yields go, and how much the disruption from higher yields can be contained.
Stay Vigilant