For Chicagoans growing up in the 70s-80s, there were a few iconic TV ads that we all remember. In fact, for a lot of Cubs fans nationwide, watching on WGN TV, they probably remember them as well: Empire Carpet, Aronson Furniture, Victory Auto Wreckers. One of the other famous ones came to mind as I was reading the news this week - Celozzi-Ettleson Chevrolet. Two guys with thick Chicago accents and fists full of dollars hawking their cars. They bragged they were the #1 Chevy dealer in the country. They had a couple of taglines too. “Where you always save more money” and “Hard to find, tough to beat”.
It was the latter phrase that came to mind as I was reading through the earnings summaries this week. Hard to find, tough to beat. Hard to find was the consistent earnings growth S&P 500 investors have been getting the last couple of years. Tough to beat because for those with reasons to think stocks are overvalued, see stocks go to all-time highs once again because of better-than-expected earnings.
Here is a summary of US earnings from FactSet:
According to FactSet's latest Earnings Insight report, the blended earnings growth rate for Q4 S&P 500 EPS currently stands at 16.9%. This compares to the 11.9% expected at the end of the quarter. The blended revenue growth rate is 5.2%. Of the 77% of S&P 500 companies that have reported for Q4, 76% have beaten consensus EPS expectations, just below the 77% one-year and five-year averages of 77%. In addition, 62% have surpassed consensus sales expectations, level with the 62% one-year average but below the five-year average of 69%. In aggregate, companies are reporting earnings that are 7.3% above expectations, better than the 4.9% one-year average positive surprise rate but below the five-year average of 8.5%. In aggregate, companies are reporting sales that are 0.8% above expectations, below the 1.0% one-year positive surprise rate and the five-year average of 2.1%.
Bloomberg shows the earnings and sales surprises by sector, and you can see it is somewhat widespread. However, in the lower right, we also see that some sectors are responding with negative price action in spite of the beats, particularly Tech and Health Care:
Some other insights via FactSet show that stock prices are out-pacing earnings over the last 10 years:
Which means valuation has gone higher:
Valuation: The forward 12-month P/E ratio for the S&P 500 is 22.2. This P/E ratio is above the 5-year average (19.8) and above the 10-year average (18.3).
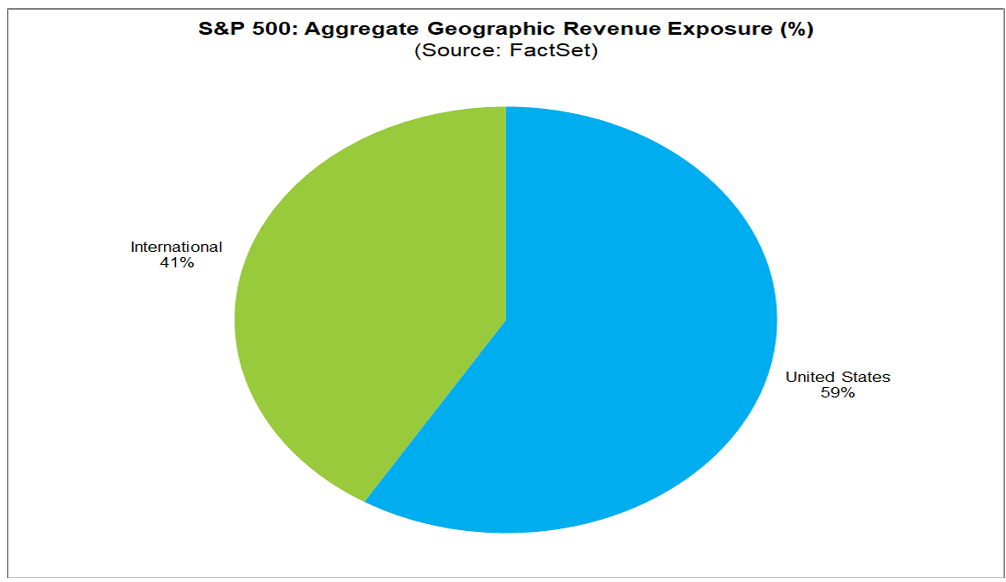
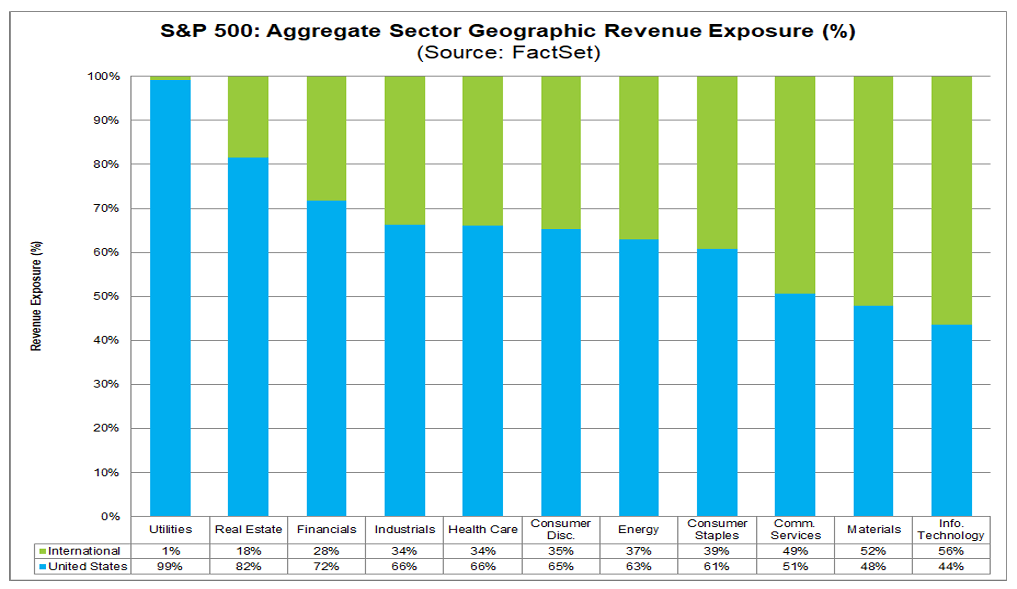
These valuation risks are quite real especially with the potential risks to global trade. After all, 40% of S&P 500 earnings come from abroad:
The sectors that are most at risk are some of the previous leaders like Tech and Communication Services:
While the ‘domestic’ sectors like Financials have moved up in the performance tables, we are still not seeing investor rotation based on a fear or concern that global trade may be disrupted. This chart may be a little skewed by META, which according to an email thread I was on, has been up a record 19 days in a row
The 76% positive earnings surprise still is impressive even while companies and Wall Street analysts continue to play the game. It is interesting to note how these surprises disconnected from the economy back in early 2023. Will the economy catch up to the earnings surprises now or will US economic strength push these surprises to new highs?
Or perhaps investors are looking through this year (2025) because of all of the noise and are more focused on 2026 numbers. As we see, 2025 estimates have rolled over and moved lower even as 2026 numbers march higher. On 2026 numbers, the SPX P/E does not seem nearly as onerous. However, that seems to be a bit of a dangerous game, looking through this year.
Many people I read seem to think that Trump is not serious about tariffs. After all, he kept the Canada and Mexico tariffs in place for less than 24 hours. The reaction to the latest headlines on China, steel and aluminum and now reciprocal tariffs, seems to be that these are all just negotiating ploys, and they will be rolled back when Trump gets what he really wants. I don’t agree with that. I find myself leaning more to the view of Andy Lapierre, a long-time DC analyst, who sees Trump following through on tariffs. The reciprocal tariffs may be Trump’s answer to the flat rate suggested on the campaign trail. While this is much more difficult to implement, this is an idea that could gain traction.
If tariffs do gain traction, is that negative for the Dollar? We definitely saw trade frictions in Trump’s first term take the bid out of the Dollar. At the very least it could mean fewer Dollars that are trade partners have to recirculate into US assets. The Dollar trend for the last 15 years has been very supportive of the SPX outperformance of EM and DM stocks overseas. Like I posited last week, could this be turning?
I wrote a lot about gold this week on LinkedIn. The World Gold Council highlights the biggest buyers of gold the last 5 years have been Russia, China, India, Turkey and Poland. The first 4 at least may be looking to do this as a replacement for the Dollar as they are members of the BRICs alliance. When the US seized Russian assets after the invasion of Ukraine, sentiment certainly changed. This has definitely put a bid into Gold which is now trading at all-time highs. I will have more on gold next week when I share a podcast I just did with Mike McGlone, the commodity strategist at Bloomberg Intelligence. Mike touches on the topic and I think many would be surprised to know that since early 2022, gold has outperformed the SPX.
In fact, it is interesting to me that many people deride gold bugs for being tinfoil hat wearing conspiracy theorists. Well, some of them are for sure. However, everyone who says buy and hold stocks and forget about assets like gold might want to look at a longer-term performance chart. Over the last 25 years, gold has blown away the performance of the SPX, Nasdaq and Global Aggregate bonds. Sure, you can argue that picking 2000 as the start date is cherry-picking because that was near the top of a bubble. If I pick 2010 as a start date, near the trough after the GFC, stocks have done much better than gold. The relevant start date depends on everyone’s own investing horizon. I just want to point out that there are possible alternatives in investors’ minds. Do you think most investors think 2025 is more like 2000 or 2010?
Which brings into mind the SPX to Gold ratio. I like to look at a lot of assets in gold terms to take out the FX effects. Right now, the SPX to Gold has been hanging around 2 to 1. Keep an eye on this for long-term signals of direction.
I want to leave you with one last piece. I wrote about inflation on LinkedIn this week as I saw investors shake off the higher-than-expected PPI, choosing to focus on the parts of PPI that go into PCE and see the positive in the data. This gives some insights into investor psychology imho. Anyway, I also think the comparison of the present vs. the 60s/70s is pertinent for a few reasons.
Chart of the Day - That 70s Show
Before class yesterday, I had a discussion with a couple of students regarding one's choice of facial hair. He was rocking a new mustache, and I suggested that particular style was certainly popular in the 70s
Tying it into class, of course, I pointed out that also like the 70s, we are seeing persistent inflation and potentially may even see stagflation, which my classes' economic models have been predicting
This week we got CPI and PPI numbers that were quite hot. Of course, the market, wanting to go higher, also noticed a couple components within the PPI that feed into PCE that were lower. Thus the "Fed's preferred measure" of inflation will likely be lower, allowing the Fed to continue to ease
Thus, we immediately get higher prices since the stock market is keenly focused on the Fed
The problem is, an easy Fed (look at financial conditions, consider the Taylor rule) actually will create more problems than good. It was exactly an easy Fed and stimulative fiscal policy that led to the 1970s inflation
Let's think of the 1960's fiscal situation. We had the Great Society programs and spending on the Viet Nam War. In the last 5 years, we have had Covid but also extensive Green New Deal like programs. Pro-cyclical fiscal deficits. We have also funded other countries wars
How did the central bank respond in the 1960s? The Fed pursued loose monetary policy of low interest rates & did not act to counter fiscal expansion. Money supply grew rapidly
Has Jay Powell done anything differently? Sure, he raised rates but not as soon & not as much we many hoped. Now it is clear he wants to lower them, stopping now maybe because of tariff uncertainty or maybe just to tweak the President & assert independence
Those policies in the 60s led to the ultimate breakdown of the gold standard & the Bretton Woods system. Ironically, now we are seeing a move back toward some sort of gold standard it seems
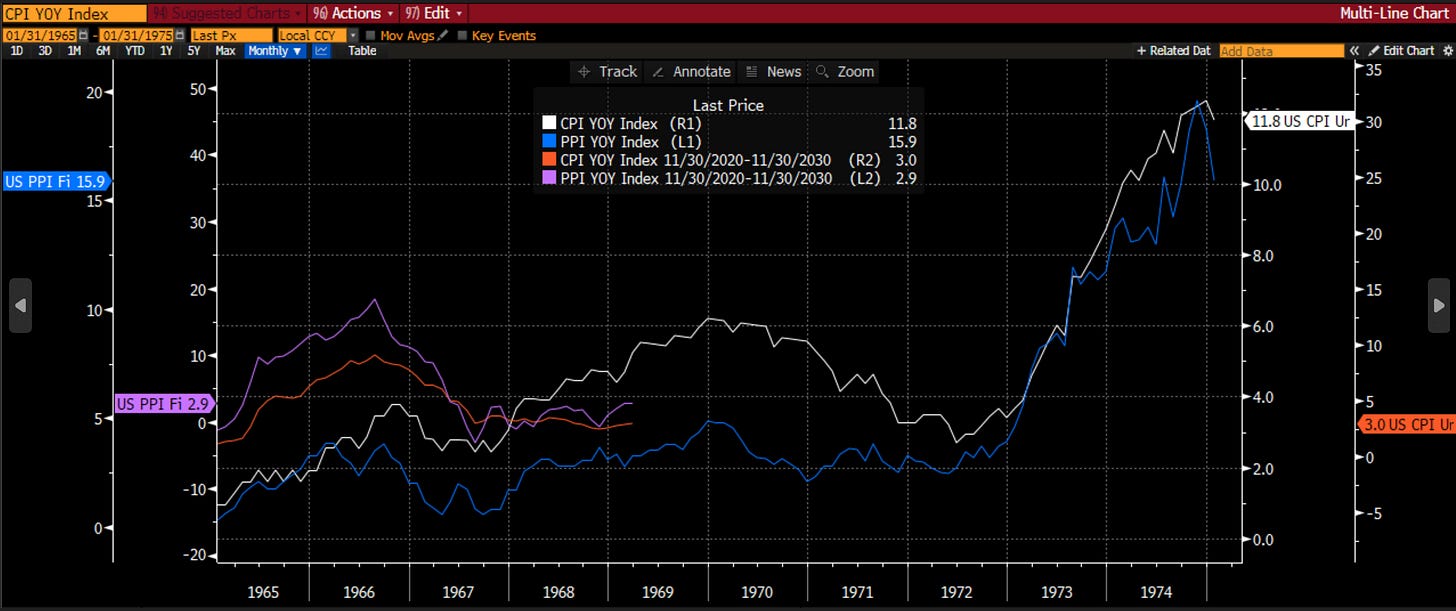
The chart today shows CPI & PPI from 1965-1975. I have overlayed both from 2020 until now. We can see the first spike, then a pause that gets the central bank to think it is winning, and then another spike and finally the blow off top
If we aren't careful, this inflation could have several more rounds of spikes ahead of us. This seems to be what consumers are fearing in looking at inflation expectations
Sure, we can point to DOGE potentially reduce fiscal spend. However, we see a lot of pushback across the aisle & from the judiciary. On the flip side, re-aligning the global trade system sounds inflationary near term the same way the energy transition sounded inflationary
I fear a return to the 70s. I fear I may be looking at many more mustaches in the audience
Of course, it might not just be the mustaches that come back. Maybe we could get some of those iconic commercials to come back as well.
Stay Vigilant


Thanks for going down memory lane for the time in the 1980s that I lived in Chi-Chi. One of the interesting things about the 70s show that is worth noting is that early life experiences impact central bankers reaction function. For example, Arthur Burns formative macroevent was the 1929 crash/Great Depression. It must have haunted him, so that at the first sign of economic weakness he would have priortized growth, aka ill advised rate cuts. For our generation, and Powells, the inflation shock/Volcker response is our formative event of the era, so it is my guess if the Powell ends up making a mistake its on the growth side, however, I do love the 1970s analogue charts and use them every chance I get.
Hi Richard…could you please elaborate on why higher tariffs are bearish for the US$? I would think that tariffs need to be paid in $ and should be bullish for the US$. Looking forward to your podcast on Gold. Thanks.