


Hijinks
The last week was full of stories and price moves we may be talking about for a while


We knew this week would be full of news. However, I don’t think too many people could have predicted all of the headlines we ended up seeing. Let’s start with what we were expecting i.e. the CPI & PPI data.

It started with the PPI coming in better than expected on a month over month and year over year basis. The yoy final demand at 3.3% vs. 3.5% was the big surprise. Skeptics may note that even though the 3.3% was clearly much better than expected, the 3.3% number is the highest we have seen since Feb/March of 2023. PPI has in fact been trending higher for 18 months so it may be a little soon to declare victory. The CPI number was in line at 2.9% but the ex-food & energy was 0.1% better. Again, probably way too soon to declare victory on inflation, particularly as 2.9% is well above the 2% target. However, for a bond market that was under siege for several months, this was seen as a bit of a relief and we see a massive rally. In fact, maybe too massive? This is what I wrote on LinkedIn:

Chart of the Day - overreaction?
Yesterday the market received the news it clearly wanted to get - an inline CPI number. What?! Inline? Yep, the headline index was just inline. Sure, ex Food and Energy it was 0.1% better and since no one buys food and energy, this is good news (;-))
However, given 10-year yields fell by 15bps, leading to a 1.5%+ move in equity markets, it was pretty clear that inflation concerns were top of mind for investors
I'd seen some tweets in the past week wondering why yields had risen. Was it inflation? Was it rate cut expectations? Was it tariffs? Was it China selling bonds?
I've shown before that in the 115 bp move from September to early this week in 10 year yields, we could explain this by changing long run inflation expectations of 25 bps and changing term premia of 85 bps with impact from terminal rates lumped in too
Well, after this CPI number yesterday, long run inflation expectations came down by 3 bps. You read that right
We got a 15 bps move in yields because of inflation, even though long run expectations only moved marginally lower. Term premia didn't move
Maybe there is scope for more rate cuts. Now we have a full cut priced in by July whereas before it was not priced in until October
However, the 15 bps moves seems like an overreaction. Sure, traders were getting pretty 'beared' up on bonds. TLT outflows had been enormous. Many were looking to find the level to buy the dip
That is a lot of what we are seeing. What do I see? Not that it matters, but I am not sure I see that a lot has changed from one day to the next. Am I biased because I think inflation will go higher, yields will go higher and was expecting CPI to be higher? Absolutely
However, while i grant you the CPI data was better, was it 15 bps in 10yr better? Are the issues of who will buy $7trillion of bonds, what will tariffs look like and how much can DOGE really get done still with us? I think so
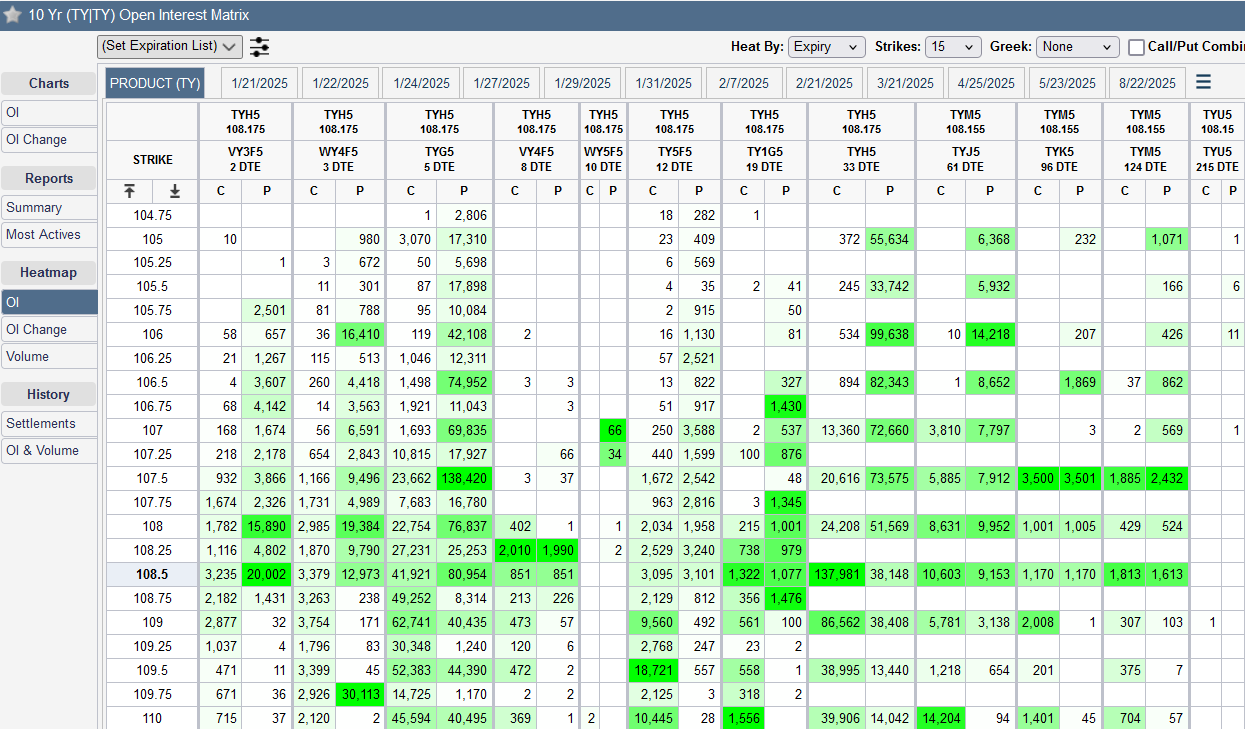
Perhaps somewhat explaining the magnitude of the move is the open interest in the options market where the TY bond futures saw a massive buyer of 108.50 calls with a like amount of low delta calls being bought in short-dated TLT options. Given leveraged money was very short futures into the print, perhaps this was just a hedge. Maybe this was someone who ‘had a feeling’. More likely this was someone on Capitol Hill with eyes on the report since the insider trading in DC has gotten so egregious. Either way, sell-siders were short gamma to the upside in bonds. Thus, the move higher in bonds/lower in yields, put the market-makers in a position where they had to keep buying deltas to cover their risk, which pushed prices higher, and led to more buying. This is the nature of being a market-maker. Having done it for 10 years, I can tell you it is more rewarding than not, however, there are times like this, when you get run over, that there is nothing for you to do but try to reduce the loss and live to fight another day. My sense is the magnitude of the move, the overreaction as I called it, had a lot more to do with short gamma and buying deltas against it, than it had to do with the interpretation of an inline number. In fact the month over month, ex-food and energy CPI of 0.2% was actually 0.23% so if it was even .02% higher, it would have rounded to 0.3%. Would the excitement been as much? Fact is, while the market is clearly celebrating this number, I think it is too early to declare victory on inflation and a Fed that is back in rate-cutting mode.

We looked at the correlation of stocks and bonds last week. Here it is drawn in a different way. The rolling correlation of bonds and stocks is clearly positive. This has tremendous implications for portfolio construction as I have discussed. It is also important to note that the rolling 10 year returns to the Bloomberg Global bond aggregate is just 1%. Not 1% per annum. 1%. Thus, the bond holdings hedging the stocks has been a large drag. Of course, stocks have done well so most do not care as much. I will suggest that asset allocators, who use a Black-Litterman (or similar) mean-variance optimization approach to portfolio construction, and forecast the next 5 and 10 year returns to markets, will play a big part in this bond market. Will these investors see those low returns & forecast mean reversion? Or will these investors see the fiscal and monetary profligacy that has led to such poor returns & forecast the same unless some thing changes in governments around the world?

Either way, it is clear that the stock market is taking its cue from the bond market, and inflation is the key. That is the ‘tell’ we got from watching price action in both markets this week. Investors fear worse than expected inflation, thus even inline, can lead to big moves. I believe it is important to note that this is perhaps the number one fear for investors. It suggests to me that most have already bought into the idea that there will be no recession nor a problem with jobs this year.

Suffice to say, given this reaction not just in bonds but in risky assets, it is hard to argue that financial conditions are tight. In fact, that is what the Fed has been arguing, when they suggest rates are restrictive. If one is watching markets and not -the real economy, with stocks at all-time highs in the US, and Bitcoin retaking 100k, it is a tough argument to make to be honest. This chart is the Chicago Fed National Financial Conditions Index. It is created to have a mean of 0 and standard deviation of 1. We can see in 2008, it went to 3 standard deviations tight. We can see currently it is at 0.6 standard deviations easy, not as easy as 2014 or 2021, but about where it was in 2006 before the GFC. This is the Fed’s own data. Wonder what Jay Powell thinks of this.

Not sure if the FOMC in DC is speaking with the regional governors much (I am being facetious) but since November, the tone for small businesses has shifted massively. Clearly small business people are in favor of the change in DC as we see the NFIB small business optimism index back to levels we have not seen since 2019. It isn’t just that they are optimistic, it is that they feel they have better access to loans, will look to hire and have higher capex plans. Hiring and loans are not quite back to 2019 levels, but all are off the epic lows of 2022-2023. Even the real economy is feeling pretty good. Again, what does this mean for growth, inflation and Fed policy? I see this meaning growth will be good, inflation will still be a problem, and the Fed won’t be cutting. What do you think?

Speaking of the new administration and hijinks, late on Friday, Donald Trump issued a memecoin, suitably named Trump, and in 12 hours, this coin was up more than the SPX has been in its history. The chart above plots the market cap, but not that this is only 20% of the market cap because Trump still holds 80% of the market cap. That means since Friday on the close until Sunday a.m. the total market cap has gone from $0 to $62.5 billion. This means that Trump has $50bb in value in this coin right now. This is multiples more than he made in 60 years in real estate, and he was presumably a successful real estate investor. In tight or restrictive markets, do moves like this happen? This led me to find this headline on X:

Forget that in a day, this is a 2.5x trade for this ‘whale’. Why does either coin exist and why is the value of either one so large that we are now tracking what the major traders, or whales, in these coins are doing? You feel frustrated that someone can make more money in a month on Fartcoin and Trump coin than you have made in a decade of investing? I am sure there is a lot of FOMO going around. In fact, Portnoy said he bought $500k of Trump coin just because of what he called FOMOSC or fear of missing out on $hit coins. I have had other similar conversations and admit to feeling the same impulse myself. This is a very natural behavioral bias. That is what leads to these types of moves. Have they happened before? Absolutely. Think about pets.com and other .com era stocks that were just as worthless as these coins and went up just as much. Markets don’t change but cycles do. Again, these moves do not happen in markets where central bank rates are too high.
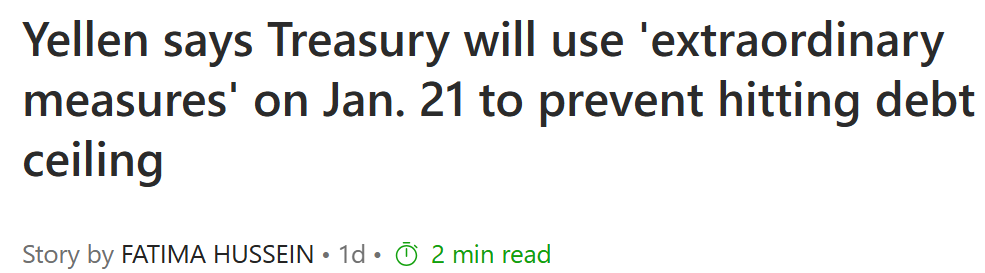
Forget about President Biden’s (or whoever is in charge - see Speaker Johnson comments) executive orders that do not even look Constitutional in the last few days. This headline also came out on Friday, and this is the type of thing that should have bond holders, and all risk-takers, a little nervous. Outgoing Treasury Secretary Yellen tells us the US has run out of money and has to take extraordinary measures to avoid a default. Yellen urged lawmakers to increase the debt ceiling. Trump wants to eliminate the debt ceiling. Incoming Treasury Secretary Bessent says if confirmed, the US will not default on its debt. Thus, there is probably no imminent concern that there is tragedy, but this clearly has put funding the debt at the top of priorities for the new Administration, above even extending the tax cuts, a similarly important issue especially for the aforementioned small businesses. The timing of this announcement and other announcements is just all part of the hijinks in DC and what is clearly not going to be a smooth transition. It isn’t just in the US that we are seeing these risk factors perk up.

Chart of the Day - the other side of the world
The last two weeks, I have spent a lot of time talking about US 10-year Treasuries because of their importance across a wide variety of assets and the economy overall
We got past the inflation data this week, and the Scott Bessent hearing went about as well as could be expected in the partisan kabuki theater that is nomination hearings. Thus, US bonds might find some stability in the short-term, though there is probably still upward pressure on rates
However, on the other side of the world they are having very different problems. In China, the concern is not high rates in the government bond, because at 1.65%, they are the lowest I can ever find
No, the problem in China is that the economy is imploding, regardless of what the govt & central bank are doing to stimulate it
The latest victim is China Vanke, a very large real estate developer. Its bonds imploded yesterday, falling from 82 to 52 fen to the yuan (cents to the dollar in layman terms). When a bond is trading at half, it is very much in distress mode
Vanke is one of the largest real estate developers in China. Real estate is important in every economy, but particularly so in China. Why? Because everyone has their savings in real estate since there is no social safety net. Thus, wealth mgmt products are tied to it etc
This is why the failure of China Evergrande in 2021 was such a big deal too. It was the largest real estate developer at the time. When it happened, I was on LinkedIn and podcasts saying it was China's Lehman moment. I was scoffed at
However, by mid 2022, China's nominal GDP fell to 0.4%. Remember when it was always double digits? Recall that the mandate is 7%? A fall of this magnitude, where the numbers are already skeptical, is way worse than in the West. This is why youth unemployment, even among college educated, is around 20% by most estimates
Well, now another major developer is imploding. China bond yields are going lower in an attempt to stimulate, but it may be too late. Richard Koo said China is having a balance sheet recession. He should know because he coined the term about Japan in the 90s
China IS the next Japan. Complete with a property crisis and demographic issue. It may be bounce around 0% GDP for decades. I know it sounds ludicrous. It sounded ludicrous to Japanese bond traders in the 90s. I know I was there
The trade of the century in the 90s was to short Japanese govt bonds at 2% then 1.5% then 1%. They went to 0%. It won't happen right away, but China is headed there
What does that mean for the West? Normally would be deflation as China dumps things on the West to try and revive its economy. However, the new Admin is not going to allow that. Reagan didn't allow Japan to dump when it faced its balance sheet recession. Trump taking a page out of that book
This is another major question for 2025
I want to end on some technical charts. With so many moving parts and headlines, it may be more useful to keep an eye on the technicals to sort through it all lest you get chopped up in the rumors and competing headlines. This is particularly important as the stock market is going to be focusing on earnings the next month as earnings season also kicked off last week. This is a time when the SPX usually gets more micro than macro, even though we have potential defaults, a new Administration and FOMC policy to worry about. It won’t be easy.
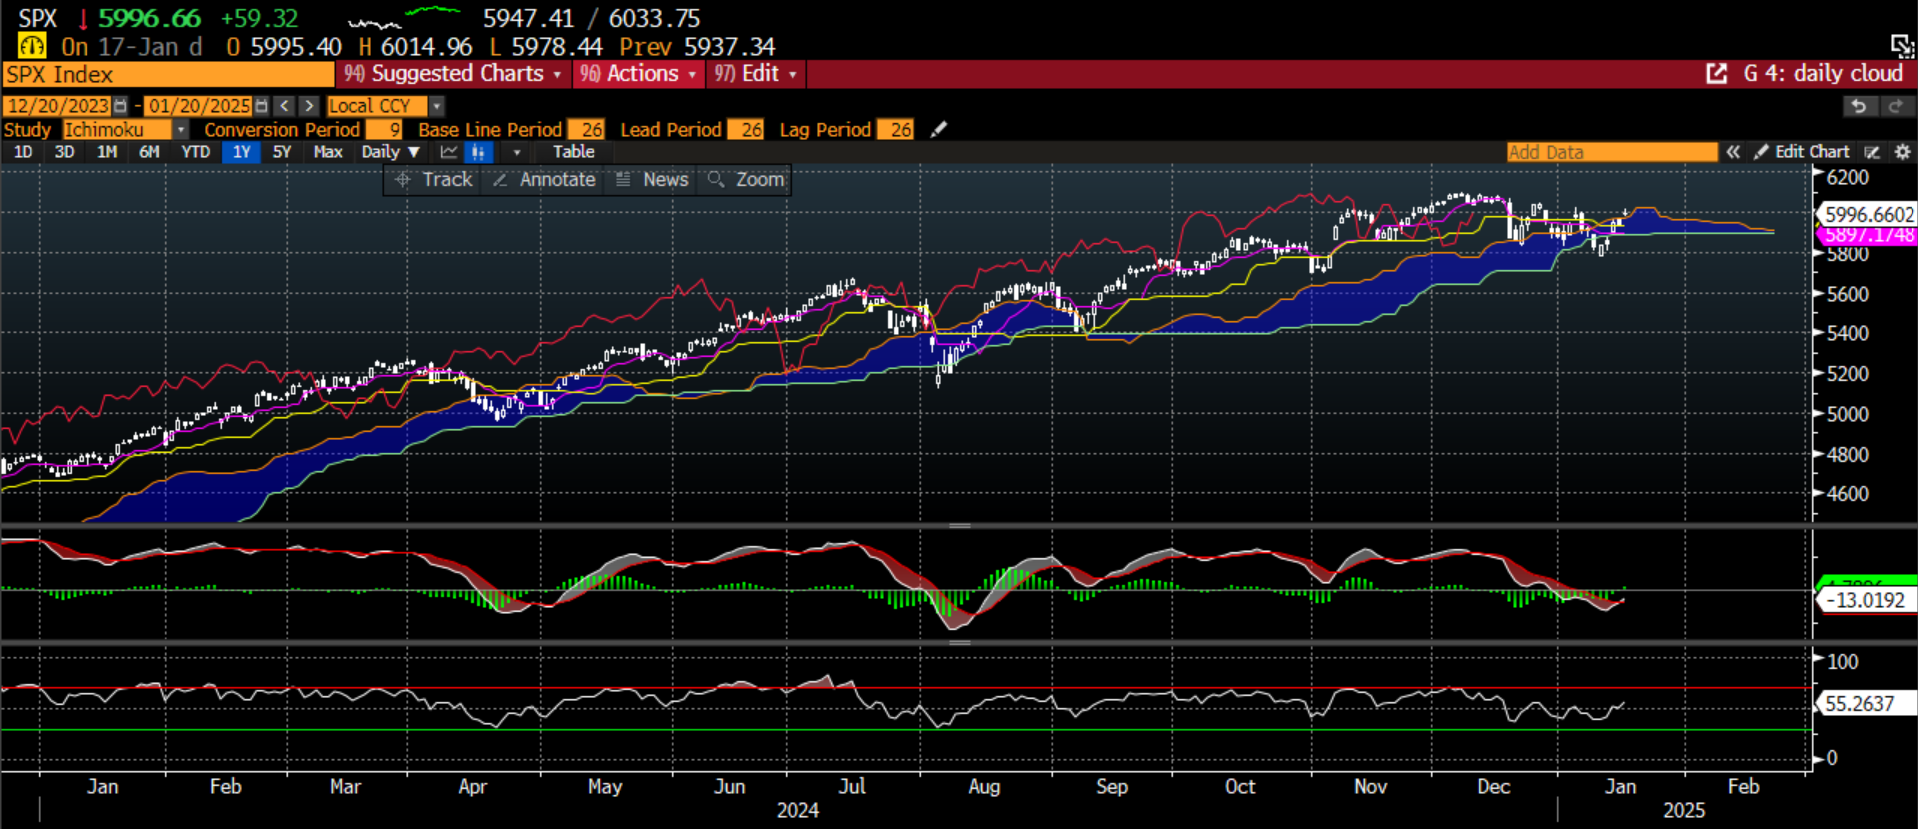
I will go through a number of the more important ones. The first is the SPX above. We can see it had started to breakdown below the cloud, The lagging span never broke down and the cloud only flattened out, and did not turn lower. Now, the index is trying to move back above the cloud, as bulls try to take control back from the bears. In addition, the MACD in the middle panel is moving higher and crossing over, typically a short-term positive sign. While this is not a fully bullish chart, it is one that suggests the bulls are taking control again and there may be more risk of moves higher than lower.

The NDX is in even better position. The bears tried to press lower but couldn’t get the price below the cloud, which held as strong support. The MACD is also turning higher, and the cloud is still pointed higher. This is a very strong technical pattern for the NDX and probably, not surprisingly, the strongest technical stock index in the world.
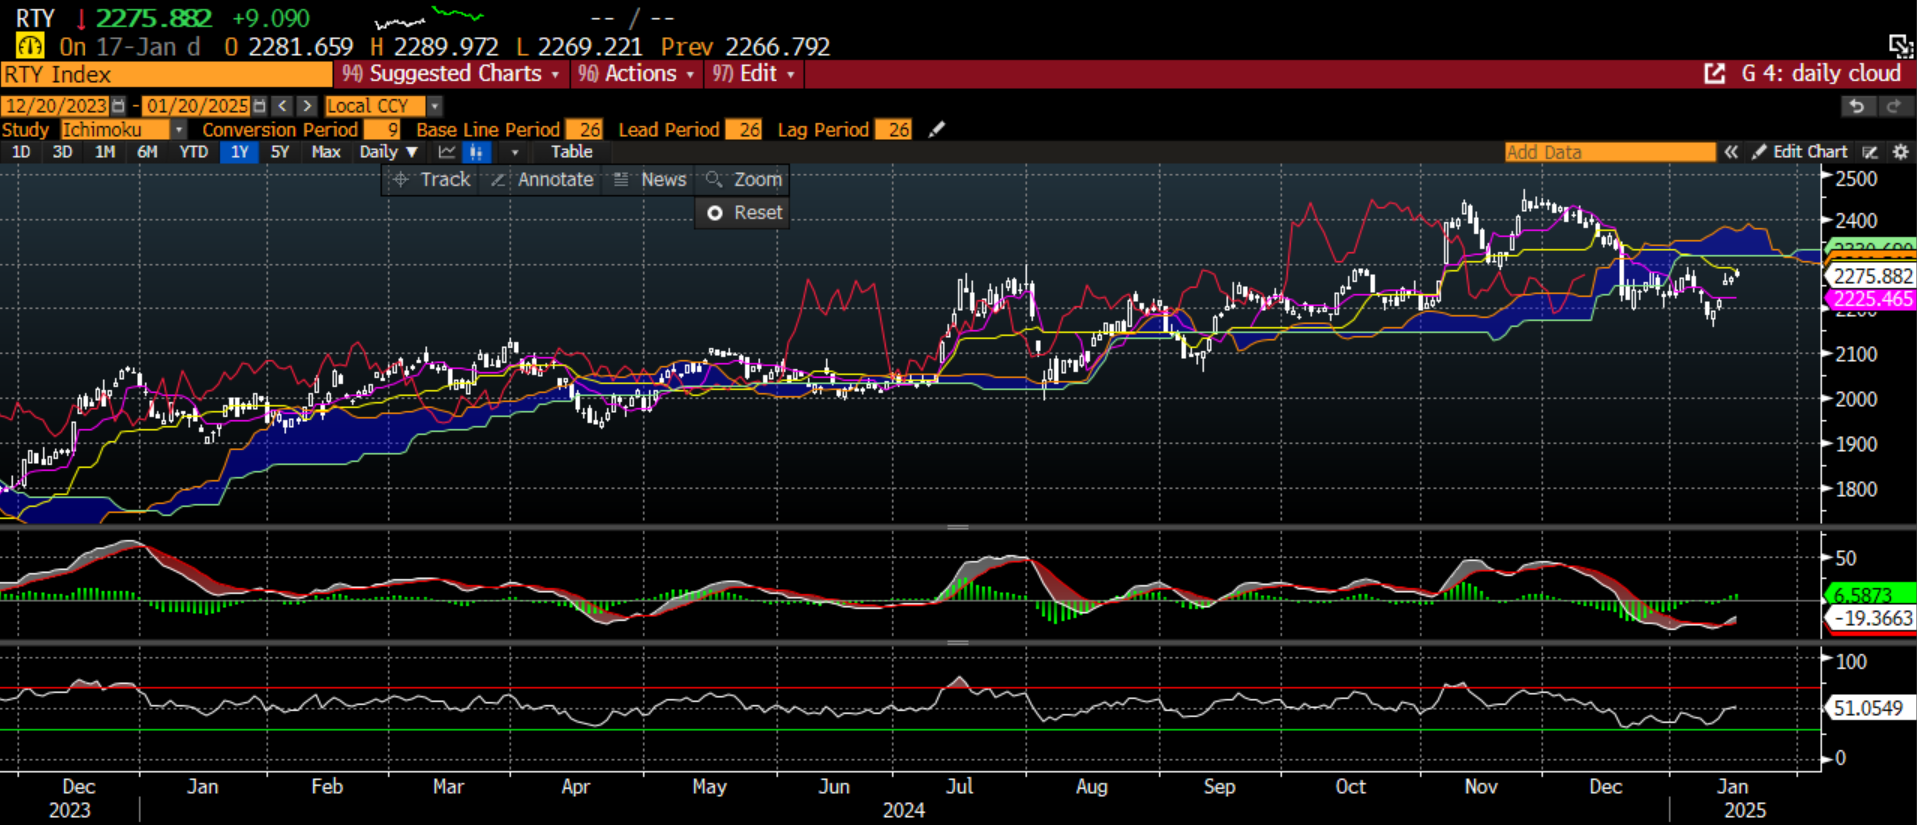
Staying within the US but seeing a decidedly different pattern is the Russell. You know from last Fall, I was getting bullish on small caps because of that NFIB number I mentioned. It has continued to march higher, but small caps have definitely struggled since the Fed rate cuts were taken away. I had a trailing stop loss in my position, so I have nothing now, but this is the one place that I think has a lot of upside, but it requires a big tailwind from earnings and rates. There is still a lot of wood to chop on the upside and earnings have continued to be poor, so I will stay on the sidelines until given news to lure me in.
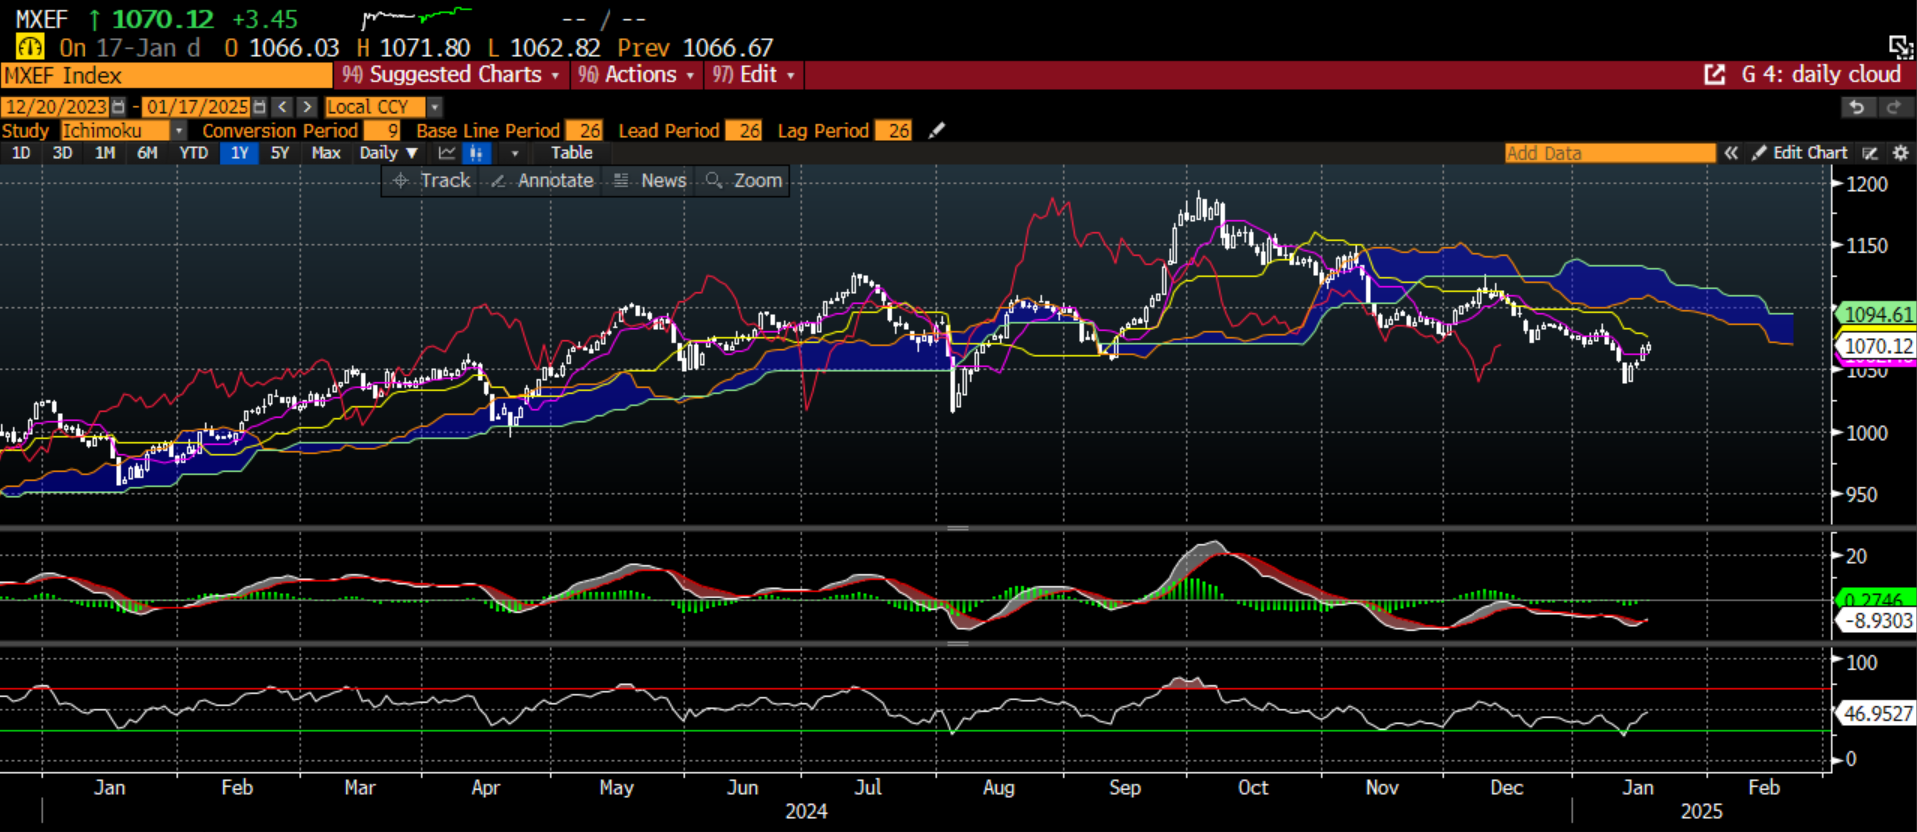
Even worse is the Emerging Markets Index. With the China news, we should not be surprised. However, after a push higher in late Summer and early Fall, when no less than David Tepper was touting Chinese stocks, the index has gone nothing but south. This is a reminder of one of my tangent rules in trading - if you are hearing it on CNBC, it is time to take the other side, as those famous people are more likely trying to get you to take them out of their position. Well, emerging markets price action looks pretty poor and there is little fundamental news that is positive with China really struggling and the US looking to impose tariffs. Tough to short anything when financial conditions are so easy, but this seems to be a place where one might consider it.

It isn’t just the Emerging Markets. It is the rest of the world outside the US. Another chart that looks to be trending lower, not higher, and has a lot of wood to chop on a move higher. Too many things have to go right to try and bottom fish here right now. We know the ECB will be easing policy, but the BOJ is tightening. Other economies like Germany etc are tied to China. This is one to watch and not bottom fish in.
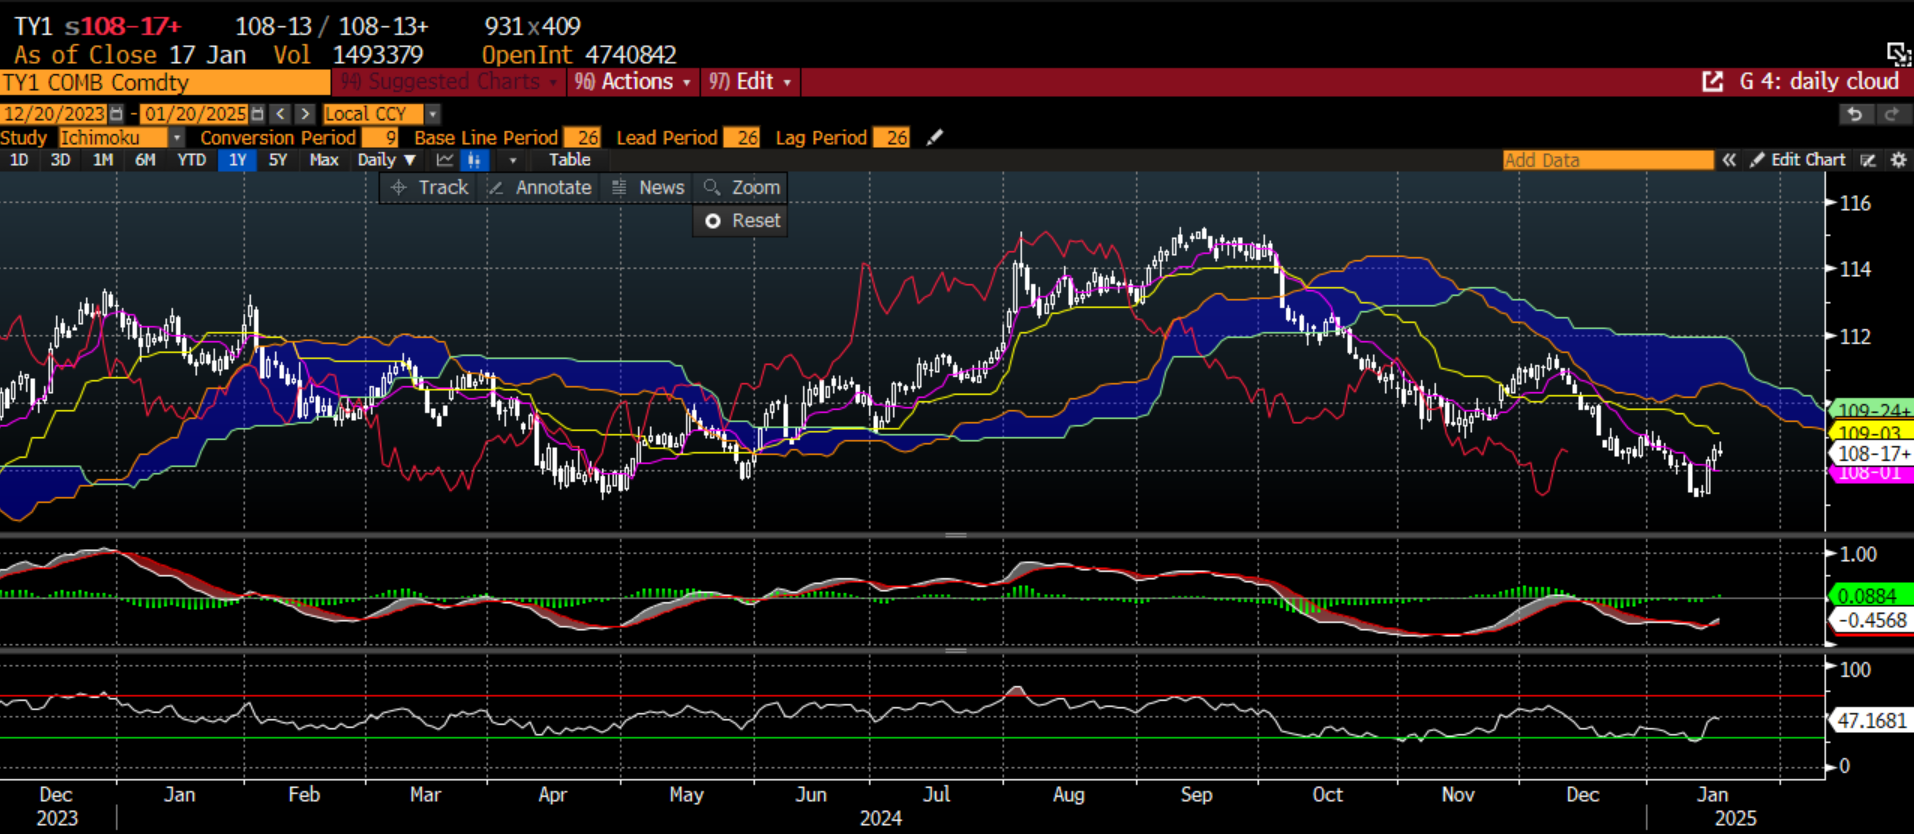
What about those bonds and the big move we had this week? Sure, the move higher has wiped out the losses of 2025, but the move lower started in September, and the recent move of the last week really just looks like a dead cat bounce in a bear market. The trend is lower in the cloud and there is a ton of resistance. I still see rates higher and not lower, with a 5% handle coming as that is where the US will find the marginal buyer right now.

Oil has broken out this year. Maybe this is more geopolitics, but we did get good news on the ceasefire in Gaza. We shall see. I know there is still a war in Ukraine. Oil has also fought off the ‘drill, baby, drill’ story. While in the short term, the MACD and RSI are saying we could pull back, this has likely turned to a market where one buys the dips for now. What does this mean for inflation?

Copper - struggling between a US economy that is still looking strong and a Chinese economy that looks like it is imploding. It is going sideways for quite some time but is showing sings both price and lagging span want to breakout. What would be the catalyst? It wouldn’t likely be the US as I mentioned most investors think the US is in a good place economically. The catalyst would be fiscal stimulus from China trying to offset the problems in the economy. This will be a chart to watch in early 2025. Can Chinese stimulus perk up commodities? What does that mean for US inflation with growth strong? What does that mean for the Fed?

The last chart is that for the VIX futures. I have mentioned before how so much leveraged money is allocated on a value at risk basis, with implied volatility as a critical input. As volatility moves higher, risk is cut. As volatility moves lower, risk is put on. This is regardless of the opportunity set, often upsetting many of the portfolio managers that are told to cut or increase their books when they may not want to. VIX really picked up after the December FOMC meeting however now it looks overdone and is probing the downside. If it breaks the cloud, I would expect risk to be put on, adding to the success of SPX and NDX, and probably even taking the weaker markets like RTY and EM to their resistance levels. Again, something to watch.
I feel the technicals for these various markets may be more important than the fundamentals over the next few weeks. Don’t get me wrong - there is a LOT of macro news that will play out. However, there is conflicting news. There is confusion depending on your source. There are also games being played, hijinks if you will, that make it even harder to know what to think. Focus on your core markets. Don’t get distracted by the noise. Don’t let the first memecoin you buy be the one that went up 3000% in 12 hours already. However, use that information to inform your trading. This Q1 is going to be difficult to navigate, but let’s try to do it together.
Good luck and … Stay Vigilant

Excellent read on the signals, Richard. Very useful. Thanks!