
Inconceivable
You keep using that word. I do not think it means what you think it means.


What a week!
In fact, some might even say the price moves we have seen would be ‘Inconceivable’! Whenever I think of that word, I think of the scene in “The Princess Bride”, one of my favorite movies. However, as Inigo Montoya tells us in the movie “I do not think it means what you think it means”.
In fact, there were many who pointed out the 10% move higher in the SPX on Wednesday was an ‘eight standard deviations move’ only meant to occur ‘once every 2.8 trillion years.’ I would suggest that you might be using the wrong model. In fact, when we price options contracts, we use a Black-Scholes model that assumes stock returns are normally distributed, however, empirical evidence is very clear that there are fat-tails to the distribution. Thus, traders make adjustments. We call this kurtosis. Some will also make adjustments using the Merton jump-diffusion model.
I am not suggesting you need to do either, but I am suggesting you shouldn’t fall for the trap of saying that what we saw this week was “inconceivable” and “happens only once every 2.8 trillion years”. In fact, having had the benefit (I guess) of trading in the European exchange rate meltdown, Tequila Crisis, Asian Financial Crisis, LTCM Crisis, Tech bubble, 9/11 crisis, Enron/Tyco/Worldcom credit crisis, Great Financial Crisis and Covid, I would suggest if you are involved in financial markets, you should get used to markets like this, because they happen more often than the normal distribution models would suggest. In fact, a long-time friend and I were exercising this week, and joked that younger people on his team were blown away. We both said, ‘um, this is called volatility and markets normally have it.’
Chalk it up to greed, fear and leverage.
I discussed last week that while I thought the markets were now in a sell-the-rally mode as recession fears begin to take hold, there was scope, however, for a short-term rally. By the time the markets opened on Sunday, I felt we were at that point. I wrote about it on LinkedIn on Sunday night/Monday morning, mentioning several things that were in Stay Vigilant last weekend:

Chart of the Day - near-term bottoming?
I open up my Bloomberg on Sunday evening and all of the stories are about how much the market is down, and how we have clearly taken out the 5000 level
However, there may be another story to tell. That is a story that we might be at a point of short-term capitulation
First, the front month VIX future, which closed at 33 on Friday, hit 40 in the early Sunday evening trade. Since then, it has pulled back to 36 in an apparent peak
In my Stay Vigilant Substack this weekend, I highlighted how the VIX cash level over 40 plus the VIX cash being more than 2 standard deviations above the mean were also indications of a short-term bottom
Second, if we look at several risky asset futures, they are already off the lows seen in early trade. The chart today shows e-mini S&P 500, Bitcoin and copper
In fact, Bitcoin had traded higher during Saturday’s trade as well, suggesting that perhaps Friday was the low in that market. I have highlighted how Bitcoin and crypto are a good leading indicator of risk in the markets
Now we see S&P and copper start out Sunday on the lows and then begin to move higher
There is a long way to go just to get to the open tomorrow, however, these are some positive signs that for the time being, the worst may be in
That said, I am not suggesting we have seen the ultimate lows of the market. There is still a lot of uncertainty and earnings expectations have not come lower yet. With earnings beginning this week, that process will start
Expect all eyes on the commentary from JP Morgan and Bank of America as to their thoughts on consumers and businesses
However, from a tradable bounce standpoint, there may be scope for that but only if you deploy very good risk management
Be humble, be patient and ... Stay Vigilant
By Tuesday, my attention turned to the bond market. I continue to listen to Treasury Secretary Bessent. I think he is one of the most important voices in the room right now. He has been on the podcast circuit, as well as on the primary media circuit. He continues to tell us to focus on the 10-year yield. In doing so, I also want to recall what Brian Wesbury told us last week in the podcast I linked to the Stay Vigilant. He discussed the massive increase in government spending. In fact, he is not alone. Barry Knapp mentioned this a year ago in the podcast he did with me on this platform. The smartest minds on Wall Street are focused on the government spending angle. Why? Because this is a positive potential catalyst for bonds and stocks alike. When we think about how we can get out of a mess of a market like we are in now, we need to think about ‘what are the positive catalysts?’ I don’t think Fed cuts are one because they aren’t going to matter right now. I do think spending cuts, tax cuts (in a balanced budget) and lower regulations are those catalysts. Bessent keeps talking about all of them.
I wrote about this on Tuesday as being more important, in my mind, than the tariff debate:

Chart of the Day - where should we focus?
Clearly trade has been the topic of much discussion. I know I have covered it on podcasts and in my writing both here and in Substack
We are all trying to put together what the strategy may be behind the different policies that are being put forth right now. Some cynics will suggest there clearly is no policy. Other cheerleaders will suggest it is playing 4D chess
None of us know. All we can do is see what is actually being done and determine what might change and what the impact may be
Right now, there are two important policy changes that have come out in 2025. The first is DOGE aimed at eliminating waste, fraud and abuse in the government. The second is tariffs aimed at making global trade more fair
Which matters more?
The chart today looks at each in terms of their size relative to the GDP of the US. The scales are different to show you the relative changes
As you can see, the US trade deficit as a % of GDP is 3%. Pre GFC when China first entered the WTO, it got up to 5.5% of GDP. It has come down since and been bouncing around, moving higher when the economy is doing better and vice versa
The second line is federal spending as a % of GDP. It is at 23% of GDP. It has been trending higher since 2001, having been down around 17% in the early 00s and as high as 29% in 2021
For the record, federal tax revenues regardless of what the tax rates are come in around 18% of GDP
This is why we had a balanced budget under Clinton in 2001 and why we have a large deficit that must be funded with debt issuance now
It isn't clear to me that a trade deficit of 3% makes Americans poorer or lowers the standard of living. After all, if we have it so badly in the US, why are millions of people trying to get visas?
However, it is more clear to me that we have a large spending problem in the US, particularly in DC. An amazing stat on the All-In podcast today is that 25% of US GDP comes from around DC. What???
All of the lobbyists etc with their hands out. Remember, no matter if taxes go up (tax the rich and the companies) or down (we can grow our way out of it), the tax revenues stay about 18%. Thus, 23% is too high
Bessent's plan is to get back to 3% federal deficit. This means 21% federal spending as a % of GDP. This is not much shrinking but is a far cry from the 29% and even where we are now. He is advocating for a slow move to avoid a recession
I think it is arguable to say we have a trade problem. I think it is very fair to say we have a spending problem
Your thoughts?
I doubled down with a post the next day, showing a timeline of how the bond yield was moving in response to headlines:

Chart of the Day - where should we focus part 2
Building on my post yesterday on trade vs. fiscal spending, I want to look at the 10 yr yield in the US. After all, Treasury Secy Bessent has told us all to watch the bond market as a signal of the success of Trump's policies
I agree with Bessent. The 10 yr US yield is the rate upon which all other assets are priced. Other sovereign debt, corporate bonds, equity valuations & commodity futures curves
We should care about bonds. James Carville said when he died he wanted to come back as the bond market, because it intimidates everyone. He was also an advisor to Clinton, the only President in memory who balanced the budget
I plot the 10 yr yields since late last summer. I have added some narratives as to what was driving the yields in my opinion
Late summer into the election - the bond market sold off (yields higher) as there was concern about fiscal spending from both candidates
Post election relief rally on the hope that Trump would be fiscally more sound however, this reversed as the market digested the different candidates for the various Cabinet positions
The bond mkt regained its footing & yields moved lower when Bessent was named as Treasury Secretary
February was all about DOGE and cutting spending. Uncovering fraud, waste and abuse with headlines every week. From the inauguration when DOGE was created until the end of February, bond yields fell from 4.6% to 4.15%
March was the month of tariff deadlines, extensions & discussion. There were other things being discussed like wars in Europe and Middle East, and still some spending cuts, but yields went sideways to drifted higher
Early April yields moved lower on DOGE headlines & more spending cuts. There was still a feeling tariffs would be delayed or extended
Liberation Day hits and bond yields spike higher
The last 5 weeks, bond yields have gone nowhere. In spite of arguably some successes in policy elsewhere, there clearly have been some other policies canceling it out. It is not clear at all that the bond market is supportive of trade policy
However, when all of the talk was on cutting spending, the bond market did seem to like those stories
So, where should we focus? Where did the Treasury Secretary tell us to focus?
I think it is clear. What are your thoughts?
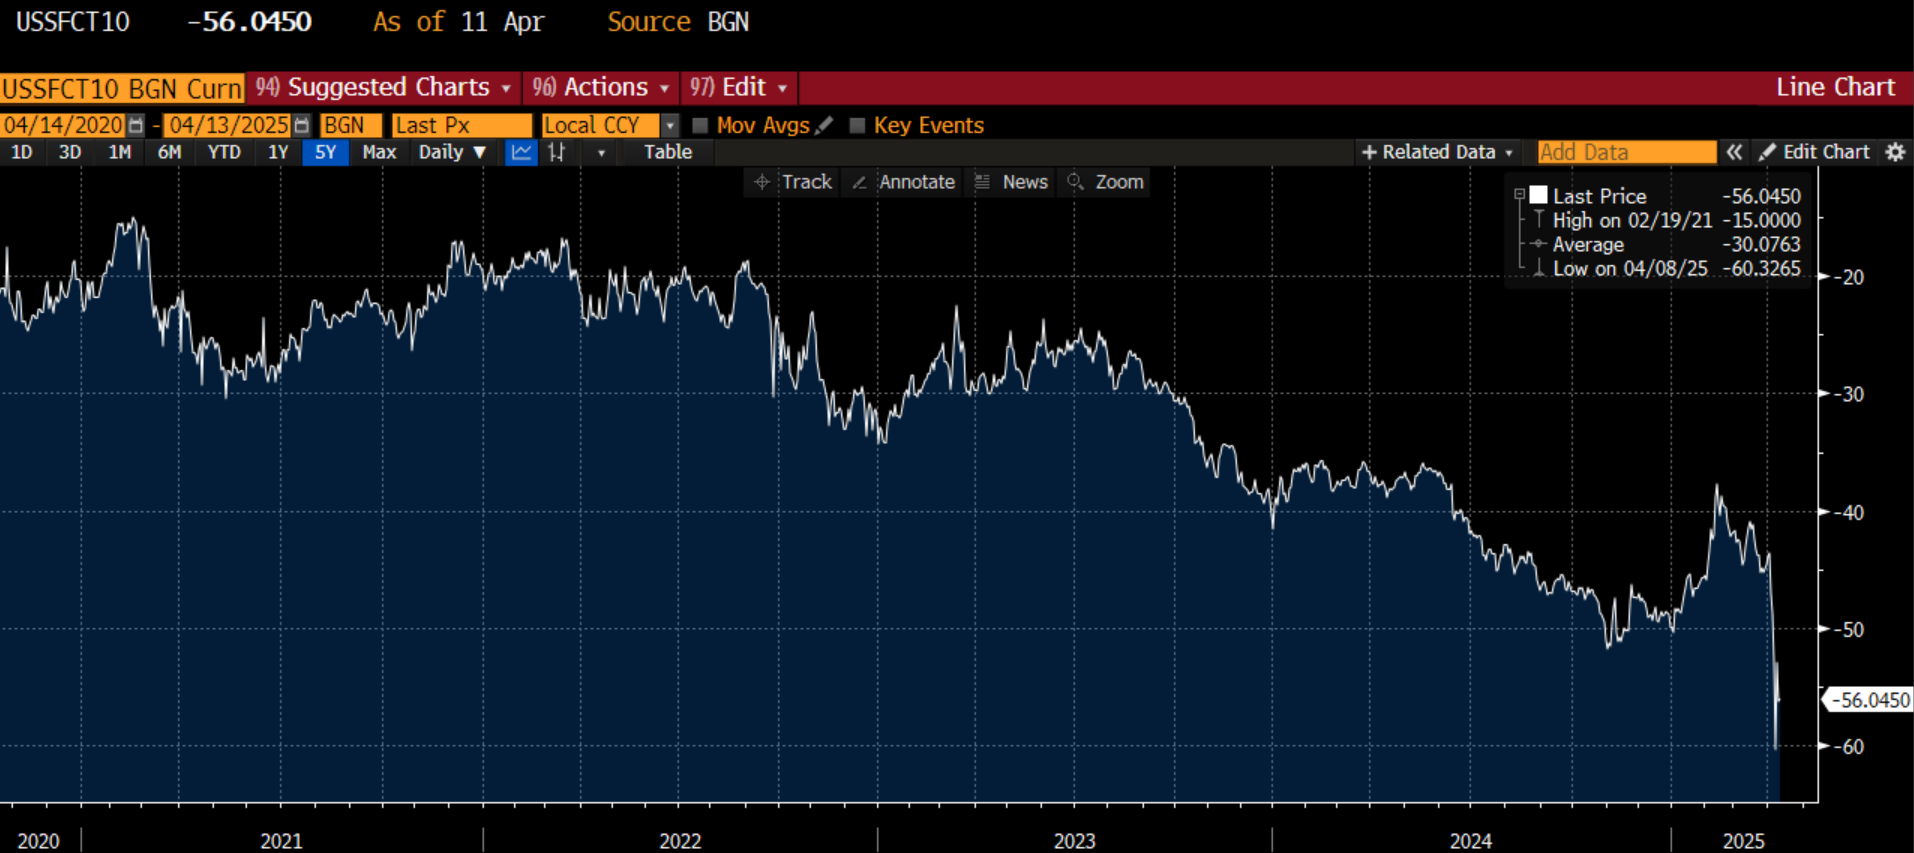
The bond market was still top of mind on Thursday as I tried to recap the volatile markets we were witnessing this week. There are a few stories that both Jamie Dimon and Scott Bessent were able to get to President Trump and convince him to back-off the tariffs. Why did they do so? Why did it happen this week? My sense is it had a lot to do with the Treasury bond auctions this week. Recall that this year, the Treasury needs to roll over $7 trillion in bonds and has $2 trillion in new issuance. If you want to sell that much, who will buy it? The Chinese have been backing away for 6 years now and with the latest kerfuffle, you realistically can’t expect them. There was some suggestion the Japanese were balking and telling Bessent this. However, with rumors that hedge funds are blowing up on the Treasury basis trade, it may be more domestic market plumbing dynamics at play. We can see this in the 10-year swaps spreads. Sure, hedge funds and traders use this market, as do banks to manage their regulatory capital. More importantly, insurance companies, pensions and corporate Treasury rely on this to swap fixed to floating and vice versa. These sharply widening negative spreads indicate some sort of duress in the market, so capital is not flowing efficiently.
Another case in point is the FX market. The chart below comes from Stay Vigilant friend Mr. Risk, however, it was also highlighted by Jan Hatzius from Goldman Sachs this week. The chart shows that the EUR/USD FX rate is typically linked to the rate differential between German Bunds and US Treasuries. However, this week, as this spread collapse, the EUR/USD FX rate went the other way. This means there are no arbitrageurs out there to bring this back into line and/or there is overwhelming flow from investors to move assets out of the US. Based on the conversation in the market, particularly by investors based overseas, both of these are true.

If hedge funds and dealers are seeing the plumbing of the Treasury market clog up, they know that the market is not going to clear effectively. There are two people who would know this intimately - Jamie Dimon and Scott Bessent. I wrote about this on LinkedIn then:

Chart of the Day - blink!
He blinked. Everyone wondered if or when it would happen, and finally Trump blinked when it came to tariffs
Sure, China still has a preposterous amount of tariffs on it. Once we are above 100%, why not 200 or 500% It no longer matters because no one will buy from there
However, for the rest of the world tariffs, he blinked. Why? Was it because so many people came and wanted a piece of the great deal?
I don't think so
Was it because the SPX hit some magical level?
I don't think so
Was it because the bond market lost confidence in Trump, right as the Treasury started its auctions, with the 10yr on Wednesday and 30yr on Thursday?
I think so
Recall, Treas Secy Bessent told us to watch the 10yr yield as a sign of success for Trump's policies
The chart today shows that over the last month, even as stocks sold off, the bond market rallied. The dollar was generally lower with lower stocks as global investors fled the US and moved the money back offshore
However, the bond market rallied. This meant a few things:
1. It meant diversified portfolios that were risk parity or 60-40 were somewhat insulated from the large moves in the stock market, which was coming off very overvalued levels
2. Yields were heading lower
3. We could make the case the bond mkt supported the moves
The circled area shows how that changed on April 8 and into April 9
Stocks and bonds sold off together. Dollars continued to move overseas. It was clear people sold anything American
It was also clear the bond mkt was losing faith in Trump, right when the Treasury had a lot of bonds to sell
Whether this was foreign actors dumping bonds to send Trump a signal isn't clear, doesn't matter and probably makes sense
China has greatly reduced its US bond holdings anyway. If it wanted to sell, but other investors had confidence in US bonds, it would just be a trade.
Ultimately trading partners under the weight of tariffs would have fewer dollars to recycle into US asset markets so you can't blame them anyway
We call that risk management
More importantly, with the volatility we have seen in all markets, including rates, any investor regardless of their domicile was going to buy less and want a higher yield to do so
Again, we call that risk management
In order to have auctions go smoothly, we need a reprieve and it came
Back to the James Carville quote: "When I die, I want to come back as the bond market. It intimidates everyone."
Bond vigilantes 1 - Trump 0
The volatility of the markets may be here to stay for now, if uncertainty is the new normal. I discussed this on a podcast with Zed Francis of Convexitas, a firm that advises clients on how to hedge their portfolios in times like these. We recorded this on April 2, no referred to as Obliteration Day instead of Liberation Day. You can find that discussion here and Zed summarizes it in his post on LinkedIn:
“A pod recorded before everything changed! The themes are the same but some new information to take into account.
Big thanks to Rich Excell CFA, CMT hosting a discussion on CFA Society Chicago Investment Exchange Forum. The Great Rotation of Q1, when does rotation become something more insidious, and volatility themes of 2025.
Volatility Nerd Out:
Correlation LOW – Equities diversify themselves! Low realized correlation has made equity indices appear less risky, likely increasing board risk taking.
Skew has been very boring, and way more interesting, flattens on very small moves lower. Something you would expect in a crisis not a sneeze.
Vega is similar. First leg down, volatility flat to even contracting. We expect this reaction post Great Financial Crisis.
Fixed Income and Volatility are tied at the hip. Helpful to suggest when a sneeze can become a bad cold.
Navigating Volatility: If we shift from a rotation to a true selloff, long only diversification will run into problems. Adding something that is truly negatively correlated to your biggest risk in the portfolio is essential to provide a portfolio ballast. Goal of this allocation should not only be to stabilize returns but also to have the ability to earn a rebalancing premium.”
I continued to highlight the continuing concern seen in the markets as evidenced in the options market in my LinkedIn on Friday:

Chart of the Day - snafu
SNAFU is an old World War II military slang word that comes from an acronym for "situation normal, all f**ked up"
It is a sarcastic expression used to convey the acceptance of chaos and disorder as a normal state of affairs
I think it accurately represents the financial markets right now
After the 10% rally on Wednesday, there were many comments asking or suggesting that perhaps we were past the worst of it. By all accounts, many investors sold their hedges and some put money to work
Then we gave back half of that move or more yesterday and it became clear that we are far from out of the chaos and disorder of the markets
I think there is no better descriptor for what we are seeing that the chart today plots 1 month implied volatility - the level of volatility traders are expected going forward - vs. the 1 mo (20 days) realized volatility - the amount of volatility we are experiencing in the mkt
These lines track each other pretty closely because market makers will gauge if they are able to make back their theta (time decay) from their options portfolio by delta hedging in the market
If they are, they will maintain a bid to implied volatility. If not, they will offer implied volatility lower
The graph of the spread on the far right shows that the premium of realized volatility to implied volatility. The premium is more than 3 standard deviations above the mean
Typically, there is a small premium of implied to realized, think of it as an insurance cost. Now there is a discount. Thus, expect market makers to keep a bid to implied volatility
This will keep asset allocatorss who use risk parity/volatility targeting strategies out of equity markets & more heavily invested in bonds
Importantly, it will also keep hedge funds who provide liquidity in trying times, on the sidelines as implied volatility is an input to Value At Risk models they use to allocate capital i.e. leverage will stay low. That goes for Treasury basis trades, FX carry & equity long/short
It means hedging costs will remain high so long only investors may choose to sell their positions if it is too expensive to hedge
It doesn't help when we get headlines like "JP Morgan Warns Economy is Facing Considerable Turbulence". The mkt listens closely to what Jamie Dimon has to say because his firm has as good a look into the inner workings of consumers, small business and investors as anyone
5% plus moves in a day are not the sign of a healthy market. 10% rallies happen in bear markets not bull markets. I know I suggested near-term bottoming on Monday (& it did); however, that is a tactical decision & not a strategic one
As long as mkts remain unhealthy & there is uncertainty in the economy, expect volatility to remain high
Snafu
As classes are winding down to the semester, we are focusing on the investment recommendations we will be making to our clients. I discussed how much the market dynamics have changed just in the course of the semester, and why it is important to have a disciplined investment process that keeps you from chasing the latest investment fad or the latest tariff headlines.
After all, if we look at the performance of markets around the end of the year, not only did surveys suggest investors thought there would be a soft landing, but sector performance said it as well, with sectors levered to growth staying strong at the top, and those needing inflation to drive earnings at the bottom:

February and March were all about the pivot to stagflation - slowing growth but prices staying higher than normal. The slowing growth came from the expectation of aggressive cuts to government spending from DOGE. Higher prices came from the uncertainty of the tariff talk, which most still thought were a negotiating tactic, and the fact the data were not falling as fast as hoped. We see this stagflation priced into the market via the sector performance, with both defensive sectors that do better in falling growth as well as sectors like energy & materials that benefit from inflation, beating the market:

However, in just the last two weeks, the market has pivoted on a dime, and is now fully pricing in a recession. We see this in the sector performance again particularly when we were at the lows on April 8. There has been a fair bit of short-covering at the end of the week so the last few days distort it a bit so I don’t show that:

We see this in the performance of different investment factors and styles, with a preference for low volatility, large capitalization and quality, classic signs of fear:

And we see this in credit market stress, judging by high yield 5-year CDX:

With volatility elevated, financial market plumbing broken, assets still not inexpensive, and investors, companies and consumers all opting to do less if not nothing in these uncertain times, it should not be surprising to see a recession priced in. Right now, it is best to be patient, be humble and …
Stay Vigilant

These were my thoughts on the past week on Sunday morning: https://kingcambo812.substack.com/p/fear-and-loathing-in-trader-hell-1c7
Excellent Richard as usual. While there is certainly justification for trying to fix the trade and fiscal imbalances, I guess what´s happened boils down to time horizons and the "sophisticated" strategy the mastermind laid out in the book Think Big and Kick ass in business and life.