Inflection point
I got away for a few days of golf before the semester starts. It is an inflection point for me as I move from vacation mode to school mode. It is also an inflection point for the markets
Before I start, I want to introduce the new logo for Stay Vigilant. My daughter is the designer of the logo. She and the Executive Committee (my wife) decided that my Mad-Eye Moody logo wasn’t good enough. We are going with a Vigilante theme for the logo. I do want to thank Kayleigh who is a talented artist even though her academic training and career path are quite different (astrophysics). I know drawing is a hobby of hers and she is good at it. Let me know what you think of the new logo.
Also, before I start, remember to like, share and subscribe to Stay Vigilant. My goal is to demystifinance and I can do that better the more people I reach. If you can do me this favor …
Now, on to the rest of the scheduled programming.
On the last weekend before the semester starts, I spent a few days in Florida playing golf. I was the guest of Jerry McNulty who you may know from the podcast we did last summer. Jerry had a great call on the market then and we will be speaking with him on another podcast in a few weeks. For this weekend, we played three rounds of golf with three different sets of players. I used the time to speak to everyone about the economy and the markets. Some are involved in the market. Some are not. All had something to add to the discussion given their perspective.
It isn’t easy right now. If you see a lot of conflicting evidence in the things you read, you shouldn’t be surprised. For those of us who have watching markets for many decades, it isn’t any easier. The key for me, is to stay disciplined (and stay vigilant). Stay within your process. Now is not the time to go with your gut or to chase a crowd. That is how you can chopped-up and spit out. Sometimes your process yields no strong conclusion. That is fine. That is when you keep your powder dry. After all, with money markets earning in the 3.5-4.25% range, you are getting paid to wait. You don’t have to put money to work right now.
I will go into more detail below, but as I think about my own process which looks at the economy and market from a fundamental, behavioral and catalyst perspective, I am being told to wait. How can that be? We looked at the fundamentals last week. These are clearly negative or declining. This is typically not a good time to invest. Remember, the economy drives earnings and earnings drive stocks.
On the flipside, the behavioral parts of the market, which I will explore more below, are looking positive. The price action for stocks and other assets looks good and this is getting some people excited that this is about to be the start of another bull market. So, the fundamental is negative but the behavioral is positive. What will get people to change their minds? That is where the catalysts come in.
We have seen economic data catalysts the last two weeks. The market has interpreted this news as being consistent with the Fed that is about to pause, bringing the Twin Peaks of peak inflation and peak Fed hawkishness in play. However, over the next 3 weeks we are going to get company earnings.
It started with JP Morgan on Friday. The stock responded well as the numbers were largely in line. Jamie Dimon mentioned the economy is still strong but he sees a lot of uncertainty ahead. The next few weeks of company earnings are going to drive the markets because this market will be all about earnings (more below). Simply speaking, in my work, I see the negatives, I see the positives, and I am awaiting the catalysts. Thus, I am sitting largely in cash and awaiting the fat pitch so to speak. As I said, we are getting paid to wait right now.
Back to the economic data as it was a catalyst last week. There are some better parts of the data. The labor market, in particular, is quite strong. However, the labor market is a lagging indicator and the story here is even a little mixed. On the one hand, we see from the JOLTS data that there are 10.5mm jobs open. This should lead to employees, with the right set of skills, being able to demand a better salary. The last 20+ years, we have not seen a recession until non-farm payrolls have gone negative (and they tend to stay there). We are not at that point yet (horizontal line). Even the household survey, which leads non-farm payrolls at inflection points, recovered last month.
On the other hand, tech firms are laying off by the thousands and Goldman Sachs just started the financial layoffs with 3200 people this week. Goldman is always ahead of the other investment banks, which are also ahead of commercial banks. I have heard from students who have had job offers rescinded (don’t get me started on companies that do that). There are signs of weakness in the one strong part of the economic data.
Source: NY Post
However, as I wrote about on LinkedIn and Twitter this week, government transfer payments are still at an all-time high. Thus, it seems to be a bifurcated labor market, with those on the high/expensive end getting hurt while those in the hourly jobs in leisure, retail, and healthcare seeing more opportunities and getting more money from the government.
“Chart of the Day - the pendulum swings. For all of those market-watchers out there that are calling for a recession, myself included, most are looking at the falling housing market, the negative ISM and ISM new orders data, and the rapid slowdown in autos that we are seeing.
On the plus side, as we just saw, the labor market, measured by the non-farm payroll or the JOLTS measure, still looks very tight. Admittedly the ISM employment and jobless claims measures do put some question into that labor strength though too.
Another chart you have probably seen shared is the rapidly declining savings rate. It has dropped to 2.4% which is the lowest of the last 60 years, even lower than in 2006 during that housing bubble and burst.
There is a stock vs. flow argument here though as you can see in the red line. This is the billions of dollars of savings, not the rate, and this number post Covid spiked to 6 trillion, 5-6x what it was before Covid. Thus, the rate of savings may be lower because the stock of savings, the amount of money in accounts, is higher.
There is another explanation too. Another outcrop of Covid was the government transfer payments to people. These payments doubled during Covid from 3 trillion to 6 trillion and have only pulled back to 4.
In fact, these payments remain at an all-time high and look set to move higher and not lower.
With the latest IRA and govt budget, money to individuals is going back up. The states got involved before the election too with states like California and Illinois sending payments to voters, err I mean residents, right ahead of the election to soften the bite from inflation.
These transfer payments, in addition to the stock of savings, can meaningfully soften the blow on the slowdown in the economy. However, not everyone is privy. Perhaps this is why this recession may feel like a recession of the top 5-10% and not like that of the wider economy.
Perhaps this may mean consumption holds up better than many, myself included, are thinking. This could also mean that inflation could be stickier than we are expecting given the expected falling growth.
It may also mean the Fed stays in play longer than the 50 bps more hikes that are expected in the market right now.
Stay Vigilant
#markets #investing #economy2023 #consumerspending”
As I said, we played golf with three different groups of people. Let me go through what I think I learned from each one. The first day, we played with two other gents, one of whom is retired from a Fortune 500 company and living in Florida with a nice pension. He is feeling a little better about the world than a year ago. He cares about two things right now – inflation and a stable fixed income return. He gets a corporate pension but also has an investment portfolio but wants to invest it conservatively to generate some yield that he can live one. Last year, with no return in fixed income and rising inflation for everything he wanted to buy, he was not happy. His lifestyle was starting to erode.
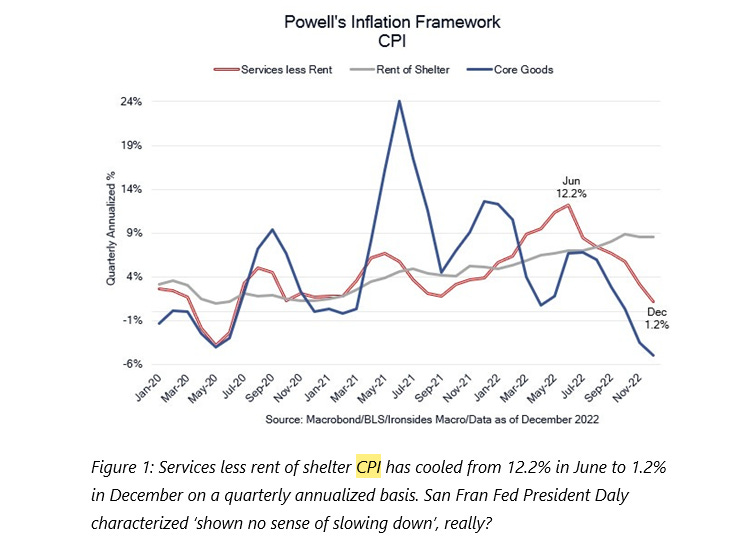
As we saw this week, the inflation data is showing signs of abating especially on the good front where we are seeing prices falling fairly rapidly. These goods prices are what people notice the most – at the pump, at the grocery store, at restaurants, when they go to travel. There is a positive trend to this. Barry Knapp summed up JayPo’s self-described CPI framework best here:
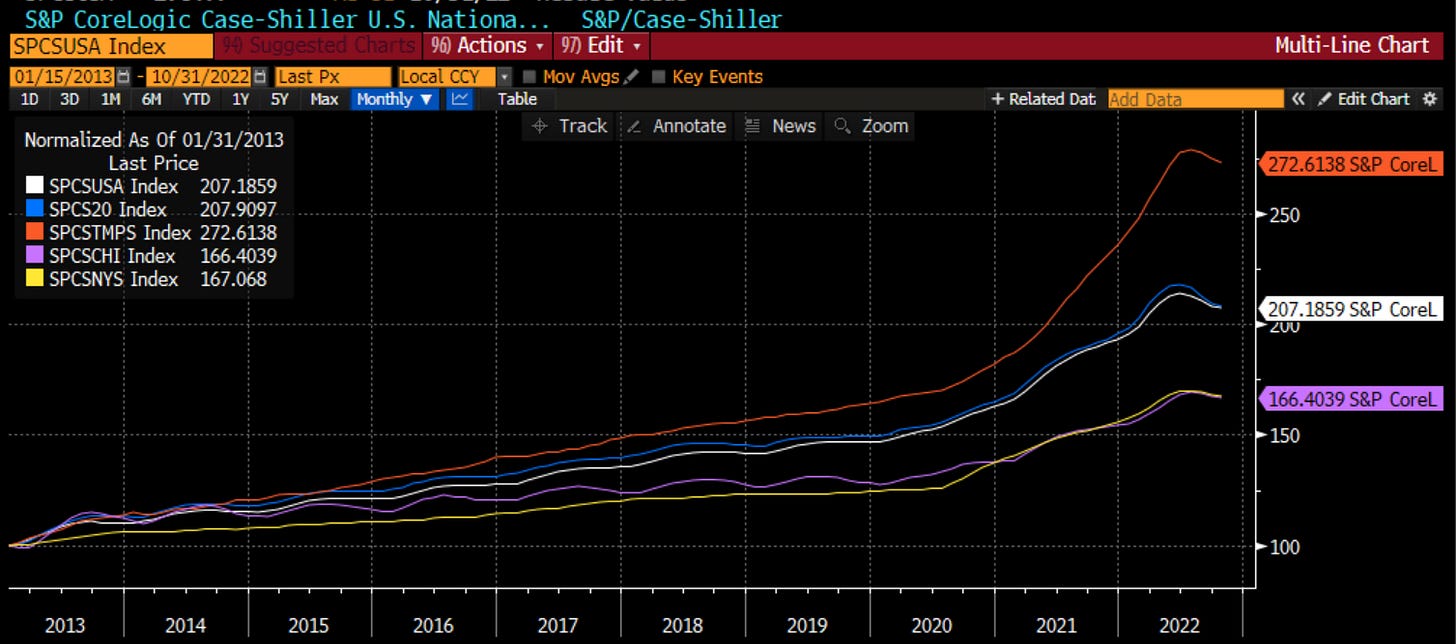
The other player was a small businessmen whose company is tied into the real estate economy in Tampa-St. Pete. He spoke about the 75,000 people that have moved into Pinellas County in the last 2 years, the fastest growth in the US. At the last consensus, there were 959k people in the county so this is almost an 8% net gain. You can see it in the construction being done from the highways being expanded, to the pylons being driven into the ground to support large condominium projects, to the money being spent to upgrade hotels and strip malls and other infrastructure in the area. There may be a slowdown from the Covid peak, but this does not look like it will be deep. Real estate prices have more gone up 2.5x in the last 10 years, but at $350-400 per square foot, do not look that expensive relative to other places to retire or to people moving from the East Coast. Housing is always local so let’s look at where the biggest moves have been. This chart shows Tampa-St. Pete, Chicago, NY, the 20 big metro average, and the national numbers. Softer yes, but all still well above pre-Covid levels.
The second component of inflation, per Jay Powell, is the housing inflation. This is also expected to fall as real estate – residential and commercial – is expected to continue to soften. Within the CPI data, this actually moved a bit higher this month. Anecdotally, I don’t see much slowdown around me in Chicago and I didn’t see much slowdown in Florida the two times I was here over break. Yes, we are past the ‘buy at any price’ Covid panic, but we seem to be in a more normalized environment, at least for now. This tweet from Lyn Alden who is a great follow on the economy:
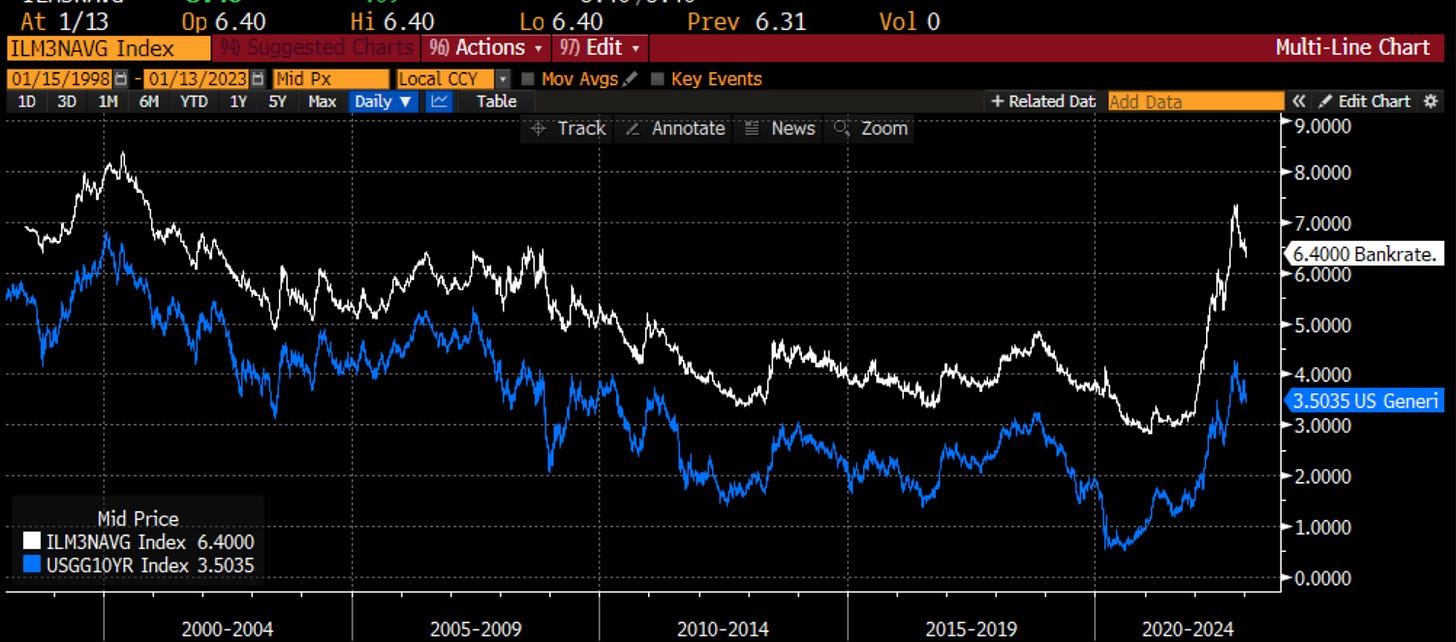
Mortgages are actually looking set to come in a bit. The 10-year yield has stabilized and come in 75 basis points from the high and the spread of 30-year mortgages vs. the 10-year yield are normalizing again. Recall, this spread blew out last year, caused by the QT from the Fed and illiquid market conditions, which exacerbated the move in the 10-year yield and cause the spike in mortgage rates. If the 10-year yield stays at 3.5% and this spread moves back to its steady state around 2%, that would give us a 5.5% mortgage. Yes, it is high relative to the all-time lows, but it is not high in the long-term view of mortgages.
The next day we played golf with another market veteran. We got into the weeds a bit more about what we expect. When breaking down the bullish and the bearish argument, it became clear that there are two places where bulls and bears disagree – terminal Fed Funds and S&P earnings.
The bulls clearly see peak Fed hawkishness. They agree with the bond market that is pricing in 50 bps more of hikes through March and then 50 bps of rate cuts in the back half of the year. Investors, whether it was the retiree from day one or this market vet from day two, both saw value in the fixed income market when yields got near 4%, whether that was in the front part of the Treasury curve or in TIPS. As such, the STIR (short-term interest rate) market is decidedly more dovish than the Fed dot plots at this point. Personally, I think the bond market is too dovish and wonder out loud if Jay Powell will try to convince it as much as he did at Jackson Hole and the September FOMC. This chart courtesy of Roberto Perli.
On Twitter this week, the popular chart was of the 2-year yield falling below effective Fed Funds and how that signals the end of the Fed tightening. This comes from Sagar Singh Setia. We can see that over the last 20 years, when the 2 year has gone below effective Fed Funds, the Fed has stopped hiking and a recession was not long after.
My pushback on this is that the last 20 years have been a disinflationary period in the market. What if we looked at the same information on a longer time frame, say 45 years (the longest I can get the data on Bloomberg).
Zooming into the 70s and 80s, it seems the 2 year and Fed Funds don’t have quite the same relationship. I ask you this, is our inflationary period more similar to the 70s and 80s or the 2000s?
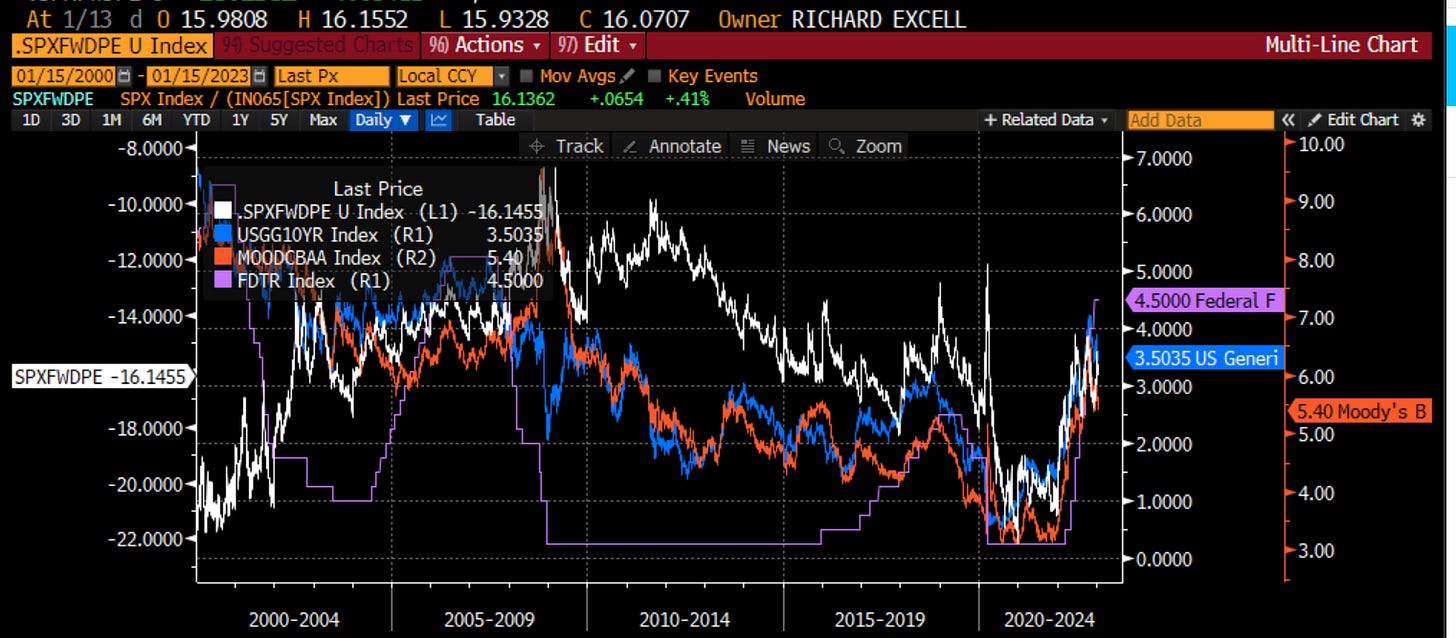
This matters because the multiple that investors pay for earnings is affected by yields. If we think that yields have peaked, then multiples have bottomed. This means investors are potentially comfortable with 17x forward P/E for the market. Personally, I think we should be lower, closer to the 15x the market has averaged the last 30 years. This looks at the forward P/E (inverse), the 10-year yield, Fed Funds and the Moody’s Corp Baa rate. A peak in yields would seem to suggest a base in multiples.
However, we can see that the multiples are not compressed relative to history, but still above the long run average. How is your margin of safety for entering at these levels?
This brings us to the other disagreement of bulls and bears – earnings for 2023. An SPX at 4000 with a 17.8x P/E assumes earnings are going to be about $225. This where many of the more optimistic strategists are. I showed you last year where the bears think earnings will be $180. If we assume the same P/E of 17.8x, that puts the market closer to 3200. Thus, we can say the real debate between bulls and bears doesn’t even hinge on multiples, it can entirely hinge on earnings. The difference between those looking for 3200 and those comfortable with the market at 4000 is entirely dependent on their view of earnings.
The consensus at the moment sees earnings of 225 in 2023 and 240 in 2024:
In speaking to Jerry, he mentioned that veteran market watcher Bob Brinker sees SPX earnings of $235 for this year:
I have spoken and showed the work before of the bigger bears on the street who see $180 earnings. Perhaps the most bearish piece I have read suggests SPX earnings fall about 30% peak to trough during recessions. This puts earnings in the $160 camp and even if we assign a 17x multiple to that (one might argue if things were that bad, multiples would contract) we would get 2700 SPX. That is not a scenario that I would assign a high probability to, but it is one that I think we need to consider.
To get upside to the market from here, we need to not only see no decline in earnings, but we need to see the multiple expand back toward the Covid highs. This seems to be a lot of heavy lifting to me. For the last 30 years, we have not seen much multiple expansion when we are going through the earnings decline. We will see that at the tail end of the recession, just not at the beginning.
Thus, the news that can get people to change their minds is either on the Fed (seems unlikely right now) or earnings (which we will see in the coming weeks). There are two distinct camps and right now the bulls are in more control than the bears but time will tell.
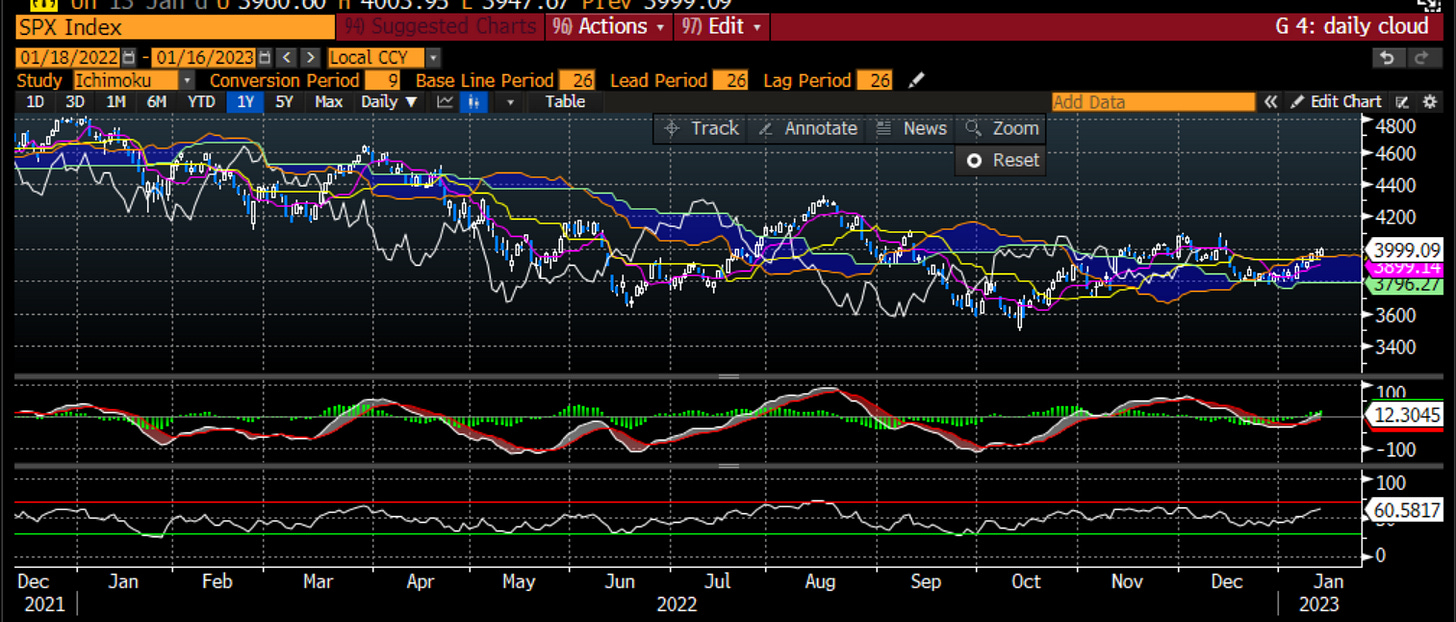
Why are the bulls in control? This is where technical analysis comes in. The technicals of the market look healthy right now. We can see that price is moving above the 13 week and 26 week moving average. We are approaching a critical juncture as we get to the long-term downtrend line.
We are also moving to the Ichimoku cloud and the MACD is turning higher. These are both bullish developments
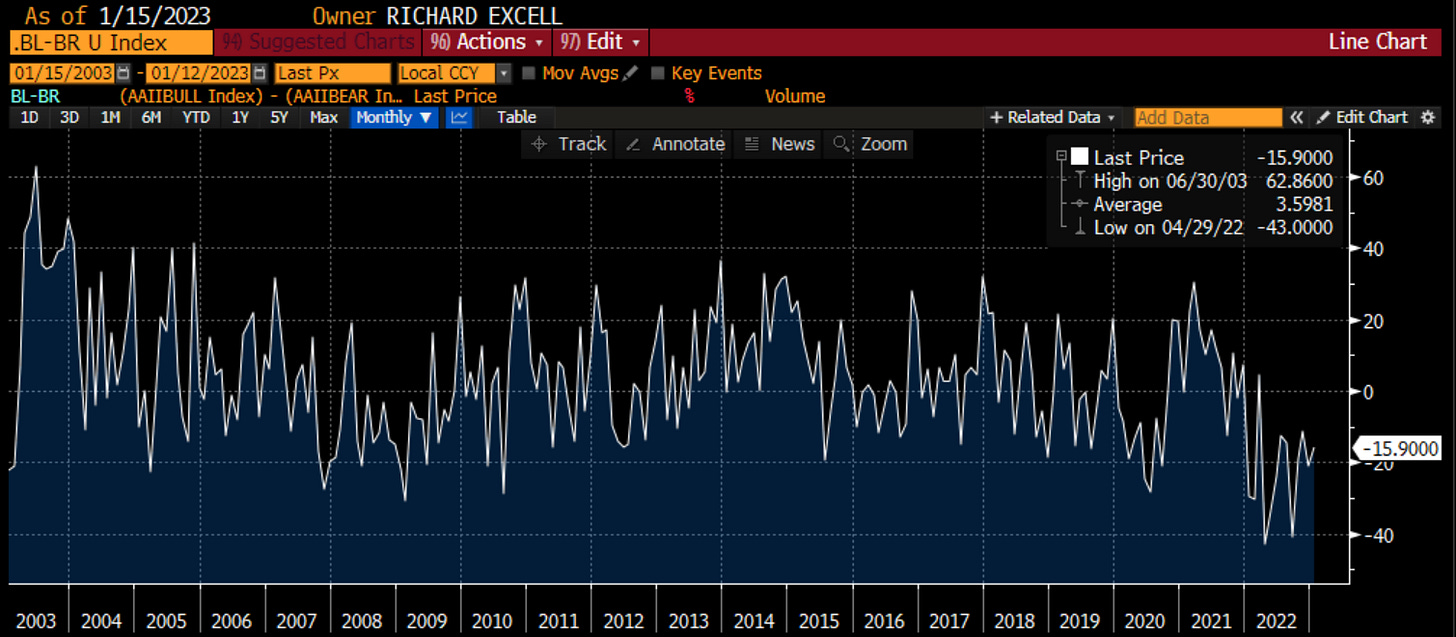
Even with the move off the lows, sentiment is not stretched if we look at AAII data.
The ARMS Index is also giving us a positive signal
Though, volume is not confirming the move as it stays somewhat benign given the potential breakout in price.
As I read from Walter Deemer, a veritable legend in technical analysis and the inventor of the breadth thrust, we had a breadth thrust this week which is usually a strong technical signal.
The last group we played with had someone early in their market career. His commentary was interesting because he spoke about his friends who are not financially savvy who were chiding him in 2020 for all of the money they were making while he was only making 10%. They continued this into early 2021. Again, they were crushing it, but he was ‘just’ putting up 10% in his p.a. Over the last 18 months, the story has of course changed. They have now given back all of their gains and then some. This is another lesson that the market likes to repeat. It is difficult to make money year in and year out. It is important to not confuse brains and a bull market as they say. The TINA market with 0% cost of capital that drove everything higher is over. This hurts this group of investors, but it also hurts companies that benefitted from a low cost of capital. This came up in our discussion, as I mentioned the performance of zombie companies in 2020 vs. 2022.
Zombies are companies whose EBIT does not cover interest expense. In the Russell 2000, this has been about 10-15% of the index.
They did well in 2020:
But not in 2022:
As the cycle has matured, these companies will struggle and probably go out of business. This is bad for these investors. However, it is good for companies that know how to navigate this environment because they can take market share back. They can show profitability. One way we can see companies that can execute well is by looking at firms with a consistently high ROIC (return on invested capital). This type of firm has an economic moat in the parlance of Warren Buffet and value investors. These are the types of firms that investors should focus on in this environment. I do not believe we will see the companies that led in the last cycle leading in this cycle. We should be looking for companies that have an ROIC at least as high as the WACC:
and preferably above 1.5x
Back to our friend who was lamenting about the FOMO he was feeling watching his unskilled friends make money. One way I tried to crystallize this during this time was in looking at the performance of digital assets (namely Bitcoin and Ether) and using those as a signal of investor sentiment. When money was flowing into this space, I felt it meant there was broadly stronger investor risk appetite. We should see higher stocks and see NDX outperform the SPX. However, the flipside is also true. As digital assets have struggled, which is not surprising because they are long duration assets, so have tech stocks and so has the market overall. It is interesting to see the better price action in Bitcoin and Ether of late even though we continue to get more negative news from the space overall. When assets don’t go down on bad news, we should take notice. This goes back to Jesse Livermore and “Reminiscences of a Stock Operator”.
And this might be leading the NDX/SPX ratio, a pro-risk measure:
As I mentioned, the fundamental is negative but the technical is positive. Callum Thomas summed this up perfectly in this tweet:
What will get either group to change their mind? This is where the catalyst comes in. Earnings are the major catalyst over the next 3 weeks. The news from companies will give us more clarity on whether we are on a path to $180 earnings or $230 earnings. The bank traditionally lead off earnings season and JP Morgan led off the banks on Friday. Here is a summary of their report from Susan Katke at Credit Suisse:
It doesn’t sound that optimistic to me but the stock behaved well on Friday:
Again, when stocks don’t go down on bad news, we need to notice.
This could be because the sentiment on earnings has gotten too bearish. This is a chart from GS that shows earnings sentiment:
Citigroup also keeps track of earnings revisions at the sell-side level. We can see how downbeat those have gotten.
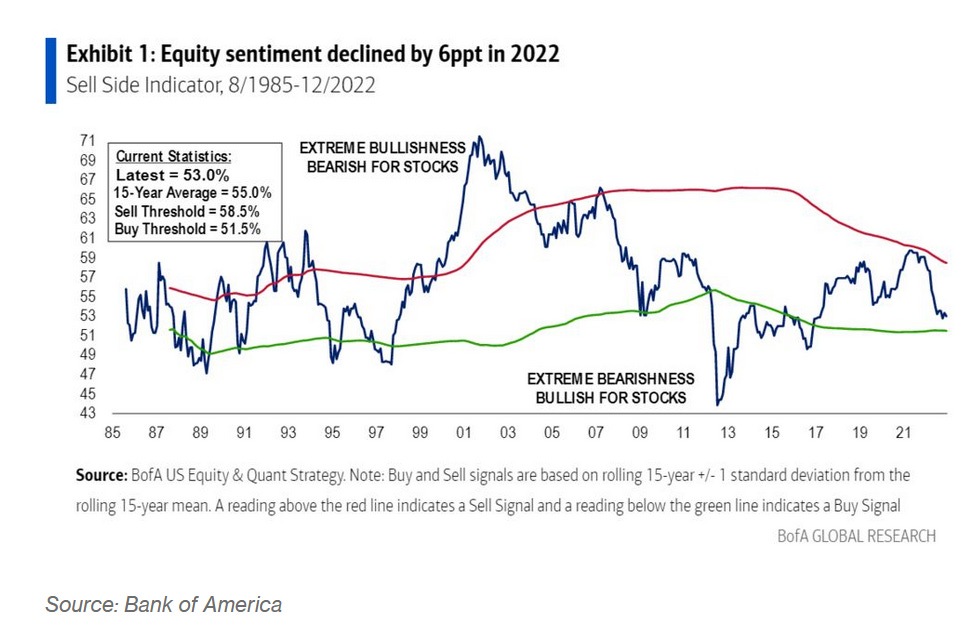
It isn’t just bottom-up analysts that are bearish but also top-down strategists. BOFA keeps track of a sell-side indicator that shows how bullish or bearish the sell-side is. It is a good contrarian indicator. It is also leaning bearish right now.
These points are in favor of the technical bulls vs. the fundamental bears. The proof will be in the pudding. Historically, earnings will come in better than expected and markets that trade poorly ahead of earnings will move nicely higher. We saw this in the latter half of last year. Will we see that this time?
Pushback from my playing companion was that we are in the third year of a Presidential Cycle. These years are typically positive. Perhaps this is what some (or many) are counting on. I personally think the new House is going to take steps to reign in spending, to slow down the transfer payments. The House doesn’t have a vested interest in helping the Biden Administration.
We are at a critical level in the market and at a critical juncture for the news flow. My models are giving conflicting signals so I will stay on the sidelines until the path is more clear. With some yield on cash, and the ability to sell calls against any longs or sell puts against my shorts and cash, I hope to earn incremental yield that adds to the money market yield. I hope to get paid to wait.
I don’t know how others are feeling but I don’t feel that investors should expect this to be a strong double digit positive year. I also don’t expect a crash or big double digit negative. I expect a choppy and rangy market, with the first leg lower, where anyone that can eke out high single digit returns should be happy to do so. I explained this view to the last group I played with. It is the analog of post WWII that I referenced a few times in this blog. This is the chart of that period again to show you what I think investors should expect.
Importantly, it is a time to Stay Vigilant (and thank you again Kayleigh).












I think we might be looking at a Wall Street recession and not a Main Street recession. This might be quite the opposite of the post GFC period - the jobless recovery. Now maybe it is a job-ful recession!
New logo looks great. Thank you for putting all the time into this post, very well thought out, and helpful.