Intrusive thoughts
The bond market is living rent-free in my head
An intrusive thought is an unwelcome, involuntary thought, image, or unpleasant idea that may become an obsession, is upsetting or distressing, and can feel difficult to manage or eliminate. This came up in a video I was watching by Mike Schmitz yesterday. As I watched, I thought to myself ‘I can’t get the price action of the bond market out of my head!’
I am sure there are worse intrusive thoughts. I have had many others myself in the not-so-distant past. However, this is the one that has stuck with me.
It started as I was preparing for a podcast with Barry C. Knapp from Ironsides Macroeconomics 'It's Never Different This Time'. I have mentioned his work before, and you really should follow it. This is the podcast we did for the CFA Society Chicago: https://cfasocietychicago.libsyn.com/macro-matters-barry-knapp-whats-going-on-in-the-bond-market
I know Barry really knows his stuff so when I have a conversation with him, I prepare like no other conversation. As I did so, I focused a lot on the bond market. Heck, we should all focus most of our time here. I tell all of my classes, from the “Finance for non-Finance Majors” to “Applied Portfolio Management” that if they know one thing, they need to know where the 10-year US Treasury yield is. it is the rate upon which we price every other asset class. It is the rate that drives the economy.
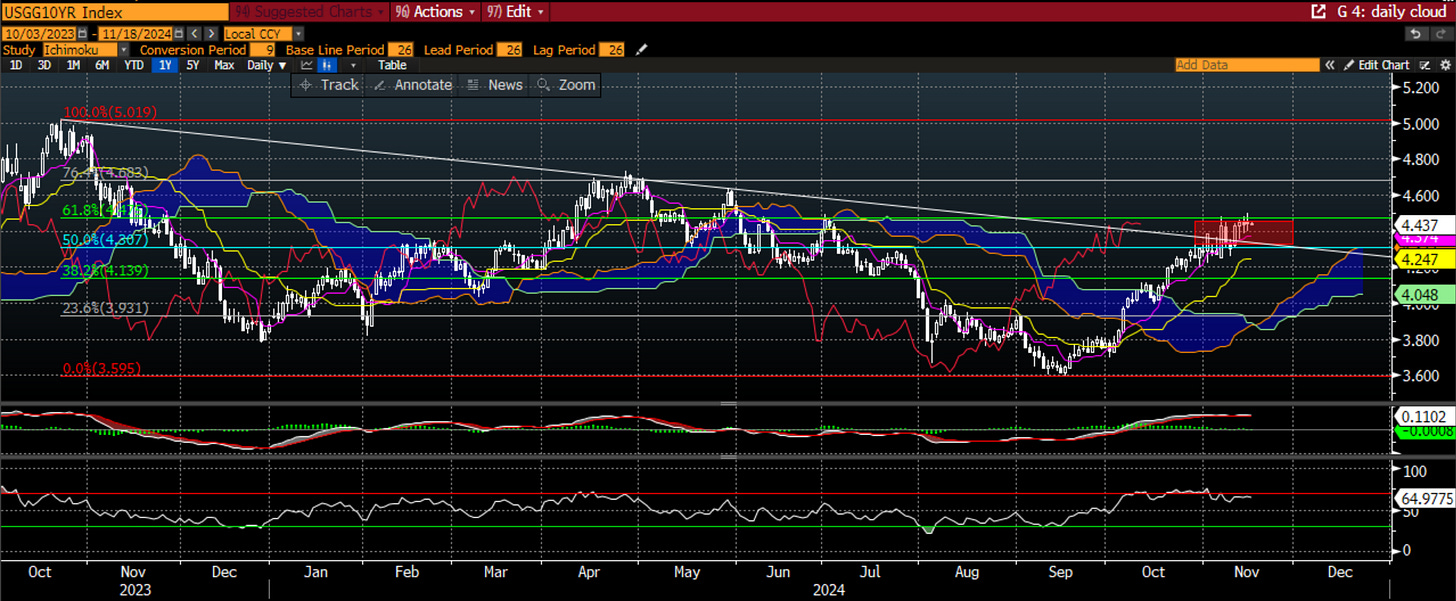
Lately, it has been going the wrong way:
There is a lot going on in this. First, the yield broke out above the ichimoku cloud, and the cloud itself has shifted higher identifying a new trend higher in yields. The yield also broke above the downtrend line that has been in place since the October high last year, that time that marked the low in the stock market as yields moved lower. Finally, it has run into near-term resistance at the Fibonacci resistance area of the 50-61.8% zone from the October 2023 high to the September 2024 low. It may consolidate in this 4.3-4.5% region for now, but there are meaningful signs that the bond vigilantes don’t like what they see in the US economy. What could that be?
I showed this chart in the “How Will You Vote” post. It shows that the Term Premia in orange and the Inflation Expectations in blue led the move higher in the 10-year yield. However, each of these measures have rolled over in the last few days, perhaps as the new Administration is espousing more discussion of cutting government spending than anything else at the moment. In spite of these measures pulling back about 15 bps combined, the 10-year yield continued to march higher.
I wrote about this chart on LinkedIn this week:
Chart of the Day - sticky inflation
The tailwind to markets of late has been the stronger than expected economy combined with the Fed looking to normalize rates. Better growth & lower cost of capital - who doesn't love that, least of all the small caps that I have been talking about this week?
I wonder aloud if yesterday's inflation number doesn't start to get some to think that maybe all of the tailwinds aren't still there. Sure, growth may continue to be good & with lower corporate taxes potentially, there is reason to believe
However, can the Fed continue to lower rates in the face of a CPI that is struggling to move back to target? My concern has been the re-ignition of inflation. While it did not re-ignite yesterday, it has continued to stop falling
I am probably more concerned about inflation than Barry is. We both agree that goods prices will most likely continue to fall. There is a concern tariffs will hurt however I think two things work against that
China's economy is a mess, and it needs to export just to keep people employed. Thus, unlike some others, I think China may bear more of the tariffs than academics believe
Also, since the 2018 trade war and 2020 Covid, companies have rationalized supply chains and can be more flexible where goods are sent from to avoid these
No, I am not worried about goods inflation, I am worried about other sources
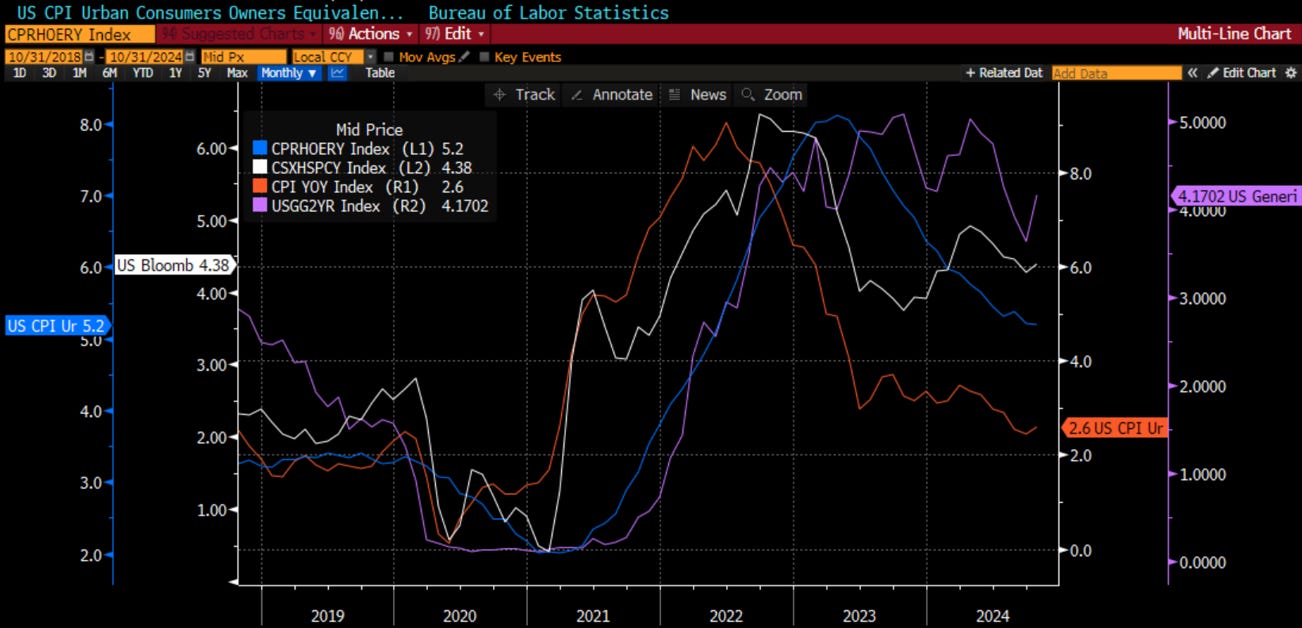
I saw a post yesterday that said, 'we don't have an inflation problem, we have a housing problem' Shelter inflation contributed 0.4% of the CPI yesterday. With supply not coming on to the mkt, this will continue to be a problem
The blue line is owner's equivalent rent. It is at 5.2% yoy. Your rents are still high & going higher. No sign of a slowdown. For many, this is their biggest cost. This will color people's opinions
The white line is the Super Core JayPo referred to before - Core CPI ex housing services. Otherwise known as wages. It came in at 4.38% and has been rising for a year. Workers are still demanding higher wages because it costs more to live
The purple line is the 2yr Treasury. It has moved higher perhaps reflecting the stubbornness of these measures & the difficulty the Fed will have cutting rates
The outlier? Headline CPI at 2.6%, still above target, but looking at the other lines, probably heading higher & not lower
Subsequent to the CPI release, we got other inflation data - PPI final demand and the import price index. Remember, above, I said Barry and I both agreed that goods prices would be falling, but maybe it was the ‘other things’ that could keep inflation persistent. Well, even the goods prices are heading higher and have been since last summer. Perhaps the bond vigilantes are sensing a turn in this gently falling inflation narrative.
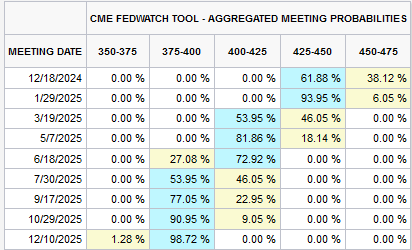
In the table above, you can see the short-term rates market is reacting too. The odds of a rate cut in December have backed off from a done deal to only 62% chance this past week. This was in response to Jay Powell saying the Fed has room to be more patient on further cuts. You can also see the terminal Fed Funds is now coalescing around 3.75-4%. Remember not too long ago it was around 3-3.25%. This is also supporting the bond yield right now.
The accumulation of Fed rate cuts is most easily seen in the 2-year yield, which itself has moved from a low of 3.6% to 4.3%, not quite the same move as the 10-year, but still quite the move. This is basically the 75 bps of rate cuts being priced out of the curve. So far, most of the action has happened in the bond market. Will it stay there?
The relationship between 2-year and 10-year yields is the yield curve as most people know it. Since September, not only have yields been moving but so the yield curve has been steepening. It has done from -20 bps to +14 bps in the past 6 weeks or so. Since June, it has moved from a low of -40 bps. This has put a bid in Financial stocks relative to the market. The big move post-election in Financials was thought to be de-regulation. Honestly, I am probably less optimistic about banking de-regulation because even if the new Administration wants it, I am not sure the Fed wants it. I am not even sure the big banks like JP Morgan want it because regulation is a barrier to entry for the SIFIs vs. the smaller banks since they have built up a large compliance and regulatory infrastructure. I think the move in Financials came down to the yield curve steepening, driving these stocks higher in both absolute and relative terms.
This is why I think the yield curve matters more than de-regulation. Financials have been outperforming for 2 months, coincident with the yield curve steepening, over a period when it was 50-50 presumably as to who would win the White House. Will the curve continue to steepen?
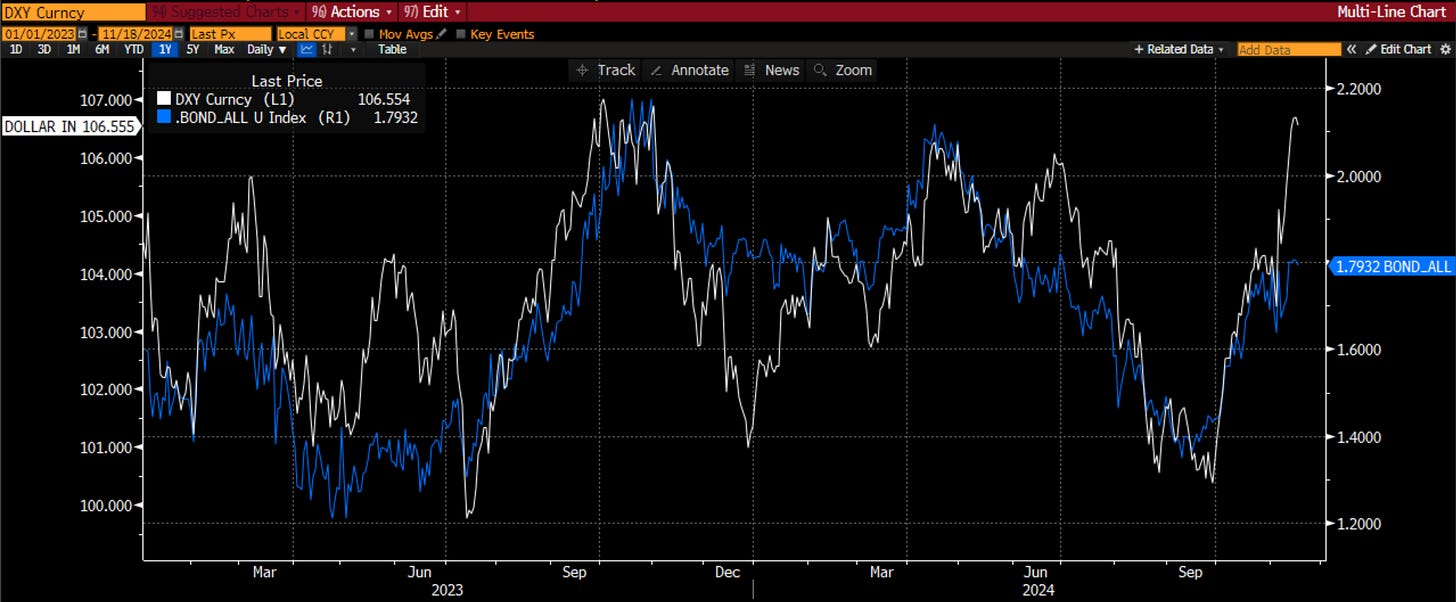
The move in the 10-year yield since September has also widened the spread of Treasuries vs. other major bond markets. The .BOND_ALL above is an average of the spread of Treasuries vs. JGBs, Bunds and Gilts. The move since September put a bid in the US Dollar, but since the election, the Dollar has taken on a life of its own as America First policies are thought to be giving it a big bid.
The Dollar also matters for the relative performance of US stocks vs. Emerging Market Stocks or vs. the MSCI World. If the Dollar is going to stay strong, capital will continue to flow into the US and support on a relative basis the US stock market. This may frustrate the many that are looking for the contrarian mean-reversion out of massively outperforming SPX and into other markets as the turn of the year happens.
The nominal US Treasury yield also directly impacts the real yields. Here I invert these yields to show the close relationship of real yields and gold. Historically there is a very tight relationship which has broken in the past few years. The relationship makes sense. Real yields indicate the cost of carry, and as it goes up, it is negative for gold, and as it comes lower, it is positive for gold. This all changed in 2022 (vertical white line), when the US used the SWIFT to seize Russian assets. Many other countries around the globe thought ‘if the US can do that to Russia, why not us?’ We have seen the move toward a BRICs currency. Whether or not that happens, we have seen foreign central banks buying gold which has broken the relationship with real yields. However, the red line is the election. Real yields higher and gold lower. Does the market think that Trump, as tough and blustery as he is, may change this hardline US stance on SWIFT and seized assets? Maybe something is changing. If so, gold could have a lot of downside given where real yields are.
10-year Treasury yields also impact corporate bond yields via a very direct spread, as well as forward earnings yields for stocks via the Weighted Average Cost of Capital we use to value stocks. With 10-year yields up, corporate bond yields have also gone up but not as much. Spreads have come lower, in fact near lows of this century. Can this persist? Even more glaring is the overvaluation of stocks vs. the 10-year, the so-called Fed model, as Alan Greenspan has referenced it. We shall see if the bond market can put a fork in these markets too, as the idiosyncratic corporate bond and stock markets have largely ignored the macro for several years.
Finally, the MOVE Index is the volatility index for the bond market. It tends to move higher and lower with yields. You can see it collapsed after the election, as all implied volatility markets saw prices lower with uncertainty out of the way. Is uncertainty out of the way for Treasuries? What if we head to 5%? The MOVE will head higher, and if it does, there is reason to believe other volatility markets will too. Because of the Value at Risk capital allocation that hedge funds use, higher implied volatility will require HF books to shrink as assets come out of the market. This could create a difficult trading environment.
This is not to say any of this could happen. Sure, the 10-year yield could reverse course next week, head back toward 3.6% and the Santa Rally will be in business. Small caps will benefit from this as well. If that doesn’t happen, or if even worse the yield continues to rally, things could get ugly across a range of assets. After all, the 10-year yield is the price upon which all other things are priced. I imagine you can see why I am having such intrusive thoughts about the bond market these days.
Stay Vigilant


