This week, I have Michigan on the mind. I am writing Stay Vigilant from our lake house in Michigan, with this being the first time we have gotten here this year. While it is still a bit chilly for watersports, the dock is in, and the budding trees & wildlife have the sounds of Spring. Interestingly, water levels are down this year, indicative of a mild winter which saw more water evaporate than usual. I am sure it will still be a good summer at the lake.
Michigan is also on the mind because this week is the NFL Draft. You may recall that I am a huge NFL football and a long-suffering Bears fan. Well, this week, in the first round of the draft, the Bears selected a player from Michigan - Colston Loveland. The opinions are quite mixed on the selection, but I have hope. After all, that is why the NFL Draft is so popular among fans of the sport. It is a time when every team has hope for a better season, for a chance at the Super Bowl. Those hopes may not be realistic (it would be nice though I don’t objectively see the Bears in the Super Bowl) but hope fuels us all. Unfortunately, hope is not a good investment strategy.
Michigan is finally on our minds because the University of Michigan surveys came out on Friday. While there is once again some disdain for surveys of all sorts in the market these days, preferring ‘hard data’ to the ‘soft data’ of surveys, in a period in which there is so much back and forth of headlines and policies country by country, trying to have a more real-time finger on the pulse of how consumers and companies see the world has value in my mind. The headline sentiment index came in better than expected even though the trend does not look so great. The story suggested how the tariff delay gave some reason for a little more hope. This graph might easily be that of a Bears fan sentiment for the team.
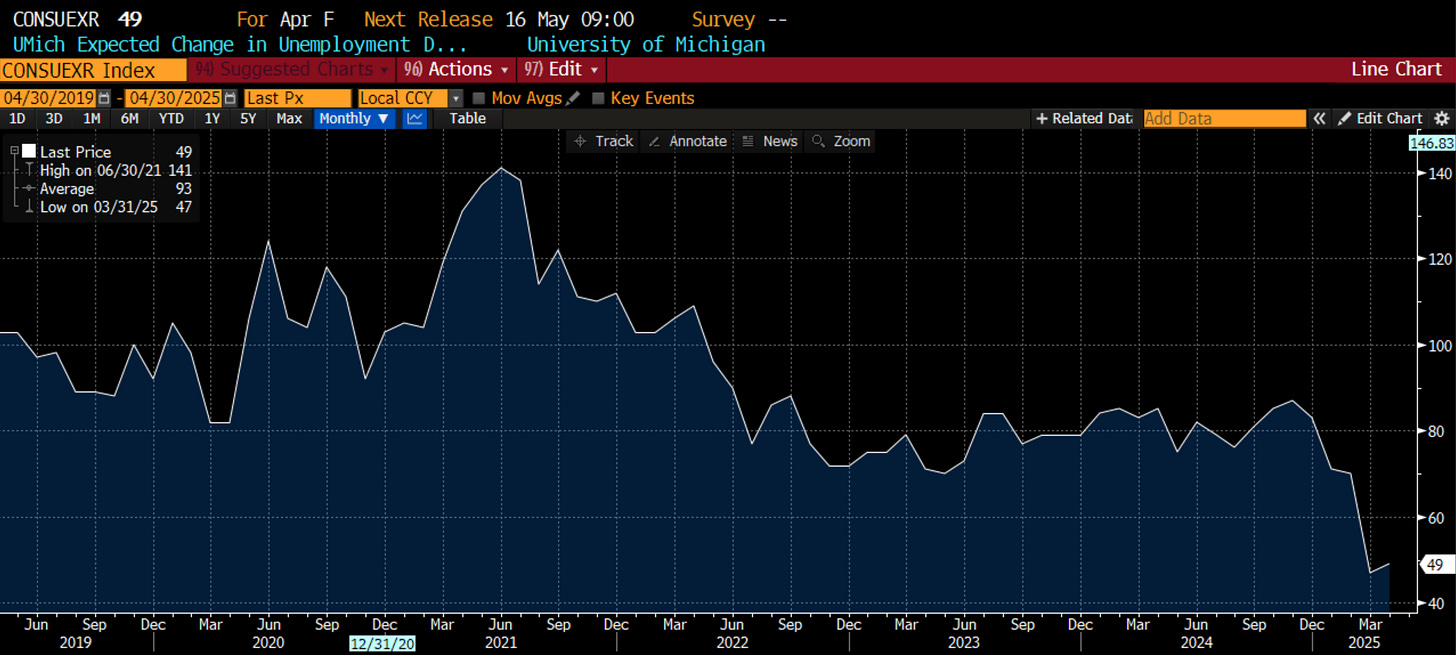
As with most of the survey data, I find the components as interesting as the headline. I particularly focused on the components that are more closely tied with Fed policy. I think a major risk for markets is that the bond market and the Fed are out of synch. Jay Powell is saying the Fed will be patient in moving rates. The Dot plot consensus suggest two-ish cuts this year, but the dissenters are looking for higher not lower rates. What will impact this? Jobs and inflation since the Fed have the dual mandate. Thus, I found it interesting that the University of Michigan survey for expected change in employment in the next year is still near the lowest readings since the Great Financial Crisis.
I couple that with the survey expectations for inflation in the next year. This reading continues to move higher, coming in at 6.5%. For some perspective, this is the highest reading since the 1980s. Some will point to the volatility of the survey and suggest this is bad data, an outlier or simply fake news. However, inflation expectations matter for inflation itself. Perhaps this is why the Fed is so reluctant to ease.
This is corroborated by the consumer experience. Bloomberg had a good podcast on the effectiveness of the bacon, egg and cheese index. I didn’t realize Bloomberg had such an index, but the podcast went into each piece and interviewed people to discuss why trade, tariffs, weather and other issues are contributing to price increases that everyday folk probably experience several times a week. The index has started to accelerate higher. Since inflation was a major issue in the last election, expect the media to stay focused on this.
Not surprisingly, too, with the media focused on these issues, it depends on which media you watch. As always, whether the Party you belong to is in power or not is indicative of how positive or negative you are. Another component of the Michigan data shows sentiment by Part. Republicans are more upbeat than any time since Fall of 2020. They are not so positive as to offset the negativity of Democrats, which has plummeted as you might expect. The most interesting to me is that Independents are also getting more negative. This bears further watching.
So as to not let Michigan get all of the hype, I want to look at other survey data that has come out. Ahead of the ISM which we will get this week, regional Fed surveys from NY (Empire), Philadelphia and Richmond have hit. The Empire manufacturing bounced a small bit, but the other two surveys fell pretty sharply. We will get the Chicago and Dallas Fed surveys before ISM, but the early look suggests that the ISM is going to come in weaker again.
But this is all ‘soft data’ so I want to look at ‘hard data’. The Atlanta Fed does a nowcast that looks at the data which feeds into GDP in a real-time fashion to give a leading look as to where GDP will come in. GDP may be hard data, but it comes out so late, and is subject to so many revisions, that I do not find it particularly useful. Others do so let’s look at it. While the late February drop has been explained away by stockpiling of commodities and metals ahead of tariffs, the data continues to move lower. Could this be the first quarter of two or more negative quarters?
The Fed has a dual mandate, though. How does inflation look? The Atlanta Fed also does a nowcast for PCE, the Fed’s preferred measure of inflation. It had plummeted as well in February, but is bouncing back higher.
Lots of stagflation vibes in the data. Recall the market thought about stagflation for a short time in February and early March before going straight into recession mode. It does feel like the bond market is still very solidly in recession mode. Is that the right place? Still might be in stagflation so I thought it would be useful to get a summary of what Fed officials thought was the correct policy in stagflation. The punchline seems to me that in a period when growth may be weak, but prices are high, the Fed will error on the side of quelling price issues and risking a weaker economy.
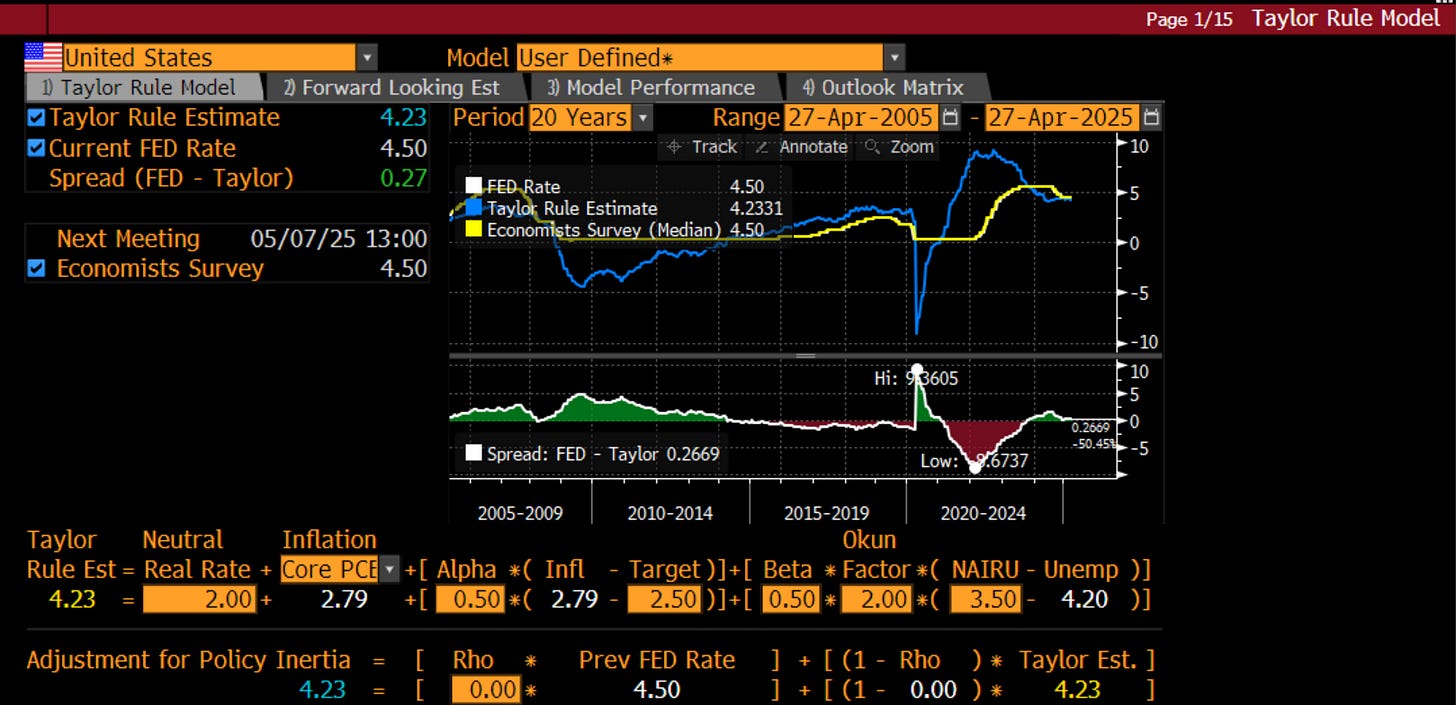
Let’s say we were to get rid of Jay Powell and the Fed (I know, seems like an outlier of an idea), and use an algo instead. The O.G. of Fed algos is the Taylor Rule, which attempts to suggest what the proper policy rate should be given a variety of assumptions and taking into account the dual mandate. Simply taking the default expectations, the algo would suggest a rate of 4.23%, not far from where it is right now. Is the Fed policy rate really out of line given we are still so far above the targeted inflation rate?
Like I mentioned, the bond market sees it differently than the Fed. This makes two things important - data and Fed commentary. If the data come out in such a way as to feed the Fed’s concerns, expect more hawkish commentary to get the market more in line with the Fed’s preferred policy path. This would be a risk for markets like equities, which is why I was glad to take profits on the bounce and move back to the sideline, as I wrote on LinkedIn this week:
Chart of the Day - round trip
About 2 1/2 weeks ago, I said I thought markets were bottoming near-term. We had quickly gotten to levels of panic and there were signs of exhaustion in prices
The VIX had gotten to absolute and relative levels indicative of previous bottoms. The VIX futures curve had backwardated to levels of exhaustion
Bitcoin, which to me is an early risk-on/risk-off indicator, had begun to rally again. It had preceded stocks in the sell-off & was going to precede in the rally
That was 10%+ ago. Now, I think the market is more balanced & importantly, the reward to risk is no longer favorable
You can see that the market is now trading in a descending triangle pattern. In addition, there is resistance at this level which is where previous support was that was broken
While earnings have come in better than expected, forward earnings expectations have come down a bit. I think there is still scope for these to come down more
However, even if forward earnings stay at $265, I think the forward P/E that we can apply is at most 22x. This puts the SPX at 5830 up 6% from here. My sense is there is potential downside in both the multiple and earnings from here even if the trade news has been better of late
One can't rule out a return to the lows, even if it is at a slower pace than the first move lower. Catalysts could be the aforementioned earnings revisions, a stubbornly hawkish Fed, or a random tweet after a bad weekend
A move back to the lows at 4830 is 12% lower from here
So 6% possible upside, risking 12% downside. As we discuss in my Academy classes, that is not attractive reward to risk. As such, I am exiting the trades I entered back on April 7
As I discussed two days ago, I think there has been real damage done. Global investors are, even if just at the margin, less likely to want to flock back to the US en masse. There are other stories outside the US to invest in and the level of uncertainty has gone higher
Also, while not every CEO is downbeat, there is still a common theme of uncertainty. That is suggesting this quarter's GDP is close to 0% if not lower. Could it bounce back? Yes, but that will still leave a mark
Earnings follow the economy and stocks are driven by earnings
Finally, consumer sentiment has plunged to levels last seen at 2022 which are among the lowest this century. Consumers drive the economy
Thus, I say thank you very much to the market. I got my round trip trade. Now I will sit back & wait for better entry levels & clearer catalysts
Stay Vigilant
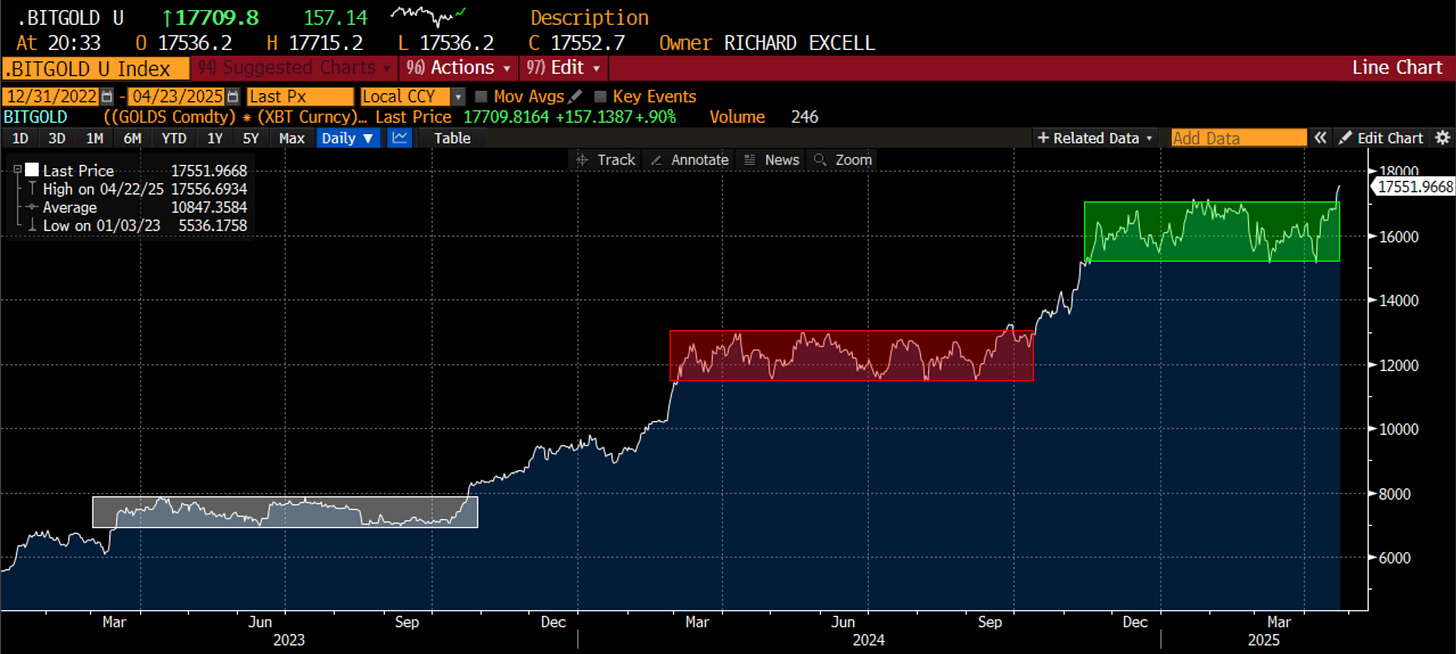
What does that leave us to invest in? Besides money markets which still earn an attractive yield? I wrote about the Bitcoin and gold index this week because it continues to have pretty steady and remarkable returns:
Chart of the Day - should I buy more gold or buy Bitcoin?
I have talked about this before. Gold bugs and Bitcoin maximalists both see the world in largely the same way. Ironically, they seem to hate each other
I have always advocated a 50-50 ownership of each. There are times when one is in favor and the other is not and vice versa
In reality, since institutional investors got involved, Bitcoin does act more like a volatile risky asset than a stable store of value. However, in a world that is trying to find an alternative to Dollar assets, both gold and Bitcoin have a place at the table
Thus, I go back to my 50-50 allocation
Consider the chart today. This is that allocation. Look at the last few years. There are two things this trade has done - gone sideways or gone higher
What if I told you there is some asset that has either gone sideways or higher the last several years, and which is levered to the trend of a lower dollar and an allocation out of dollar assets?
You might like it
Then if I said it is 50-50 gold and Bitcoin I would get about everyone to tell me I am an idiot: gold bugs will hate the Bitcoin, Bitcoin maximalists will hate gold, traditional investors will hate both & some will add that I am some tinfoil hat wearing lunatic
However, the tape don't lie as they say
———————————————————————————————————
Spring, green shoots, NFL dreams, hope. This time of year is full of optimism. At the same time we are planting a garden, we are preparing for weeds that will choke the plant & animals that want to eat the food. At the same time we are excited about the new players on our team, we are worried about other weaknesses on the team that still need to be addressed. So it is with our portfolio. At the same time we have risen from the lowest levels of the year, and we are inclined to put money to work, we need to focus on the risks that may still linger.
Stay Vigilant


"What's good economics is bad politics, what's bad economics is good politics." Eugene W. Baer 1978.
That bacon egg and cheese sandwich podcast episode was a fantastic listen. One of their best recent episodes, imo. Cheers!