Positioning & sentiment
Wednesday's FOMC meeting may be the last catalyst until late July. If there is going to be volatility, this is when we should expect it. How are people feeling ahead of this important event?
Summary:
A briefer note this week as most of the story has not changed for us over the previous few weeks.
I look through the market more technically than fundamentally to get a sense of how the catalyst may move the market based on trends and positioning.
I also look at markets outside of equities since this event will have an impact on all markets.
This year on June 14 we will be looking forward to more than just Flag Day and my birthday eve. This year we will also be looking forward to one of the more anticipated FOMC meetings of the year. The expectation for Peak Fed, which has gone through a few fits and starts, has the potential to be cemented into place or largely disrupted by an FOMC that may once again want to assert its hawkishness.
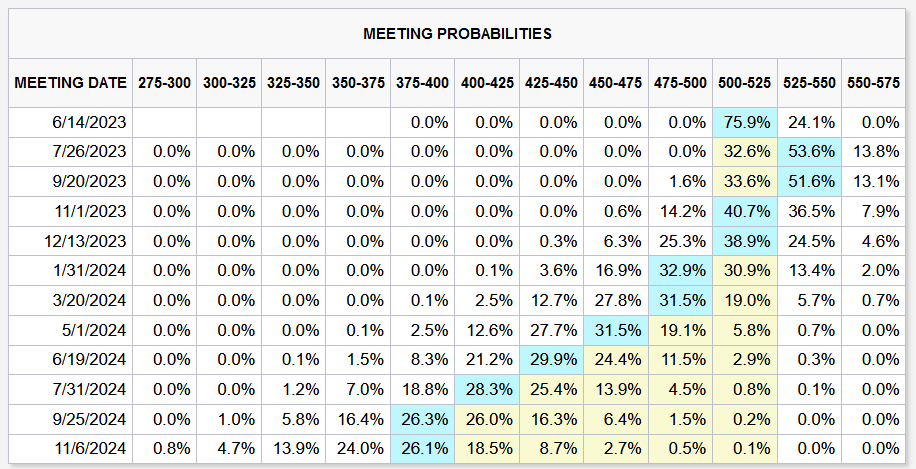
Heading into the meeting, we can see there are low expectations for a move, more of a pause with greater possibility of a hike in July.
The market has gotten more dovish on this in the last 2-3 weeks because the odds of a hike were closer to 50-50 at the end of May. This may once again be why riskier assets are heading higher.
Using the CME Fed Watch Tool, we can see the distribution of expectations at each of the upcoming meetings. The market is still eyeing Peak Fed, just not until the Fall now as recession expectations have been pushed back to Q4. I myself am guilty of that same notion. I thought the recession would have more clearly begun in Q2. I am on record as saying late Q1 but most likely Q2; however, I clearly have egg on my face.
Unlike some prognosticators that have not just pushed back the forecast of recession but have gone back into the no-landing camp, reducing their odds of one occurring at all, I still think there are headwinds in front of us. I think this is an important distinction because one can still trade from the long side knowing there are headwinds, but I think these headwinds mean a new bull market is less likely. Why do I think that? As I wrote in a note on Friday called Pushback, it is not just the cost of capital but the availability of capital that is the issue here. We wrote about that during the bank crisis in March, saying that the credit tightening will do the work of the Fed from here. If we look at mortgage spreads or the Senior Loan Officer Survey, this is happening before our eyes. The one place it is not happening is in the credit markets, as we can see credit spreads are very dislocated from all other measures. As these tightening measures move higher, recessions have always occured.
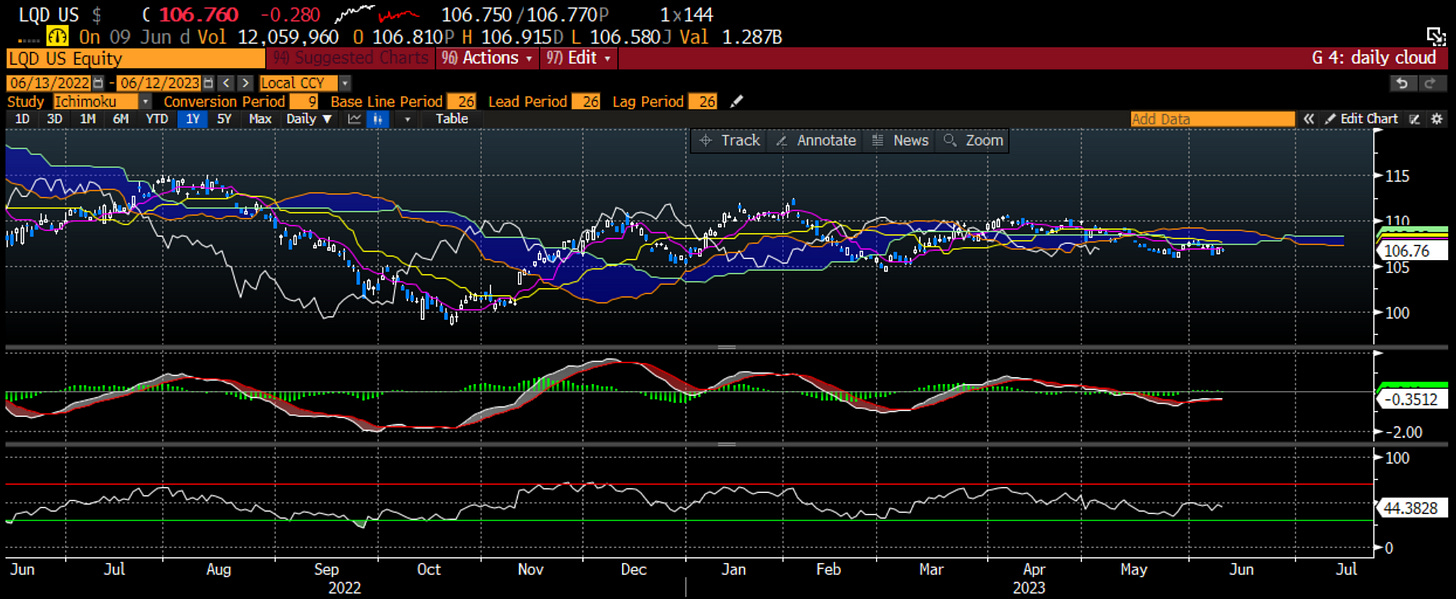
If we look at the price action in the bond market, and for this I will use the ETFs as that is the only place we get some transparency, we see that the investment grade bonds have been narrowing into a very tight range and may be starting to press lower. Could this week be the catalyst for that?
A slightly more bullish picture in High Yield. It has still narrowed into a tight range, but there looks like a possibility of a break to the upside and not downside in HYG. Again, there is a catalyst this week and I would find it unlikely that investment grade breaks down and high yield rallies. One of these markets will be proved wrong.
Within the equity space, a different dynamic is occurring, as Quality has been sought all year long while momentum has struggled. The low vol factor has given no strong signal this year. The strongest sign is that in an untrusted market, perhaps, investors are seeking quality, which just so happens to be full of mega cap tech stocks too.
What about growth vs. value? For these factors I think one always needs to be careful. If one just quotes the headline growth index vs. value index, you may get a skewed view of what is happening because those indices may also have sector tilts. In this chart I have the growth vs. value in orange which is S&P measures but they include sector tilts, for example growth is full of tech and value is full of energy and financials. The purple line is the sector-neutralized measure of growth and value. On this front we get a very different picture of what has happened. We also see that this measure is tied to the US 10 year yield somewhat.
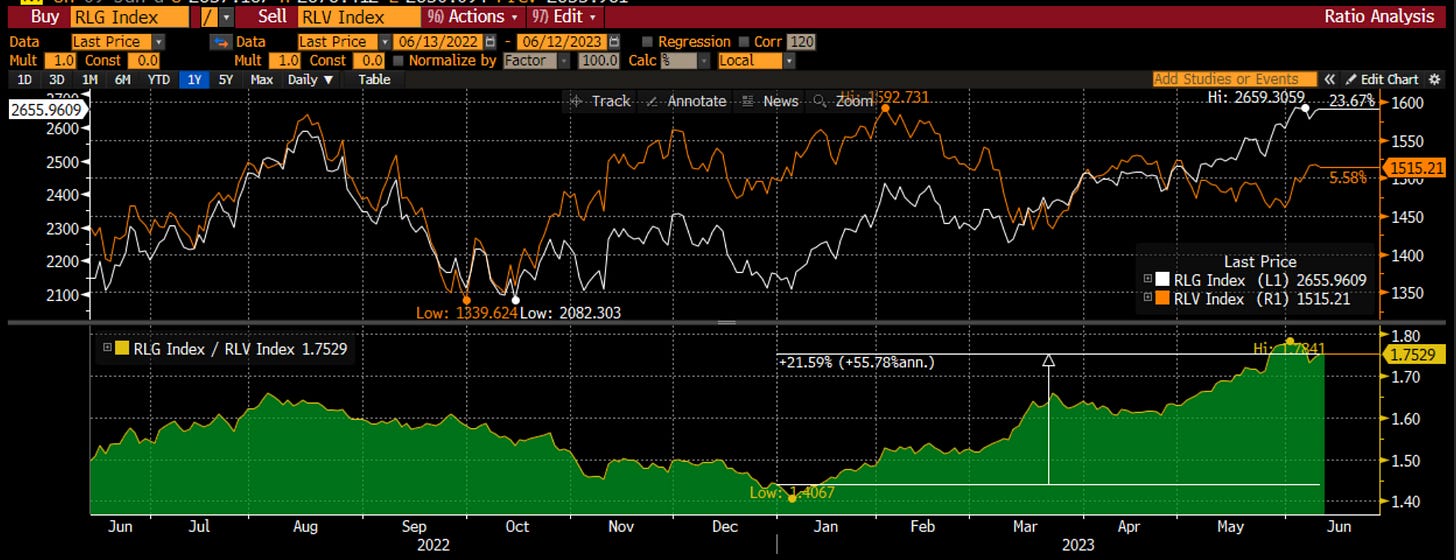
The biggest discrepancy is in the Russell 1000 growth vs. value. You can see 20% of outperformance in growth this year. However, again, this is neither sector neutralized nor size neutralized. It is another sign mega cap tech is driving the bus.
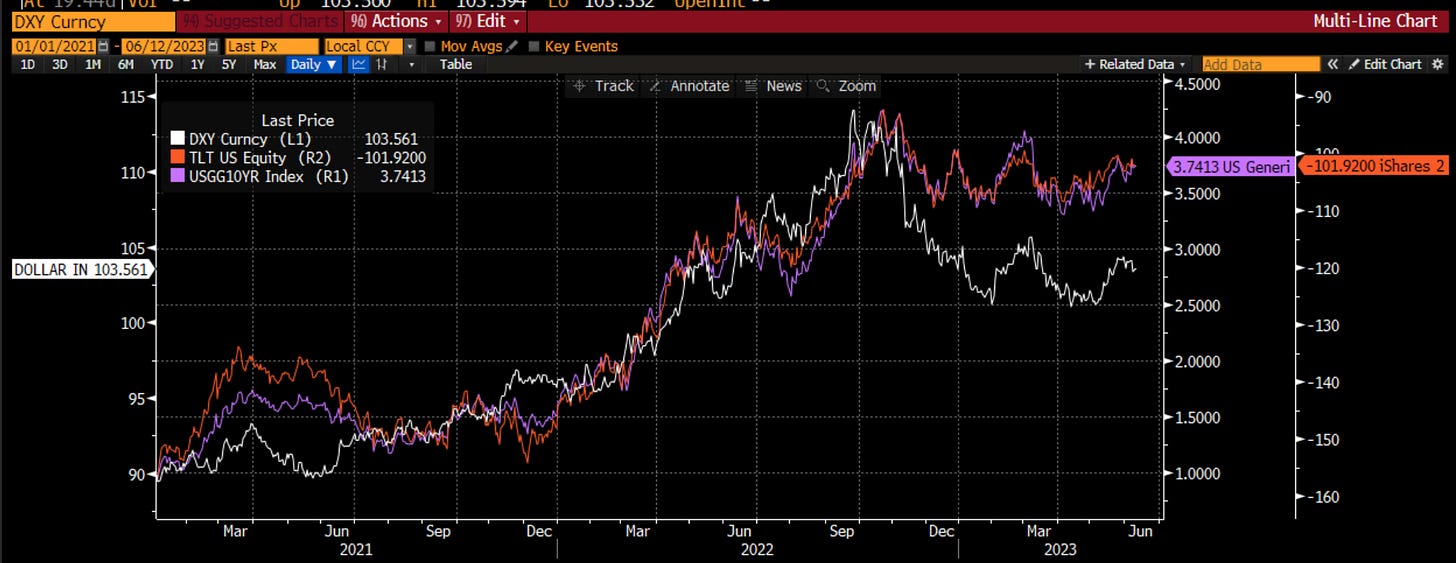
If growth vs. value on a sector neutral basis has a link to the 10 year, what is happening in the bond market? Pretty much sideways action whether we look at the 10 year yield or the TLT ETF which has a longer duration but is also where more of the action for investors takes place. Since the lows back in October, one interesting development is that the dollar has dislocated from the longer term bond market and has been trading a little weaker, feeding the notion that maybe we have seen peak dollar. I am not in that camp but one can see how and why the narrative exists. This is worth watching if this dislocation perists.
The dollar is not the driver of the next relationship but there is coincidence. When the investors are favoring US assets, we see the dollar strengthen with money moving into the US. As investors feel safer to take risk around the world, the dollar weakens with money flowing to different regions. In spite of dollar weakness, we see US stocks outperforming both the developed market peers in blue but also the emerging market peers in orange. Another development worth watching.
Speaking of giving up on the dollar, Bitcoin has typically benefitted from weakness in or lack of faith in the dollar. The daily chart of Bitcoin is starting to break down. Some will point to the SEC regulation etc. One could argue this regulation is a net positive as it is a necessary pre-cursor for the return of institutional investors. Bitcoin has also rallied with the problems in crypto. My sense is there is another driver of risk-off in crypto.
We see this as well in Ether, my preferred crypto and my preferred place to have risk (instead of tech). This chart is also breaking down and you may see shorter-term money getting out with a move back to 1000-1100 potentially in the cards.
It is not just crypto that is trading poorly. Commodities are also trading poorly across the board as investors are betting on slowing global growth. Whether we look at the CRB Index, the CRB raw industrials (untraded commodities) or the Bloomberg commodity index, all are down on the year and down sharply from early 2022 highs. Copper and oil in particular look quite weak. Yes, this may help on the goods inflation front, but will this level of global growth slowdown help risk markets?
Even the safe haven in commodities - gold - has started to weaken. After hitting a double top around 2050, gold is back below 2000 possibly feeling the weight of real yields in blue. Here I use the 5 year real yield from the TIPS market and invert it. This suggests meaningful downside in gold, especially if the FOMC is higher for longer.
Not to be too much of a downer, we can see that equity investors are not quite so downbeat. One measure I have always liked is the AAII Bull minus Bear metric. We can see whenever we get above 30 or below -30 we know we are near extremes. The latest reading of 20 is getting close to an extreme in bullishness. Interesting side note is that I drew a regression line over the last 23 years of data and ever so slightly we can see that on average, investors have been getting less upbeat the entire century. This is especially true post GFC. There is still quite a bit of movement around that trend but it is interesting to notice.
It isn’t just this measure of exuberance. CNN Fear and Greed Index looks at several measures of risk-on/risk-off to determine and overall measure of fear of greed. The latest reading is in “Extreme Greed” vs. Greed a month ago and neutral a year ago.
Looking instead at the time series over the last year, we can see that we have been trending more greedy since last summer. Notice where those peaks in extreme greed have been and what the market has done at those points.
The short-term trading signal is still positive based on the options market. The moving average of the put call has yet to turn higher. When it does, it could be a good sign to hide for a while given how bullish equity investors appear to be.
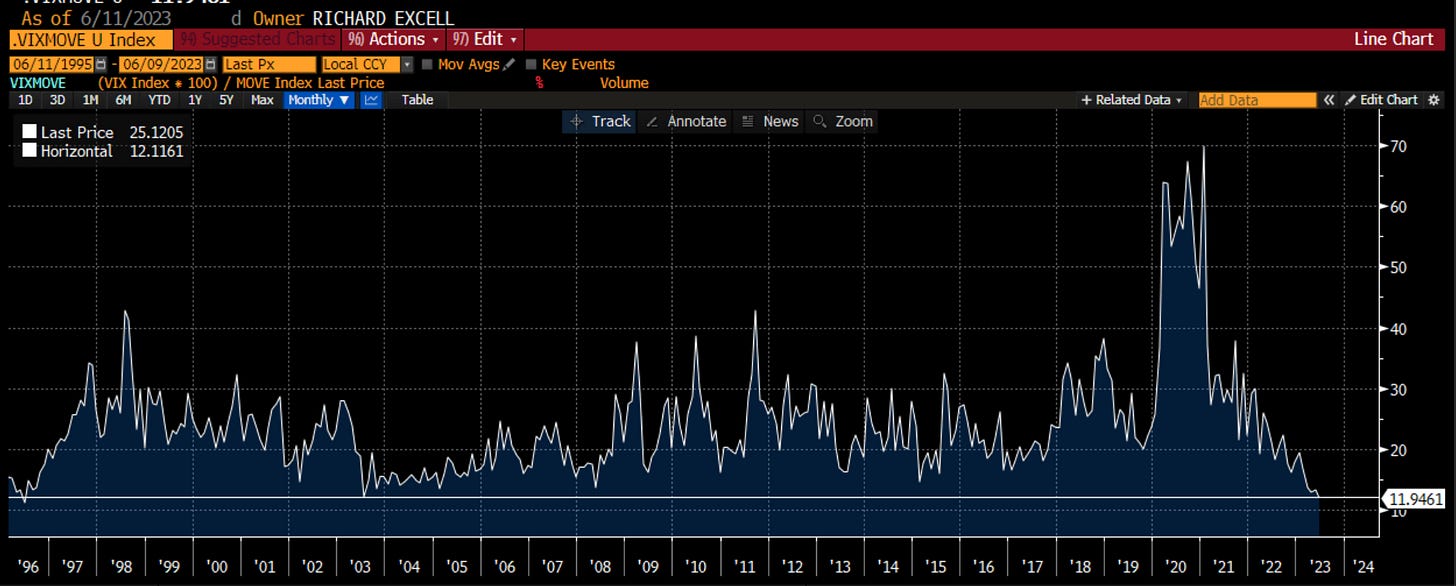
This is particularly true when we compare the equity options traders (VIX) vs. the bond options traders (MOVE). This ratio is at the lowest level it has registered in the last 30 years. Interestingly, when it hit these levels in 1996 and 2003 it was a good time to add risk. Will it be again?
Parts of the market are greedy (equities, high yield) and parts of the market are downbeat (commodities, investment grade). After the FOMC this week, one might think this catalyst brings many measure back into line since there are many things that are standing out. I will leave it there and look to spend more time once we get the new information on whether we will see higher for longer or not. Importantly, we will get a chance to see how investors react in the various markets.
Stay Vigilant








Everyone has an opinion so here is mine. I am extremely negative on the market for the next 4-6 weeks. Options markets have the lowest implieds in the last couple of years on event risk days of CPI and the Fed. June expiration gamma may be the reason keeping prices pinned. In the background is major capitulation across the street from their strategists into the bull camp. Meanwhile, like the P/C, there are many shorter term warning signs. One suspects in a de-risking scenario, that tech and quality gets smashed and that deeper cyclicals like banks and energy hold up. The other thing that I am watching out for is a downward cycle in bond yields which fits a long held pattern of mid-year reversals. Obviously that needs help on the inflation and economic data front to materialize.
Great write up as always!
Just wanted to know that do we have any ETFs tracking the index which removes the tech bias (sector-neutralized measure of growth and value as you mentioned)?
PS: Until shit hits the fan (spreads blow up significantly), LQD and TLT pretty much move together.