
Reset


As I said last week, I really had no idea how the market would take the news last weekend. Suffice to say the market took it well. We ended the week at the highs for the week, month and year. With quarter end on Monday, there may be even more buying before traders square up their risk ahead of a long holiday weekend.
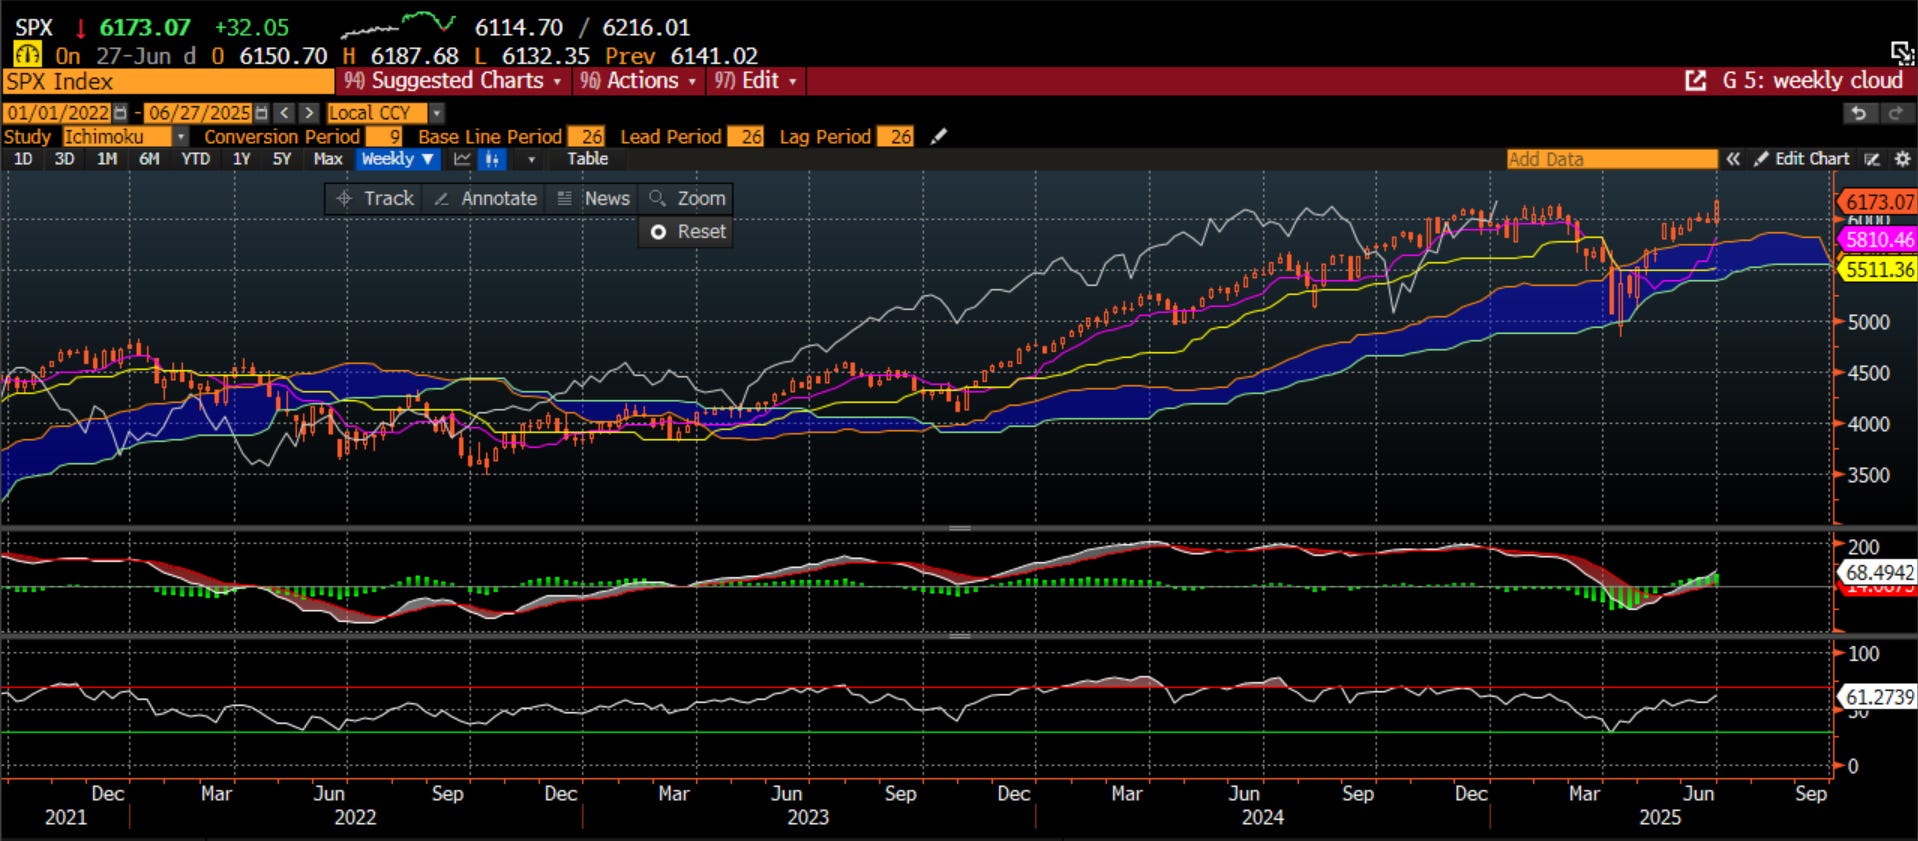
In fact, looking at the long-term chart of the market, we can that the April sell-off found support exactly where we would expect in the ichimoku cloud, and has not moved up through it supported by strong MACD and RSI measures. This is a strong technical picture.
However, like many, it is still difficult to square the circle of all of the news which on the surface seems so negative, but with risky assets driving to new highs. When in doubt, trust the process. My process has always had three parts, where I go through scores of indicators to help determine the Fundamental, Behavioral and Catalyst scores which will then give me an idea of how the market may take shape the next month. I call this the reset. So, this week, I decided to hit the reset button to try and make heads or tails of what we are seeing. Here it is in abridged form.
Fundamental
The economy drives earnings and earnings drive the stock market. What drives the economy? There might be many different answers, but the one thing I find that encapsulates all of them is the measure of financial conditions. Financial conditions are very important to the U.S. economy because they influence the cost and availability of credit, asset prices, consumer spending, business investment, and ultimately economic growth and inflation.
Why are financial conditions important:
The transmission of monetary policy: when the Fed raises or lowers interest rates, it does so to impact financial conditions. For example, higher rates lead to tighter financial conditions which reduces borrowing and spending bringing about lower inflation. The Fed would look to lower interest rates if it felt conditions were too tight and it wanted to spur more borrowing and spending, driving inflation higher.
Impact on borrowing costs: easier financial conditions mean not only that rates are lower but also that credit is more available, helping consumers with mortgage and auto loans and small businesses afford loans enabling them to grow.
Influence on wealth and spending: easier conditions drive asset prices higher leading to a wealth effect for consumers that see their equity portfolio grow, and leading to more animal spirits from companies because of growing confidence.
Predictive power: financial conditions are a leading indicator of the economy and therefore markets.
It is with this in mind that I wrote about them on LinkedIn this week:
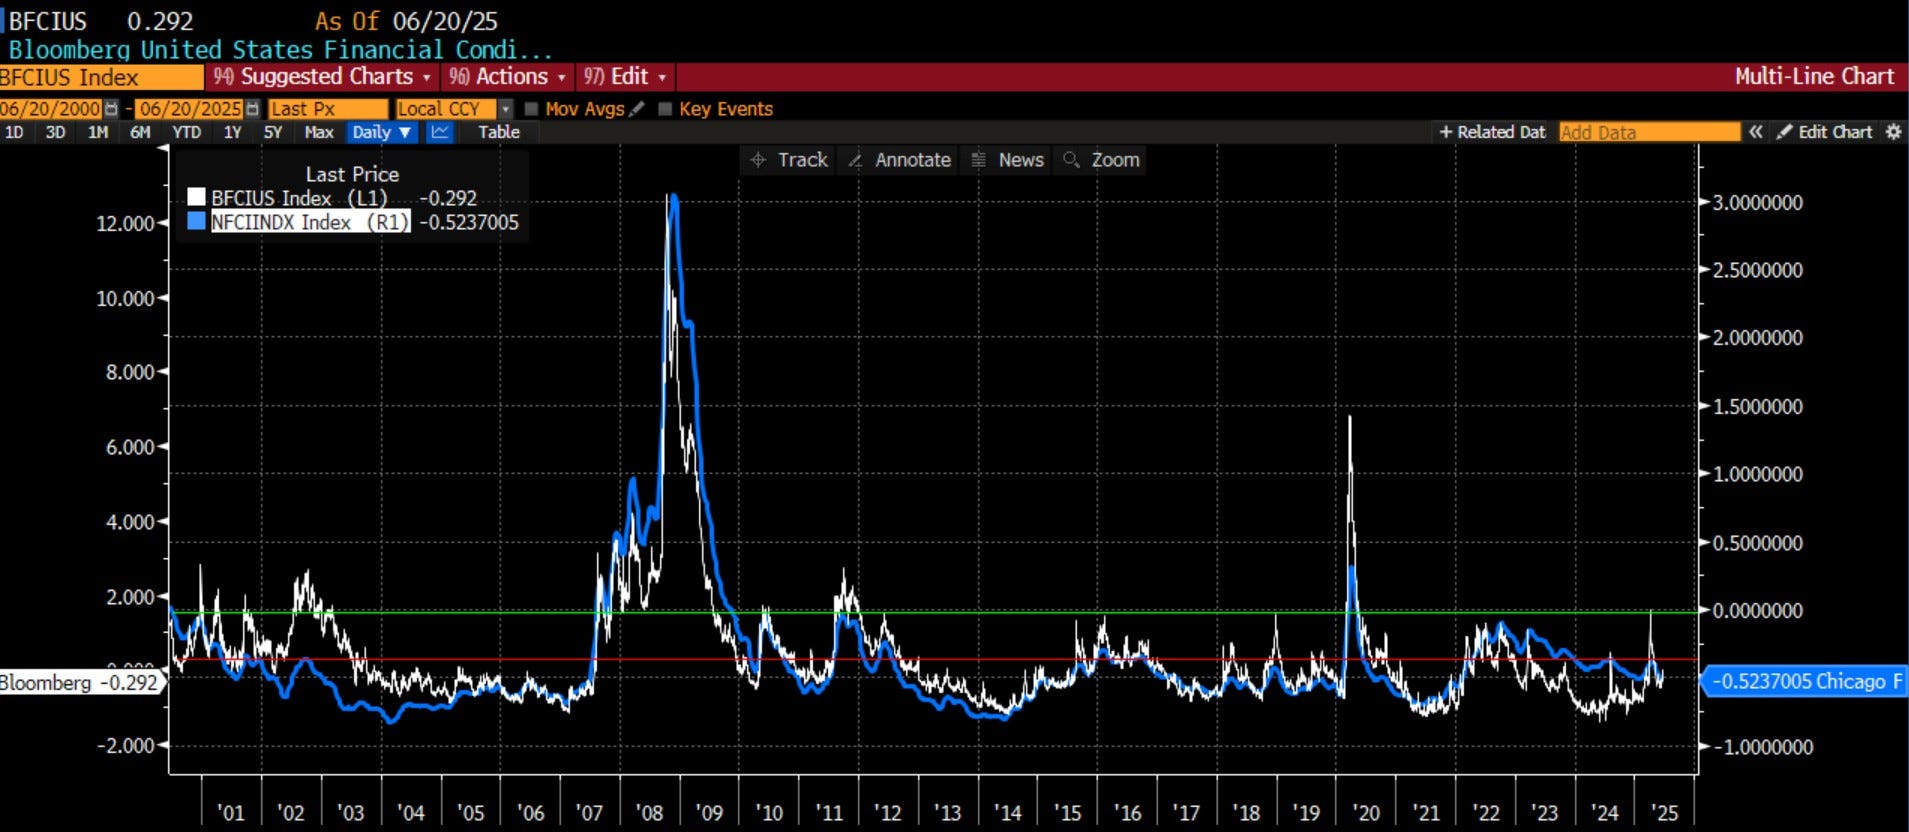
Chart of the Day - financial conditions
There is no better anecdote that financial conditions are easy and supportive of risk taking than seeing bombs dropped on nuclear facilities in Iran on Saturday, and coming in on Monday morning to see stock prices higher
If investors were fully invested, you would think that even some trimming of positions would cause weakness
If there were no dry powder on the sidelines, you would think that there was nothing left to put into the markets
When markets don't respond to bad news, it is indicative the bulls are in control of the tape. Bulls need liquidity. Easy financial conditions provide that
Case in point - the chart today shows two measures of financial conditions
The first, in blue, is the Chicago Fed National Financial Conditions Index. NFCI is "constructed to have an average value of zero and a standard deviation of one over a sample period extending back to 1973. Positive values of the NFCI indicate financial conditions that are tighter than on average, while negative values indicate financial conditions that are looser than on average."
The second is the Bloomberg Financial Conditions Index. "All of the indicators included in the composite BFCIUS index are normalized by subtracting the mean and dividing by the standard deviation for each series. The mean and standard deviation are calculated from observations during the pre-crisis period, which is defined as the period from 1994 to July 1, 2008. The normalized values are then combined into the composite BFCIUS index, which is itself normalized relative to its pre-crisis values. As such, the BFCIUS index is a Z-Score that indicates the number of standard deviations by which current financial conditions deviate from normal (pre-crisis) levels."
You can see how each spiked in the Great Financial Crisis and Covid Crisis indicating tighter financial conditions. You can also see if you zero in that they are currently 1/3 to 1/2 of a standard deviation below what is considered to be normal
Sure, conditions were easier back in 2021 but conditions right now are the easiest since the Fed starting hiking rates in 2022
Lastly, I have drawn a couple lines. The green line is the '0' line for NFCI. This is what is meant to be the mean for the series as it is designed to have a mean of 0
The red line is the actual average value for financial conditions this century. You can see that on average, financial conditions this century are always easier than normal, except in times of crisis. Even the Liberation Day 'crisis' only got us back to normal, not into tight territory
So, for those calling on the Fed to lower rates, to ease financial conditions, you do not have the data on your side. If the Fed does lower rates, as the dot plots may indicate, that would risk bringing in inflation shocks to the system as the market doesn't need the support
Just look at the price action today
Financial conditions are easy; asset prices are at all-time highs. While this probably suggests that the FOMC won’t lower rates in spite of many Fed officials queueing up to say they might, it is entirely unclear to me that the market even needs or wants lower rates. In fact, rate cuts may spur higher inflation which would have a counter effect. Suffice to say, the fundamental portion of the market and economy looks fine.
Behavioral
The next portion of the three-part process is assessing the supply and demand of the market. There are many indicators that I look at but I think right now, there is really only one thing to focus on and that is the systematic flow in the market. The sell-off in April was driven by institutions forced into selling because of higher volatility. Retail bought all the way down. We don’t need to guess what retail will do. What will institutions do? I wrote about that on LinkedIn this week:
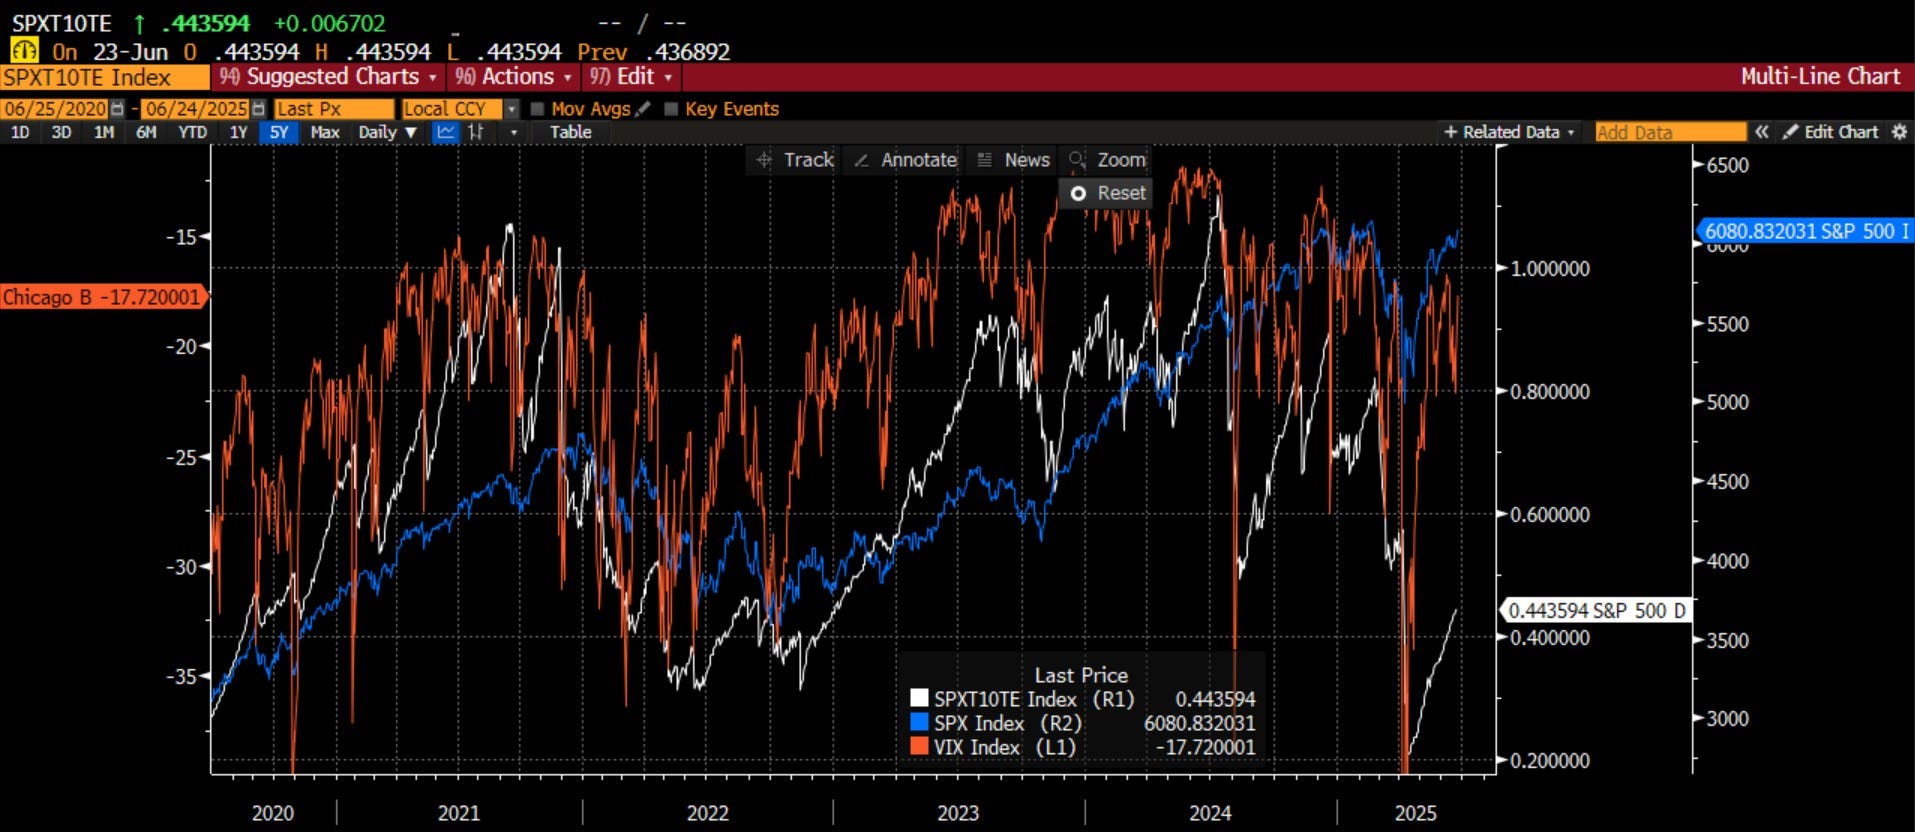
Chart of the Day - technical buying
This does not have to do with traders or investors buying the market because of technical analysis. There is some of that too though
This has to do with the systematic buying or selling that goes on in the market on any given day. By many estimates, passive and systematic strategies account for 60-80% of the volume/positioning in the market on any given day. This does not include high frequency trading where the volumes are large but net position taking is quite small
What about all of those fundamental investors? Around earnings catalysts, you will see more activity from the hedge funds and mutual funds, but outside of the catalysts, the market is driven by systematic trading
One of the biggest sources are vol control strategies that relates to risk parity investing. I have discussed these before but as volatility (implied or realized) moves higher, these strategies reduce equity exposure. As volatility moves lower, these strategies add exposure
The last two days, we have seen the impact these funds can make. If you look at the chart today, there may be much more of an impact to be felt
As I discussed yesterday, volatility as a risk measure in the markets is muted. Probably too much but that is a discretionary investor injecting subjectivity into the discussion. If you are a systematic investor, you simply observe where it is and make your decisions accordingly
Consider the chart today. It shows three lines: the VIX Index (implied volatility) in orange, which is inverted, the index exposure of a vol control strategy in white, and the SPX in blue
You can see as volatility moves lower (orange line higher) exposure is added. As volatility moves higher (orange line lower) exposure is reduced. This has an impact on the level of the SPX
You see on Liberation Day, exposure was cut dramatically because of the sharp move higher in volatility. This exposure has moved back higher as volatility has come lower, but still has a lot to go potentially
In Q1 of this year, vol control funds cut their index exposure from 70% long equities to 20% long equities. You wonder who was selling as the market fell 25%? It wasn't retail traders as they were buying the entire way down
This exposure has moved back higher from 20% to 45%. However, it is still a far cry from 70%. Thus, there is more potential buying power from these strategies alone
While those looking at the 'fundamentals' of the market may be shaking their head saying this move back (and potentially through) all time highs makes no sense in a world with angst so high, earnings coming lower and a Fed that is data dependent, a systematic strategy might answer 'where is the VIX?'
This is technical buying. You need to respect the technicals as in today's markets, the technicals > fundamentals. This is particularly true when month end and quarter end are within the week
The behavioral section of the process is also looking positive for now.
Catalyst
What will get people to change their mind? It won’t be because of economic uncertainty or geopolitical uncertainty it seems. I wrote about that on LinkedIn as well:
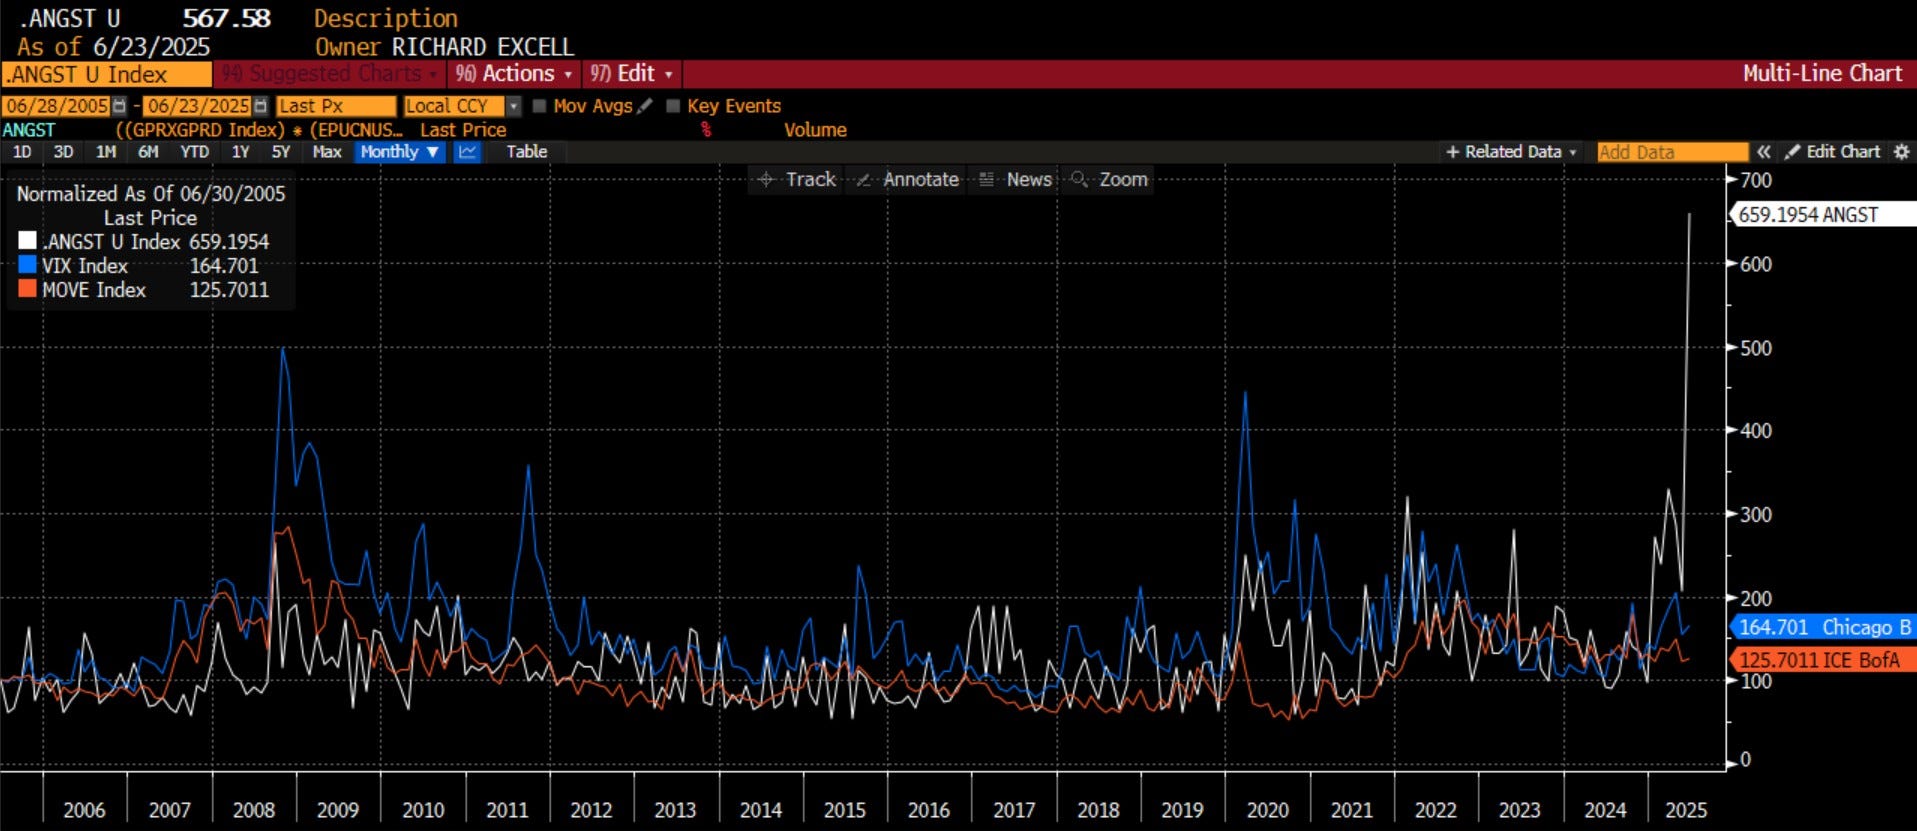
Chart of the Day - angst
Yesterday I had occasion to meet with good friend Duncan Robinson, MSDS, MBA, CAIA, FDP as we are discussing some research we want to do together. I think this will be some exciting stuff when done
One of the topics was looking at different types of either existing or alternative data. As I was going through some indicators to add into the discussion, I looked at both the Geopolitical Uncertainty Index and the Economic Policy Uncertainty Index
It would probably surprise few to know that these were higher. It might surprise some to know that both measures are the highest in 40 years. It is not a little bit of uncertainty, but historically high levels of uncertainty
It also might surprise to know that these two measures rarely move at the same time. We are usually in a period of high geopolitical risk or high economic uncertainty, but not both. Like we are today
So I created a geometric index of these two indexes to compare to market level measures of risk - VIX Index for stocks and MOVE Index for bonds
Looking back through time, not surprisingly, we see co-movement. When there is some sort of angst - geopolitical or economic - market measures of risk respond. The measure that responds more - VIX or MOVE - is typically a function of the source of the risk
This time? Neither are moving. Neither stocks nor bonds are showing any signs of stress in markets in spite of the level of "angst" being the highest in 40 years
Bombs in the Middle East? No big deal. After all, we have a ceasefire so everything is over and we climbed that wall of worry
Tariff uncertainty around July 9? No big deal. Trump always chickens out and if he doesn't, there were strings of Fed officials out today, presumably auditioning for the new Fed Chair role, who want to cut rates
Forget that in the dot plots last week there were 7 of the 19 dots that had no cuts, 2 had 1 cut, 8 had 2 cuts and 2 had 3 cuts. So there is an easing bias, but it is far from consensus. The market heard the doves today and responded
Even if Fed does nothing, as we saw yesterday, financial conditions are already easy
Going back to my post last week about forest fires, I don't know when a volatility event may happen. Maybe not because the forest is damp. However, this isn't a spark, it is a flamethrower
The SPX is 25% above the lows and about 1.5% from the highs. Hard to say the market is prepared for angst. But then again, maybe it just doesn't matter
So, if economic and political uncertainty will not get the market to change its mind, perhaps it will come from earnings which will begin in earnest after the 4th of July holiday. Looking at the growth estimates for the SPX, the bar is still rather high:
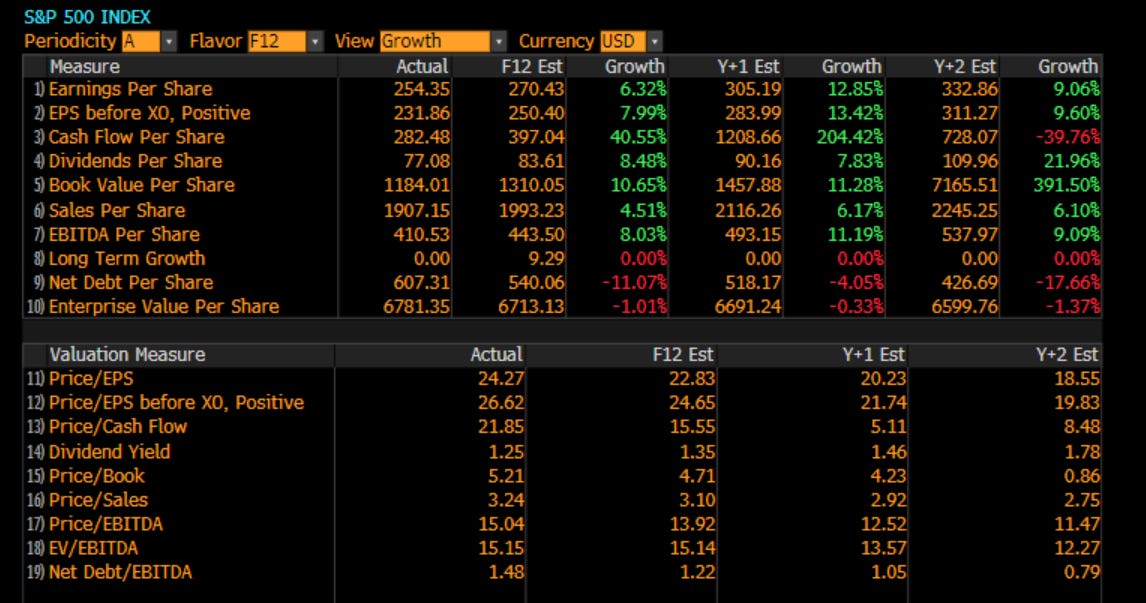
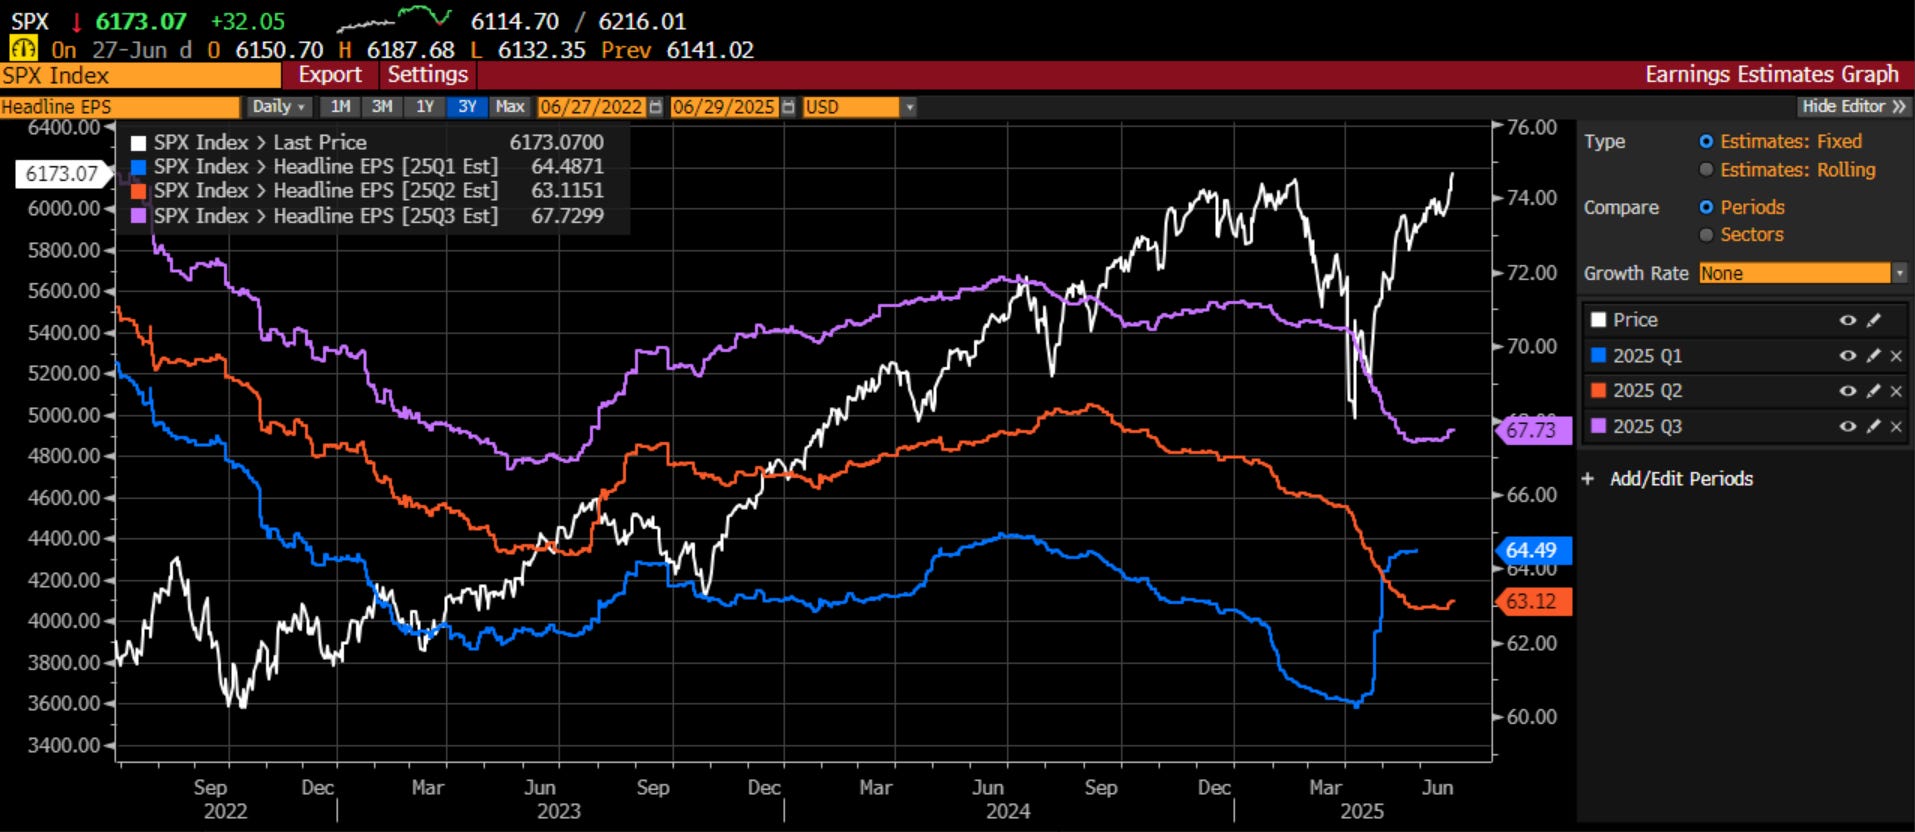
However, estimates have also been coming down for the next two quarters as well:
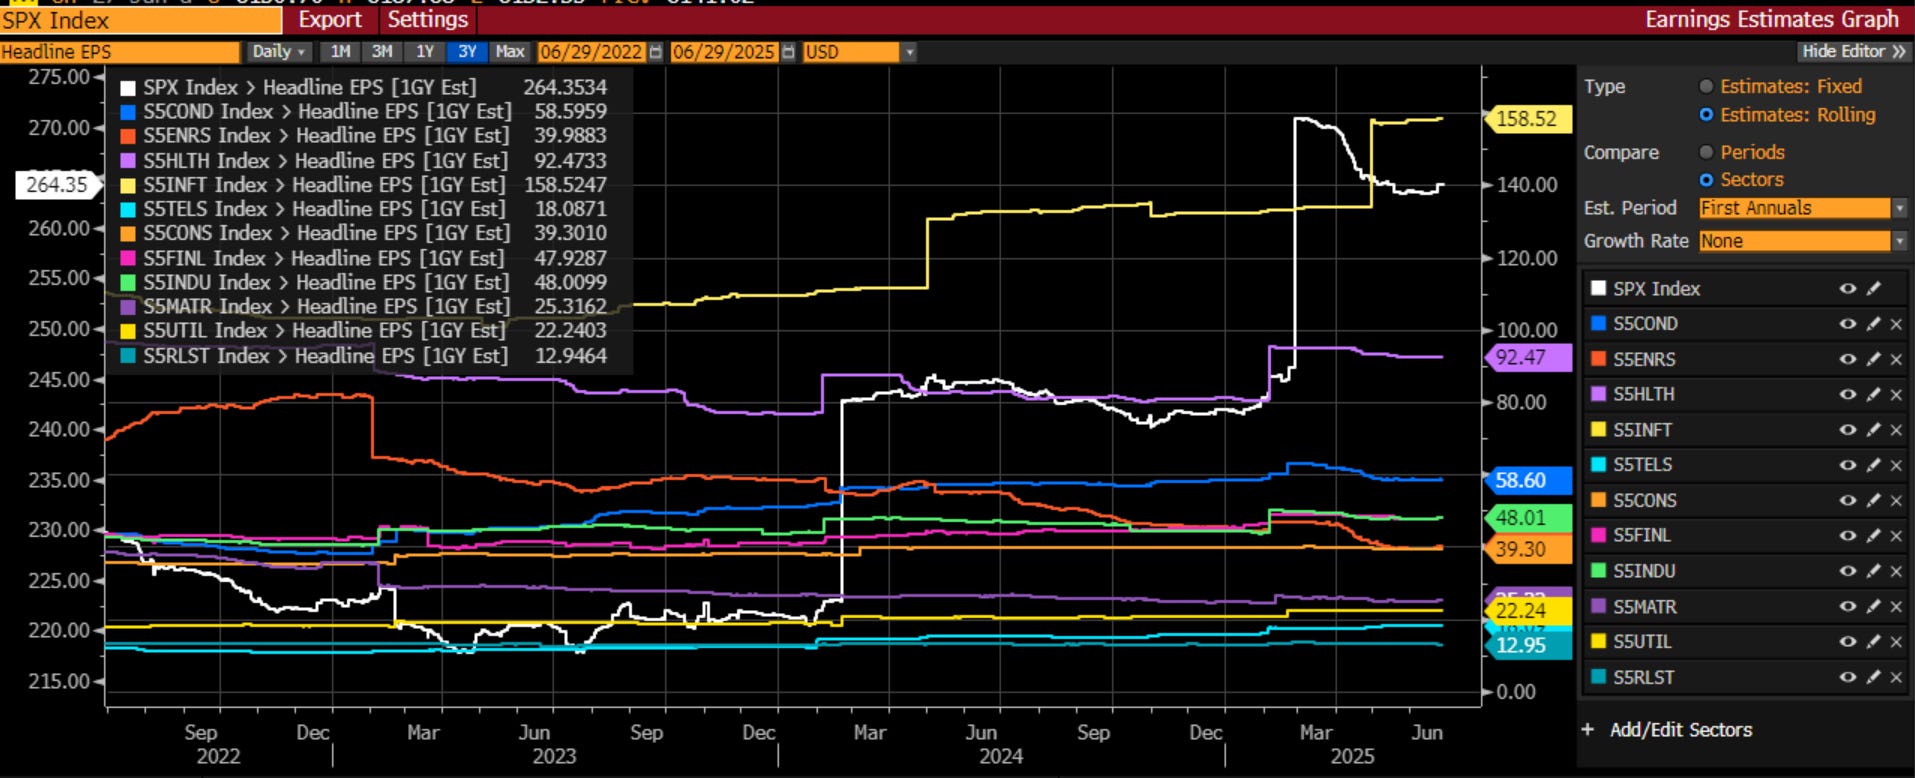
The biggest drivers for SPX earnings will be Tech and Healthcare. Given the large layoffs we have seen in Tech, I would suspect that earnings will be much better as they have reduced their biggest expense to drive earnings, that what we call AI productivity. It should not be surprising that analysts have been taking their earnings higher in Tech, even while overall earnings have come lower.
Thus, it is difficult to see earnings as a big negative catalyst this month. It is, as it usually is, more likely to be a neutral to positive event.
Putting this all together, the Fundamental, Behavioral and Catalyst parts of the market are all pointing higher. It should not be surprising that we are back at all-time highs even though, as one of my golf partners said this week, “If I told you tariffs would be 5x higher and the US had bombed Iran, would you have picked stocks at all-time highs?” As I responded, “no, that was not on my bingo card”. However, here we are and looking at everything, it’s not clear that it can’t and won’t just keep going.
Stay Vigilant

Vol control vs VIX - a killer chart---would opine the obvious--Vol Control is probably using a 3m SPX realized vol metric so is going to be lagging, so that does not mean the point that there is more flow into the market is invalid...Also did you know since 1950 the best 2 weeks of the year are the first two weeks of July. The bears are asking questions
Greetings from Europe! As you mentioned a few weeks ago…this time the continent seems slightly more expensive for the US tourist and less crowded as compared to recent Summers. Nevertheless, the wine is lovely and the cuisine is delicious. Always good to get your overall read on the markets when I have access to the internet. Cheers.