
Riddle Me This


I’d like to start off by wishing a Happy Mother’s Day to all who celebrate. Moms are the best people around and I think we can all agree that we wouldn’t be where we are today without our moms.
Speaking of where we are today, there seems to be a lot of debate these days about where we are and where we are going. On the one hand, we have the camp suggests that massively higher input costs as the results of tariffs, retaliation to tariffs and the supply disruptions from the Iran War are going to lead to prices being so high that growth will get squelched. On the other hand, we have a crowd that suggests that fiscal and monetary stimulus, combined with a positive productivity shock from the move toward AI, is going to lead to growth without inflation i.e. Goldilocks.
Of course, asset class and sector performance will vary markedly whether we are in Stagflation or Goldilocks. I have been debating with many the last few weeks about which of these scenarios is more likely to play out. We like to share the data that we think proves our point. Each time I do this, I think of what The Riddler used to say to Batman, “Riddle me this, Batman”.
So, Riddle me this …
FUNDAMENTAL
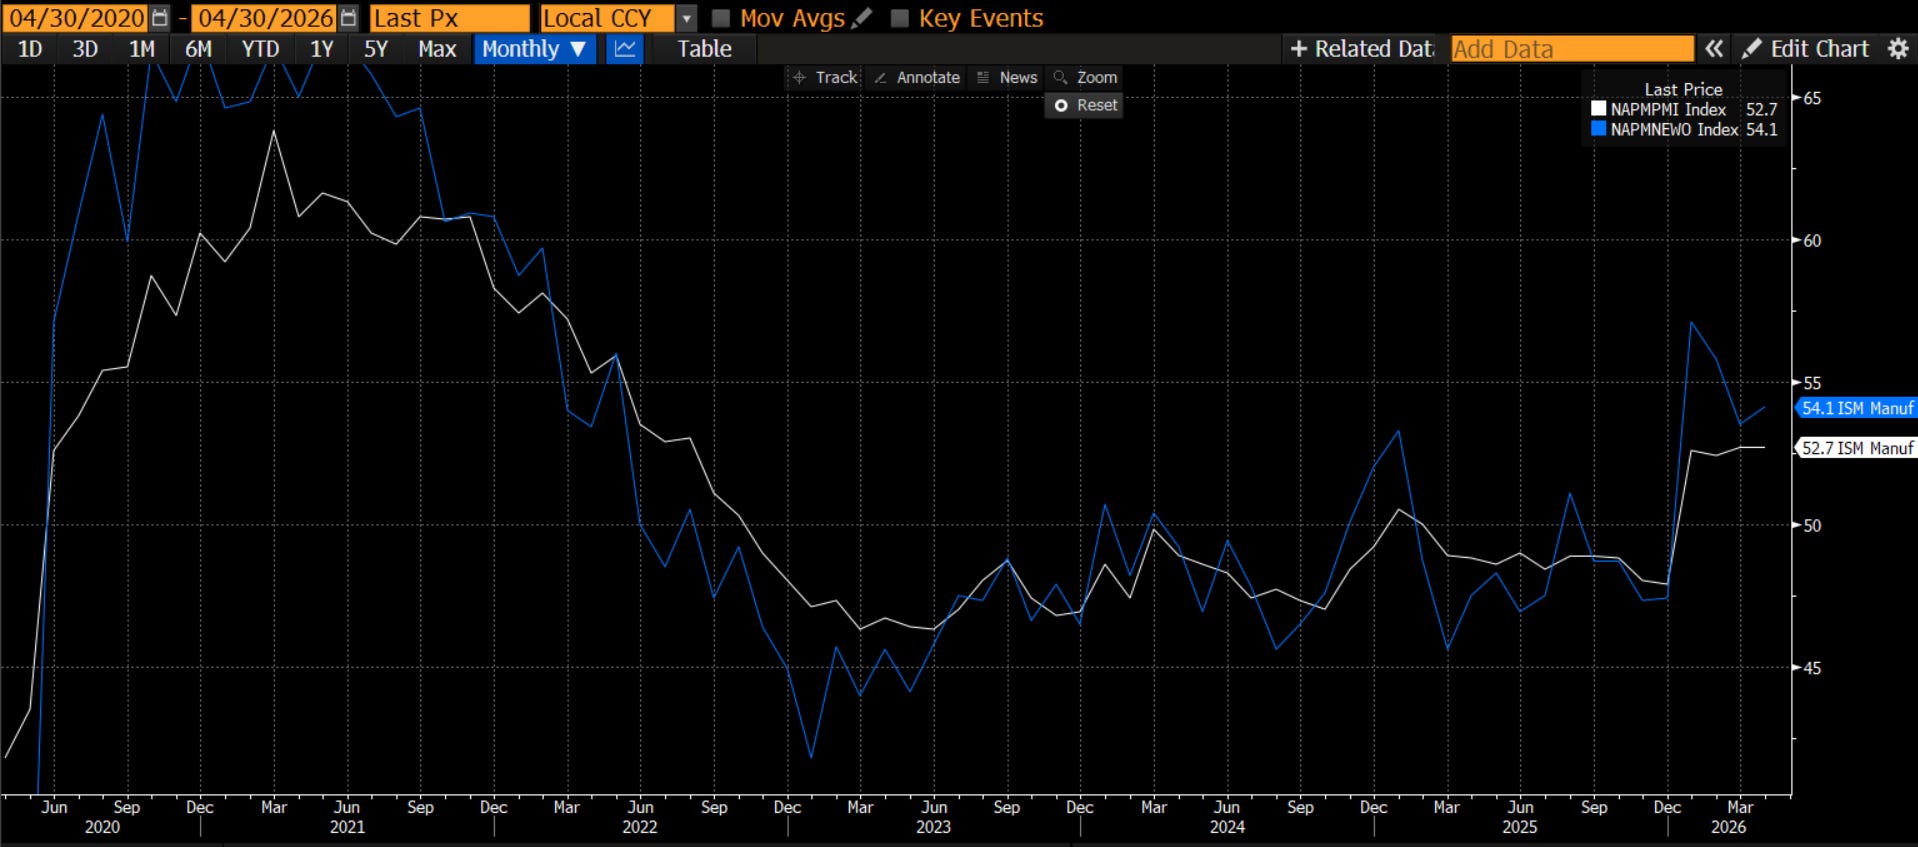
Let’s start the riddle by considering the fundamental data that we are seeing. When it comes to fundamental data on the economy, the one data point I focus on the most is the ISM. In addition, I focus on the new orders component as well since it tends to lead ISM, which itself is a leading indicator. This month, ISM is again above 50 indicating that the economy is expanding. Last month, new orders had pulled back after a huge jump the month before, but this month, they ticked back higher. For those that watch and care about the ISM and its components, the economy is giving the all clear.
Speaking of new orders, there was a ton of orders info out this past week. Factory orders, durable goods orders and capital goods orders. I wrote about this on LinkedIn this week:
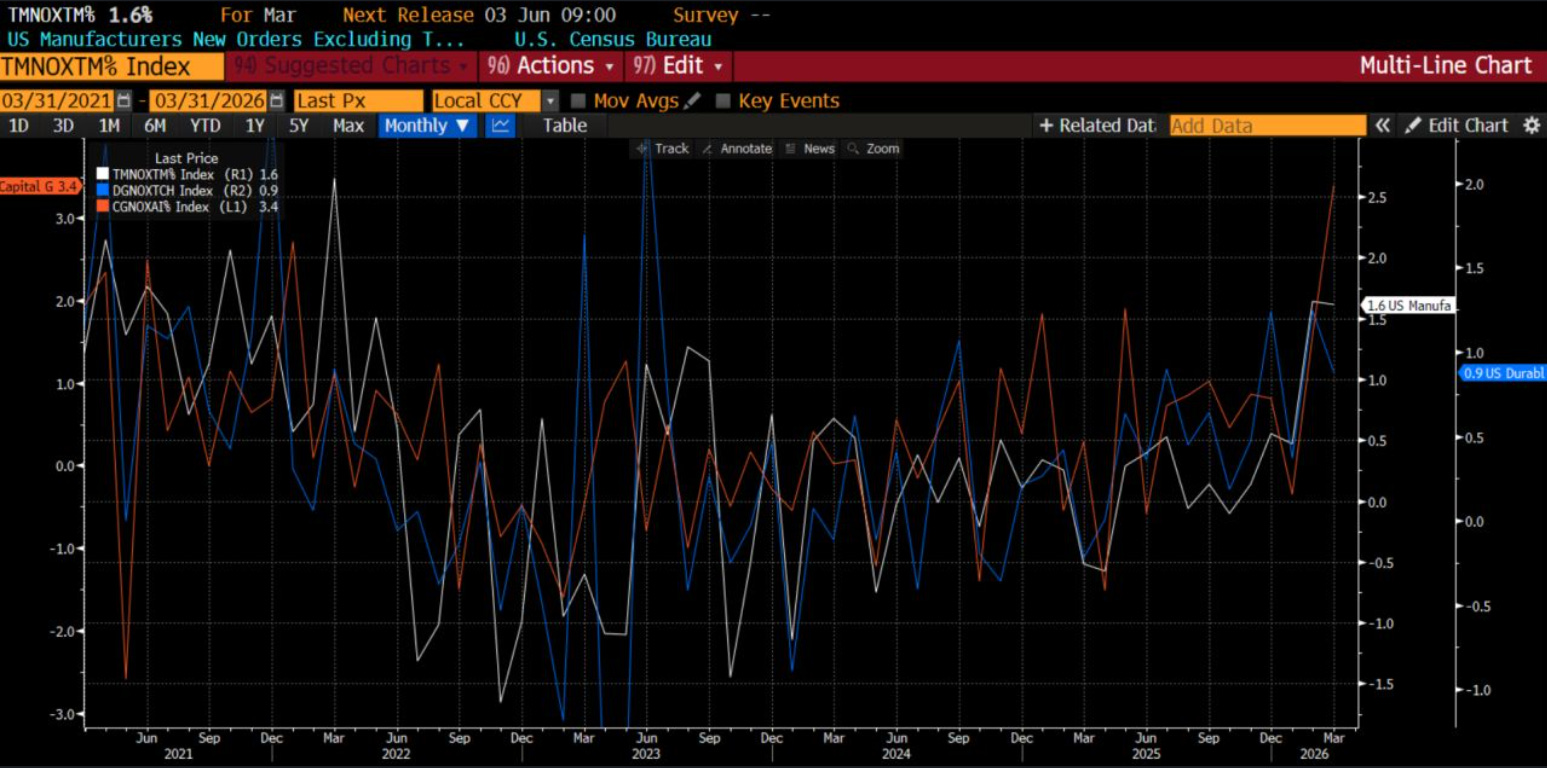
The economic data has been quite good. Look at the data today. It is Factory Orders, Durable Goods Orders (ex transports) and Capital Goods Orders (es transports). We are at the highest levels we have seen in years. We are ell above the lows of last summer and are accelerating
I particularly note the Capital Goods orders skyrocketing to the highest in 5 years. They are a subset of Durable Goods. These are durable items used by companies to produce other goods/services (e.g., machinery, industrial equipment, computers, vehicles for business use). They are not final consumer products but tools for production
They are a direct indication of the strength in demand of data centers, manufacturing and the infrastructure to build it. That is why for every computer programmer that is laid off, we see a construction job takes it place. Yes, those are not the same people, but it is why overall jobs are stable
Orders lead profits. Profits lead employment. Don't get stressed about the AI eating jobs narrative. For one, it isn't entirely true. For another, once these strong orders numbers flow through to profits, people will get hired
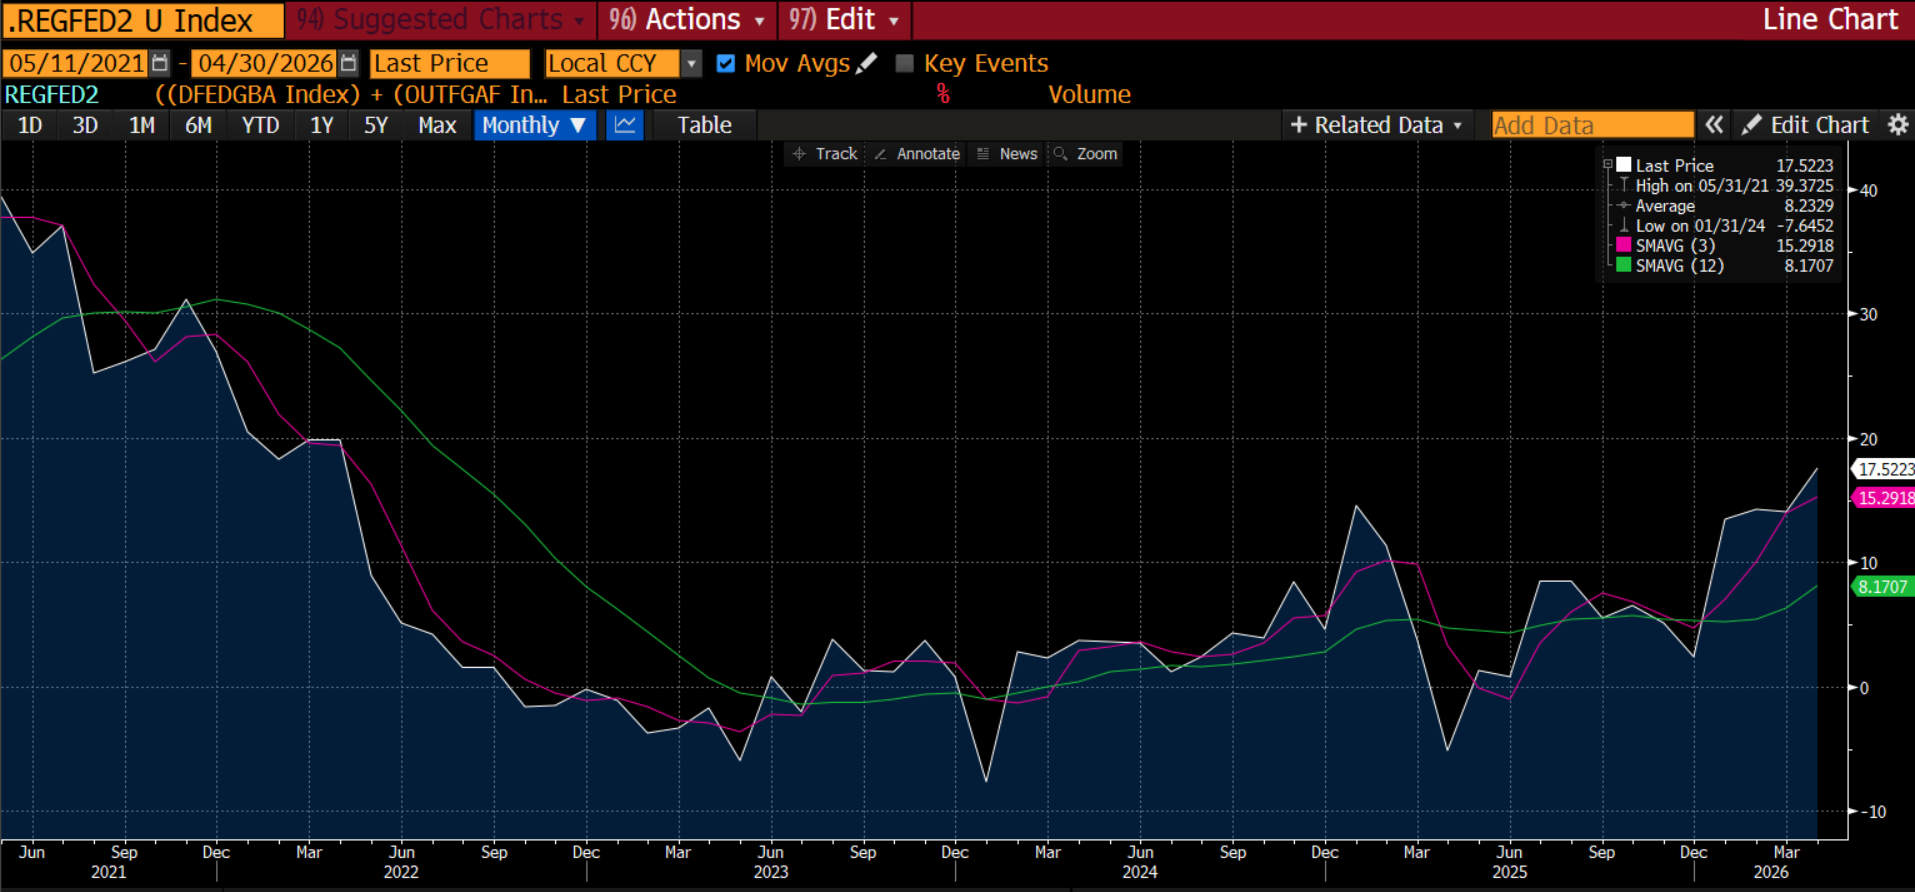
The surveys from the regional Federal Reserve branches corroborate this strength as they continue to point to more economic strength as well:
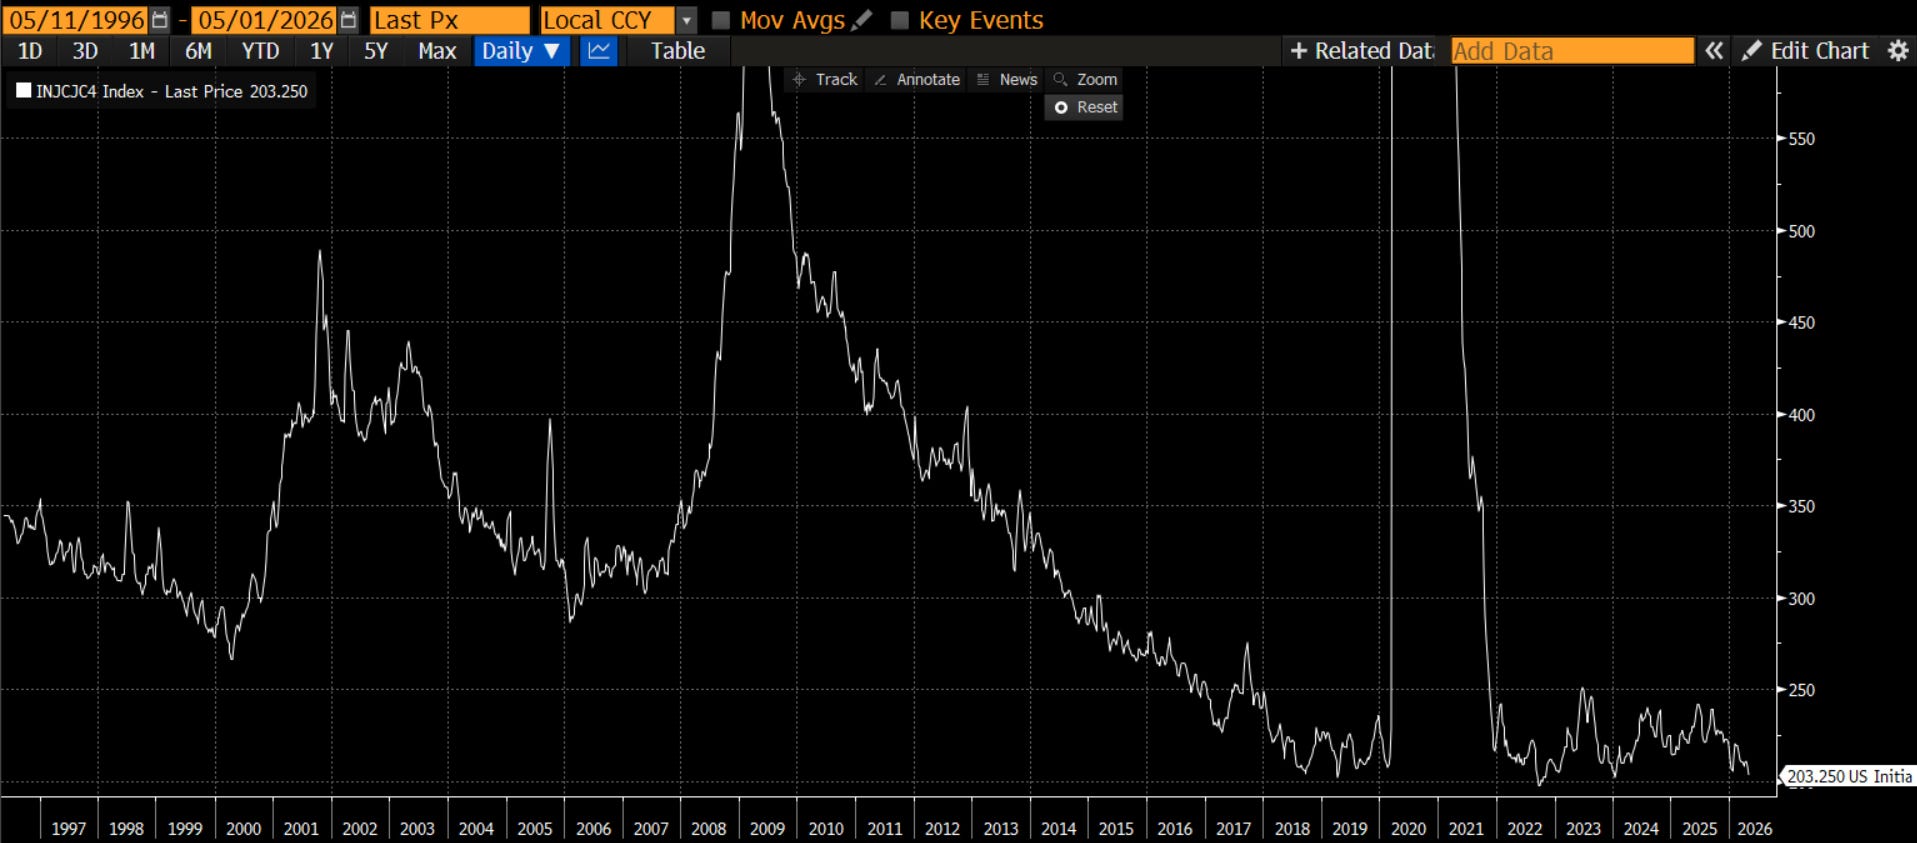
I know we got non-farm payrolls this week. However, we all know it is useless because it will be revised over and over and over. A better measure of the economy is jobless claims. Looking at this data, in spite of all of the negativity about AI eating jobs, jobless claims are at one of the lowest levels of the last 30 years. Is the economy struggling? Not based on this.
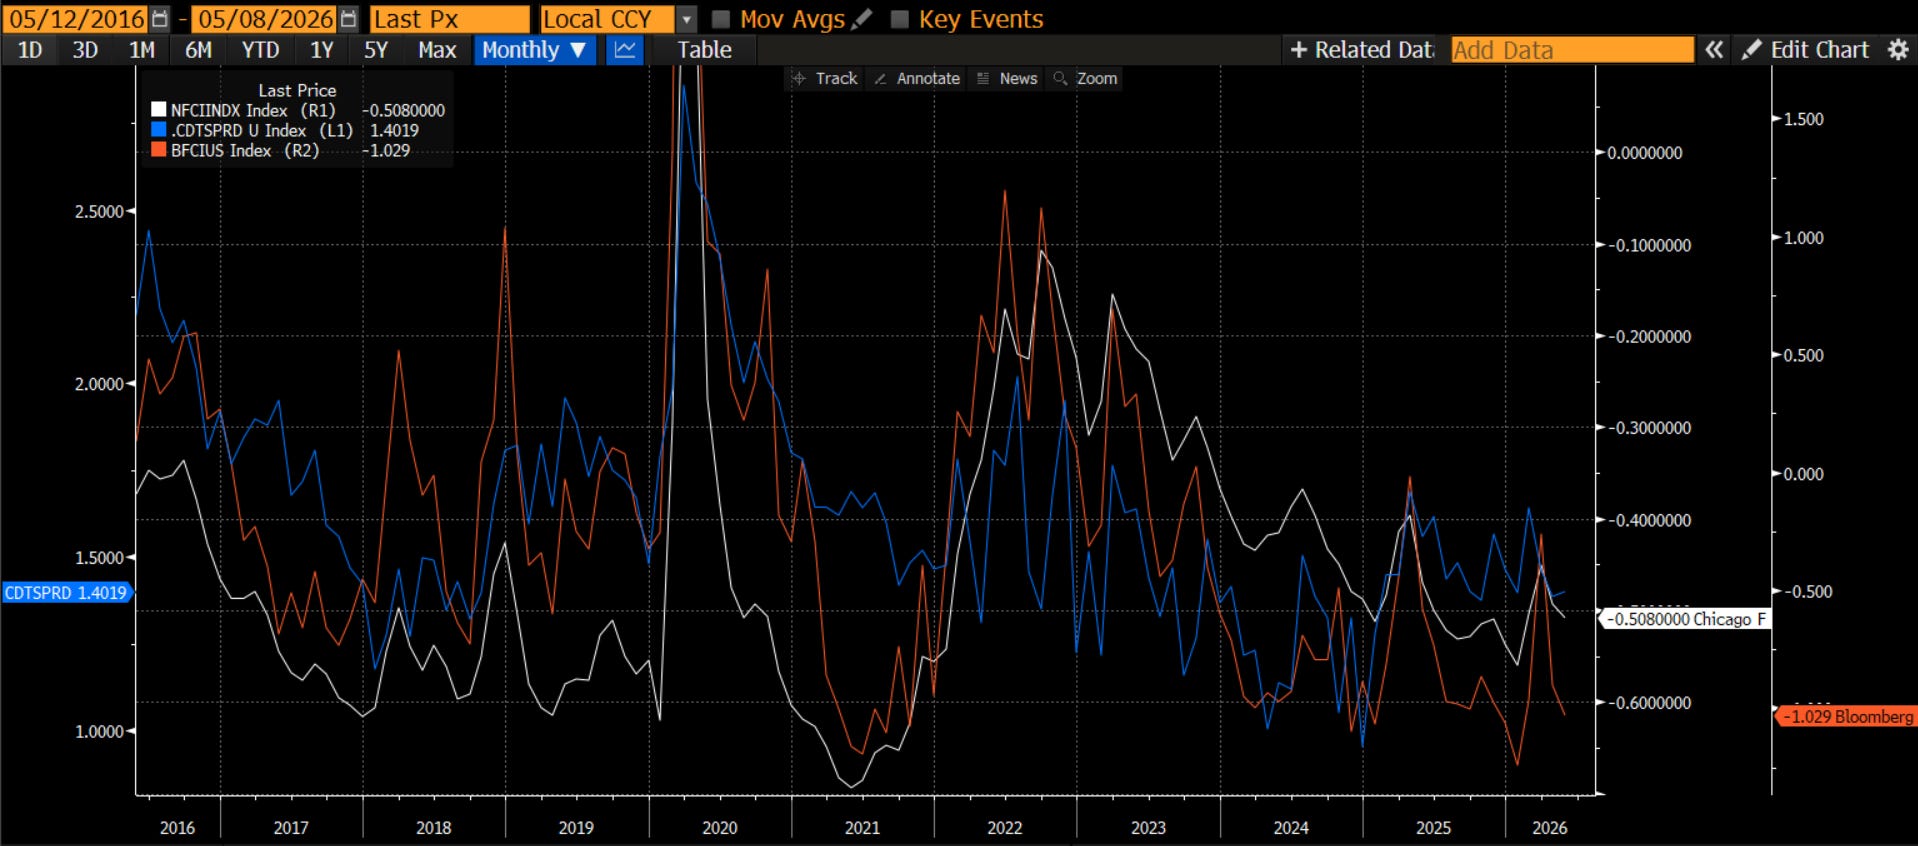
Why might the economy be doing well? Perhaps it is because financial conditions are so easy. Whether we look at credit spreads, Chicago Fed National Financial Conditions or the Bloomberg financial conditions index, we are at some of the easiest financial conditions in the past couple of years. On the Bloomberg measure, we are at some of the easiest in the last 10 years.
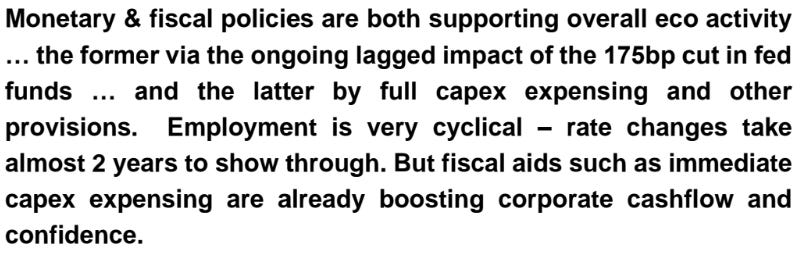
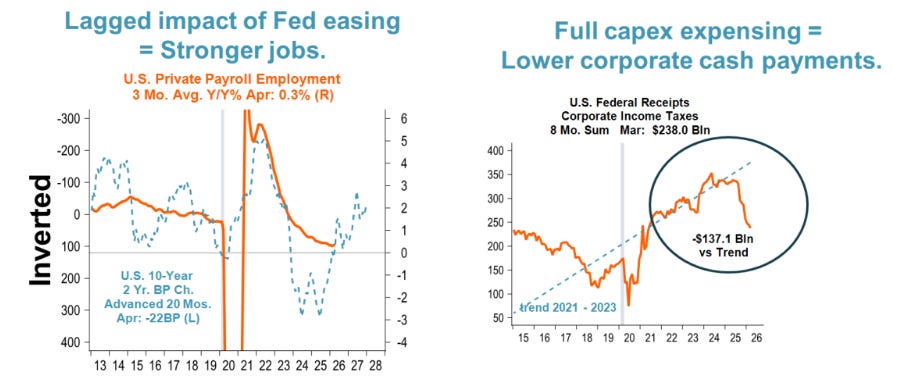
Another driver of the strength in the economy right now is from the fiscal and monetary stimulus. This comes from Nancy Lazar at PiperSandler. Fiscal and monetary stimulus are leading us in the early stages of a classic business cycle:
All in all, the fundamental data in the economy look robust. How robust? So much so that we should not be surprised the market is going to new all-time highs. In fact, if it wasn’t for the Iran War, we might even be a lot higher just based on the fundamental data right now.
BEHAVIORAL
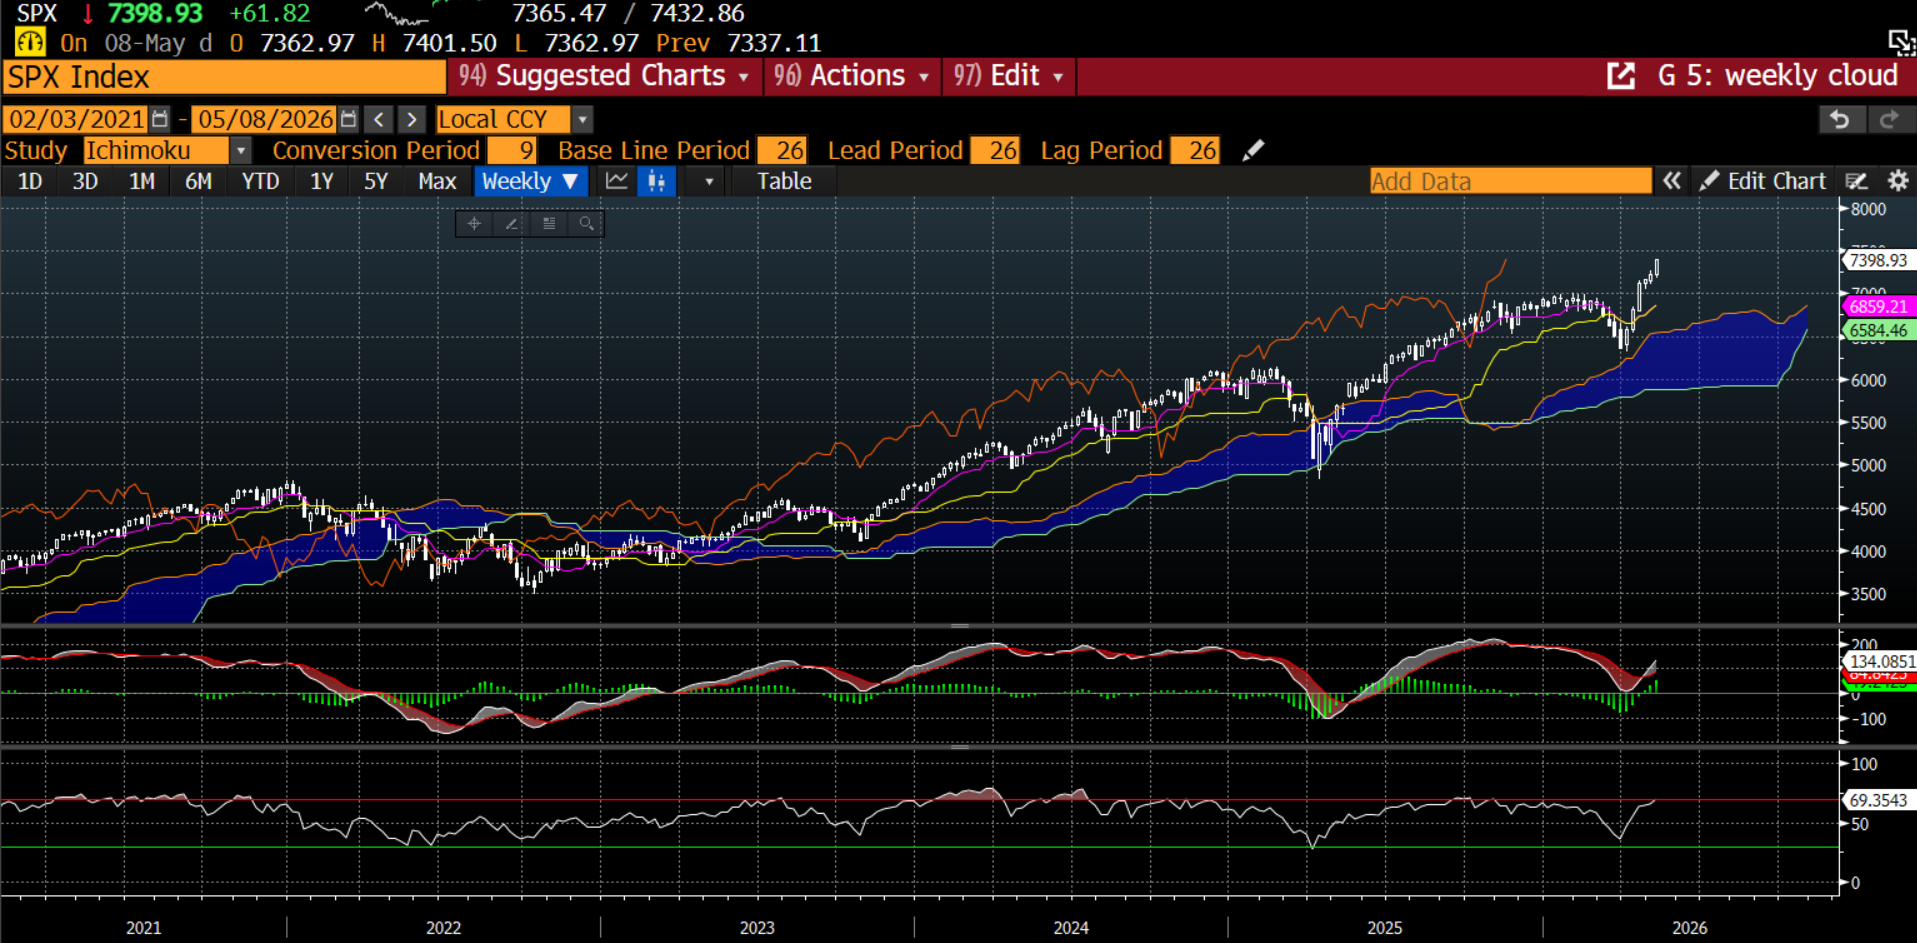
We know there is a behavioral component to the market. We can’t ignore that. One of the bigger concerns is the magnitude and pace of the recent rally. Clearly, on a daily chart, the market is overbought. This does not mean it has to move lower, but it would suggest consolidation could be likely too.
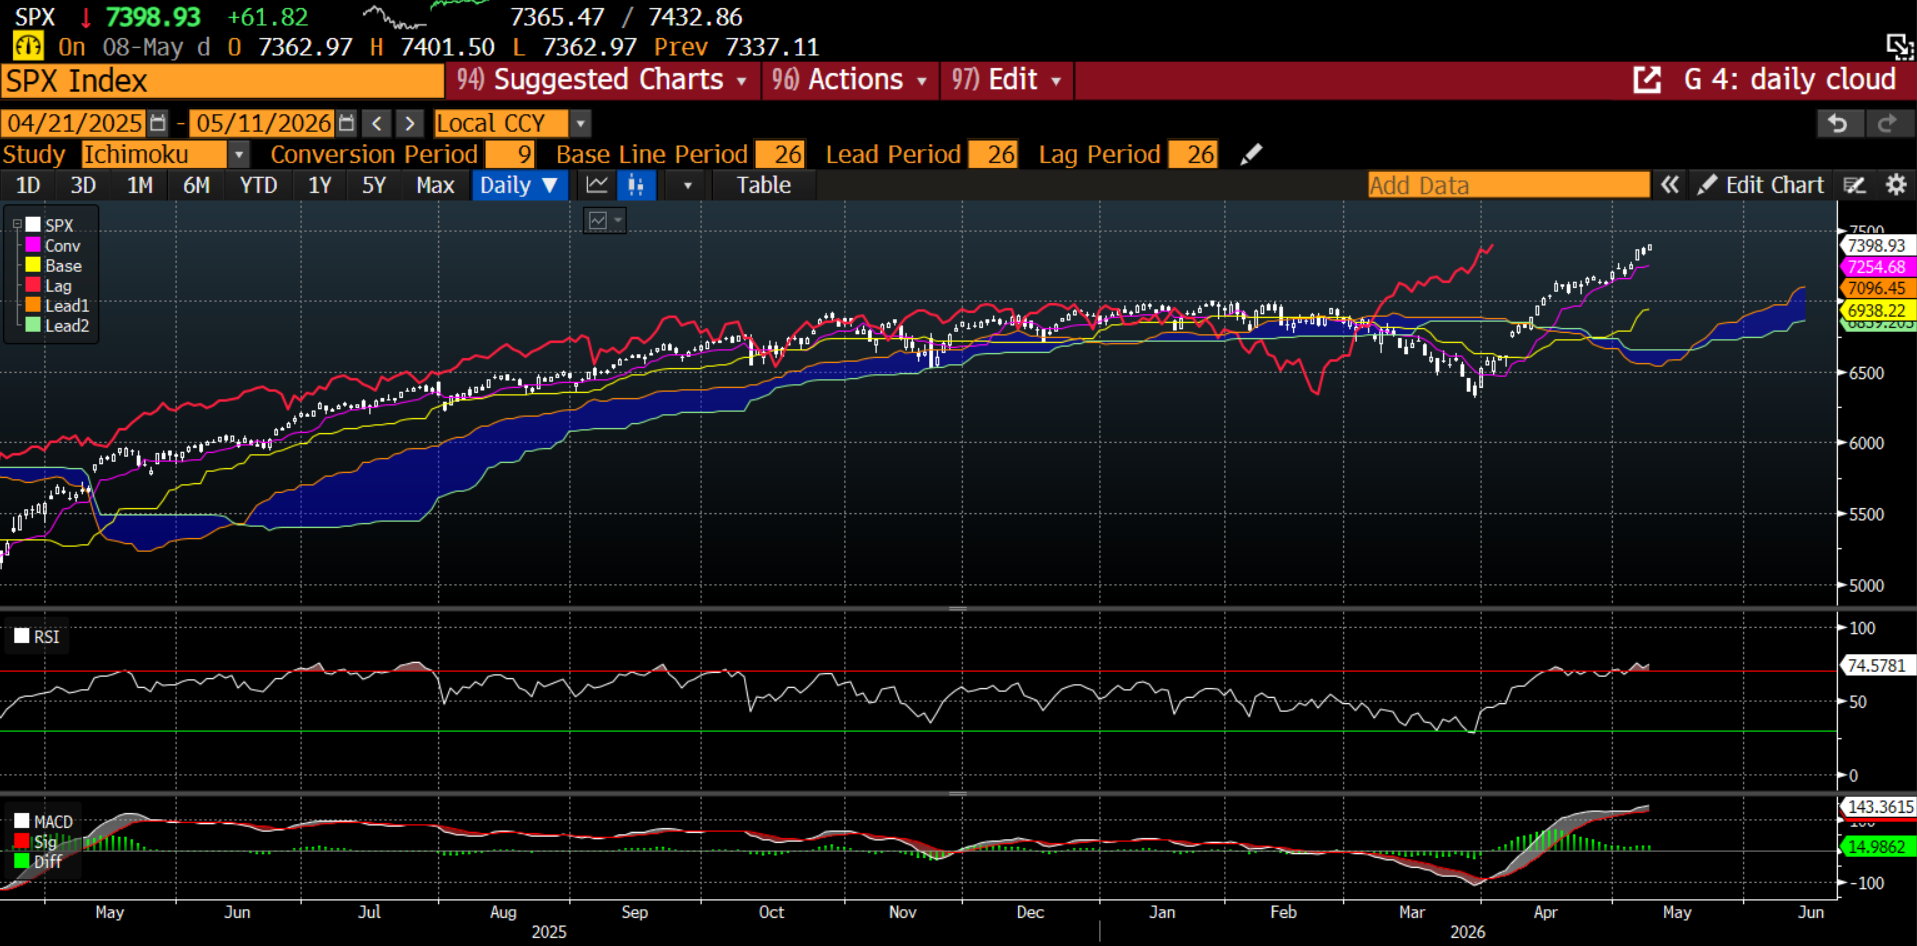
Stepping back to a weekly chart and the picture is quite compelling. Even on the sell-off in March, we pulled back to the ichimoku cloud and held. Now the MACD is turning higher and we are not overbought. This is a very strong looking chart:
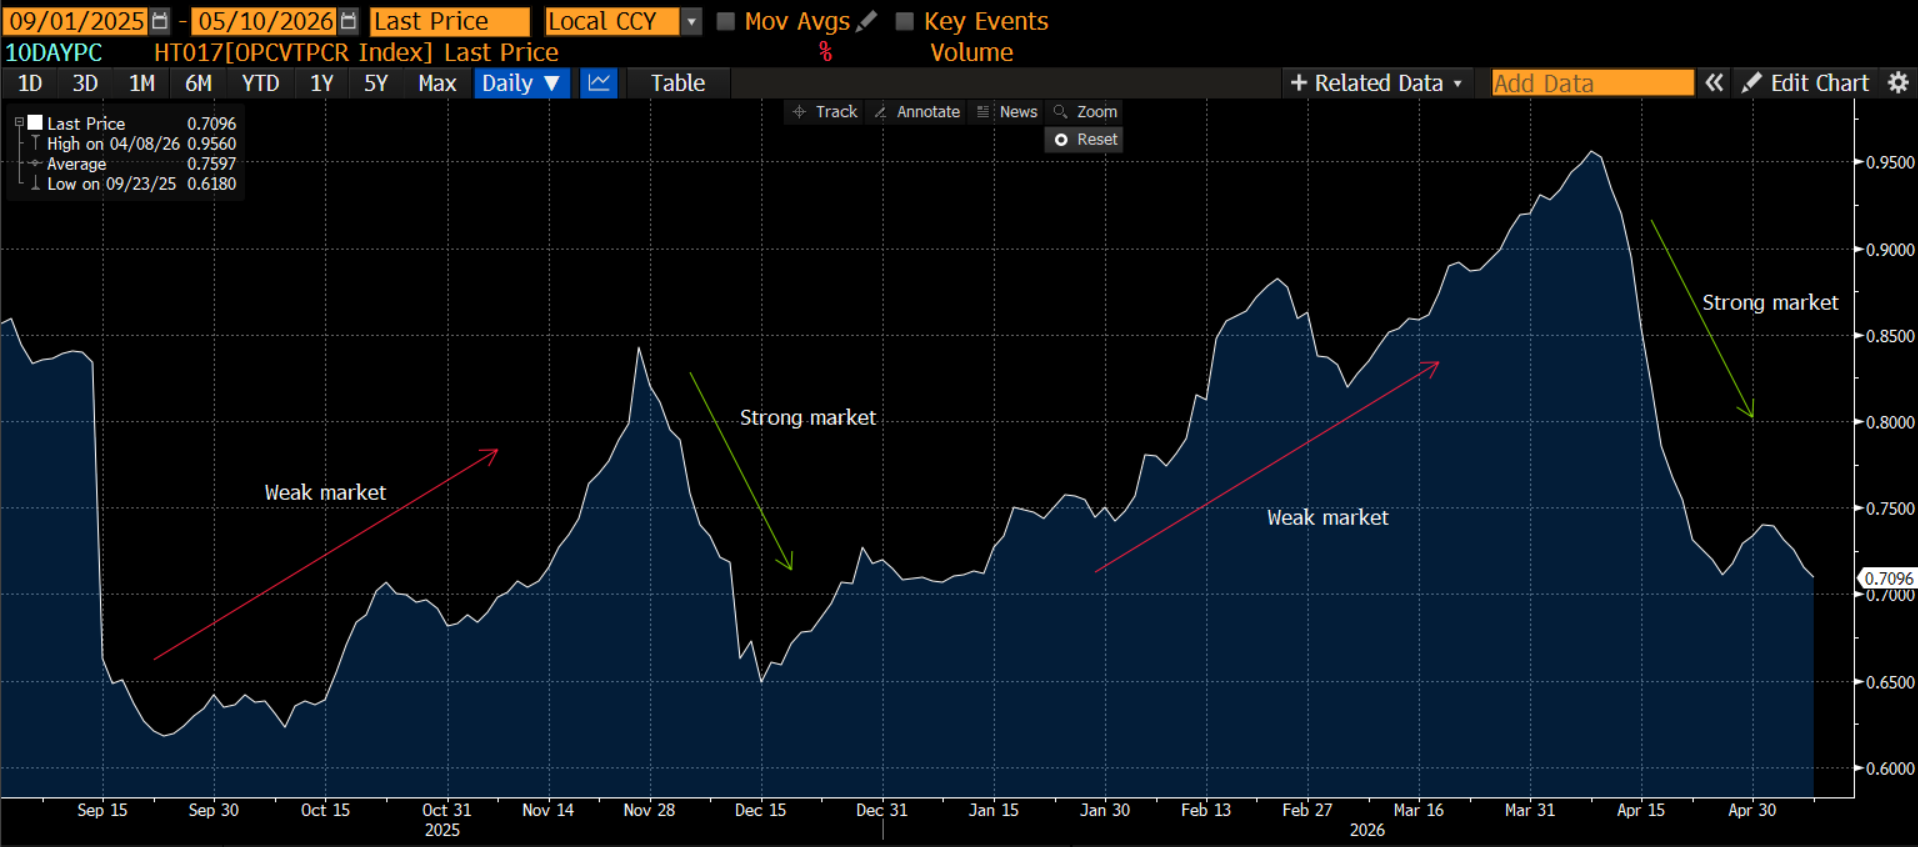
On a shorter-term basis, I focus on the put-call ratio because changes in this ratio indicate short-term rends. When there is more put demand, the market is weak, and when put demand falls sharply relative to calls, the market is strong. This indicator is giving us a strong market signal right now.
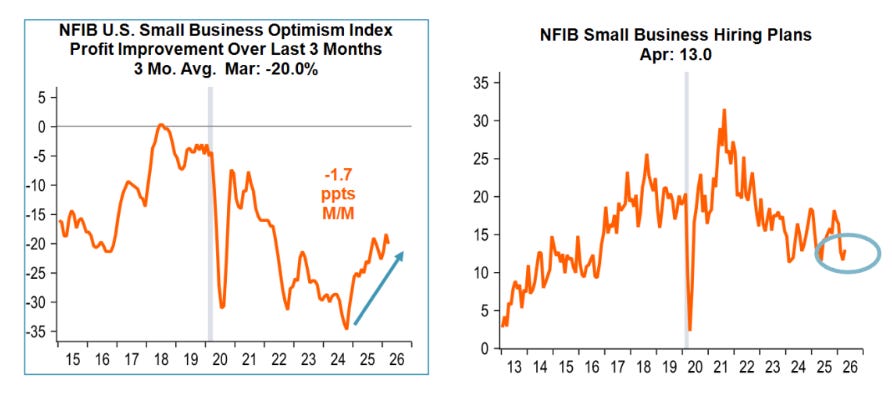
Economic surveys are also giving a positive sign. The NFIB small business survey is moving higher. Because businesses are doing well, they are looking to hire more employees as well.
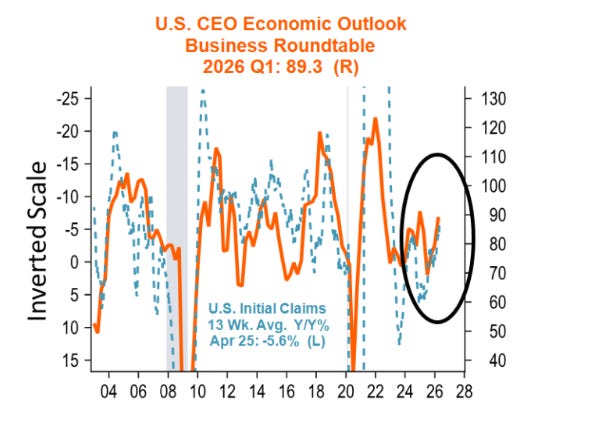
It isn’t just small businesses either. The Business Roundtable shows the CEO economic outlook. It has turned higher and is back to one of the higher levels of the last few years. Thanks to Nancy and team from Piper for these charts:
While the daily technical chart is overbought, that is really the only behavioral component of the market that is giving any sort of negative signal. Everything else is giving a strong positive signal.
CATALYST
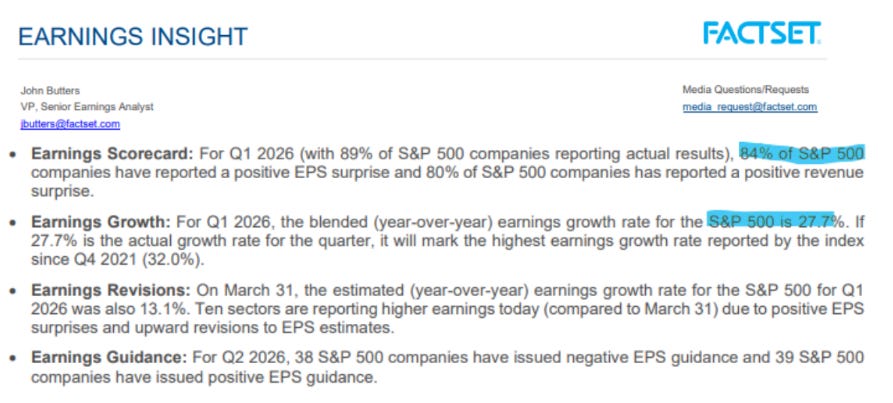
We are approaching the end of the earnings season. This season has been one of the best, if not the best, in the last few years. There is no doubt that earnings are telling us the economy and stocks are about to head even higher still:
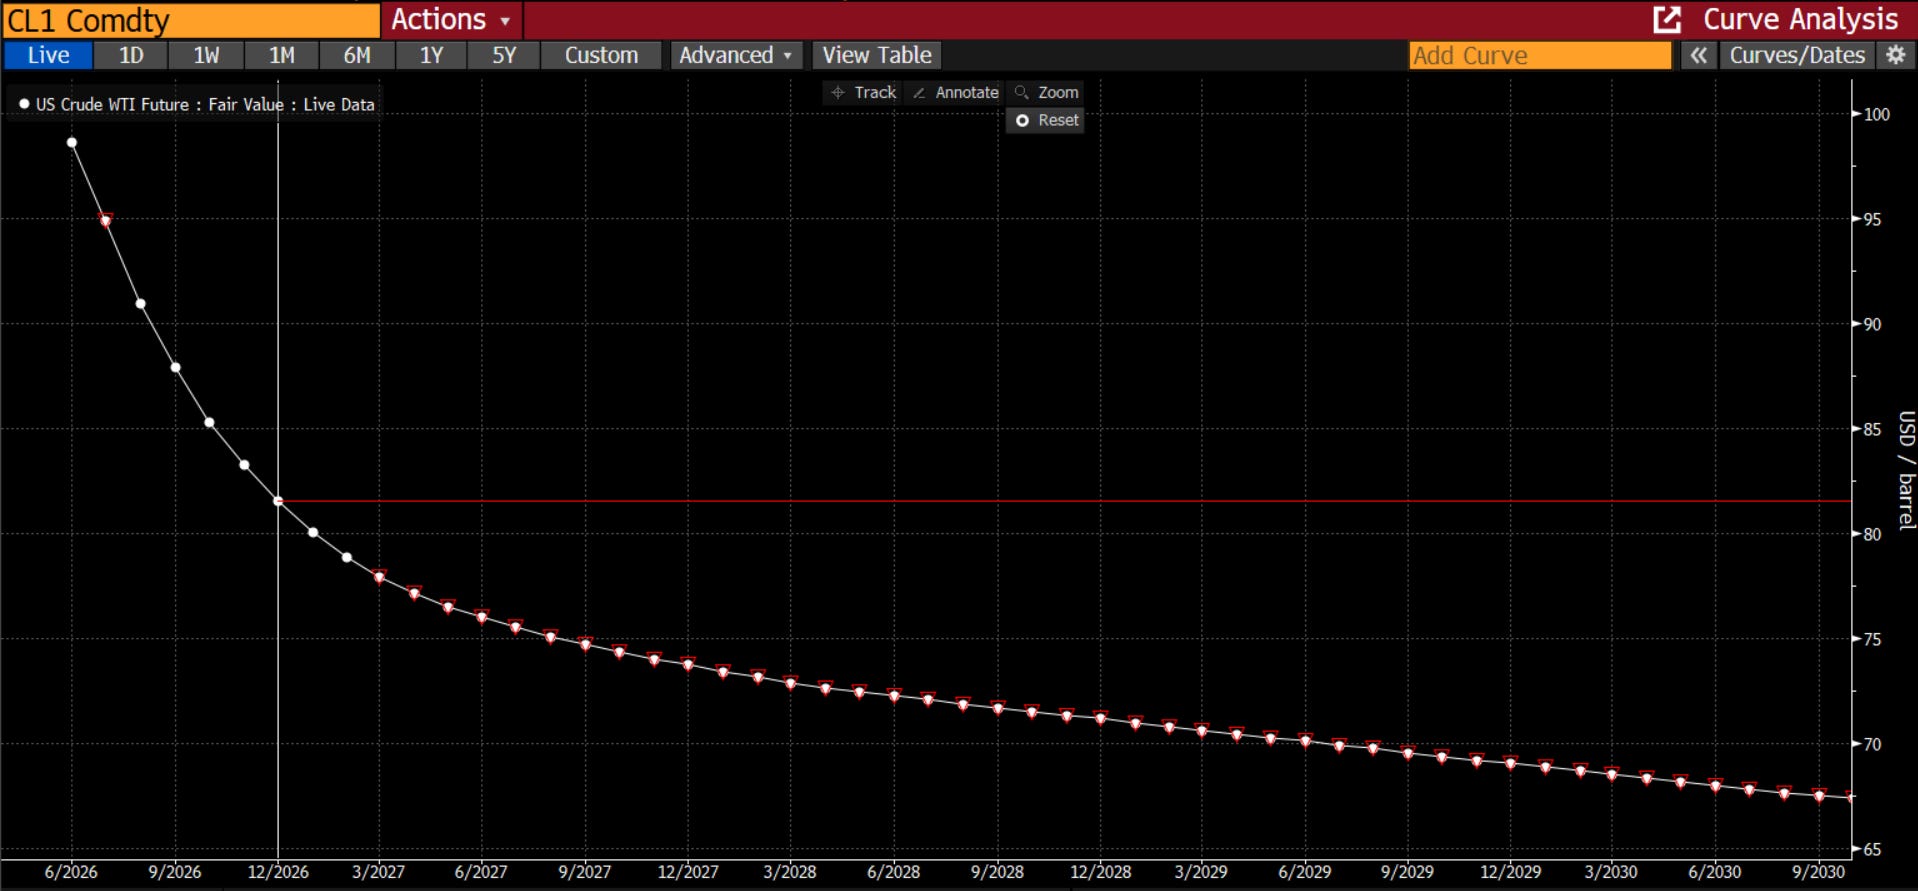
A big negative is oil. Many macro funds tell us to fear $250 per barrel oil. The current and coming supply shock is meant to tell us the world is going to end as we know it. The worst-case scenario is the closure of the Strait of Hormuz. However, as a simple person, I know that I do not know what the spot commodity experts know. That is why I focus on the futures curve. If we are screwed longer term, why are futures for December of this year about $20 lower, not higher, than they are now? I see no $250 price anywhere on the curve. The futures market tells us the oil market will find a workaround. I will assume the futures market is correct until proven otherwise.
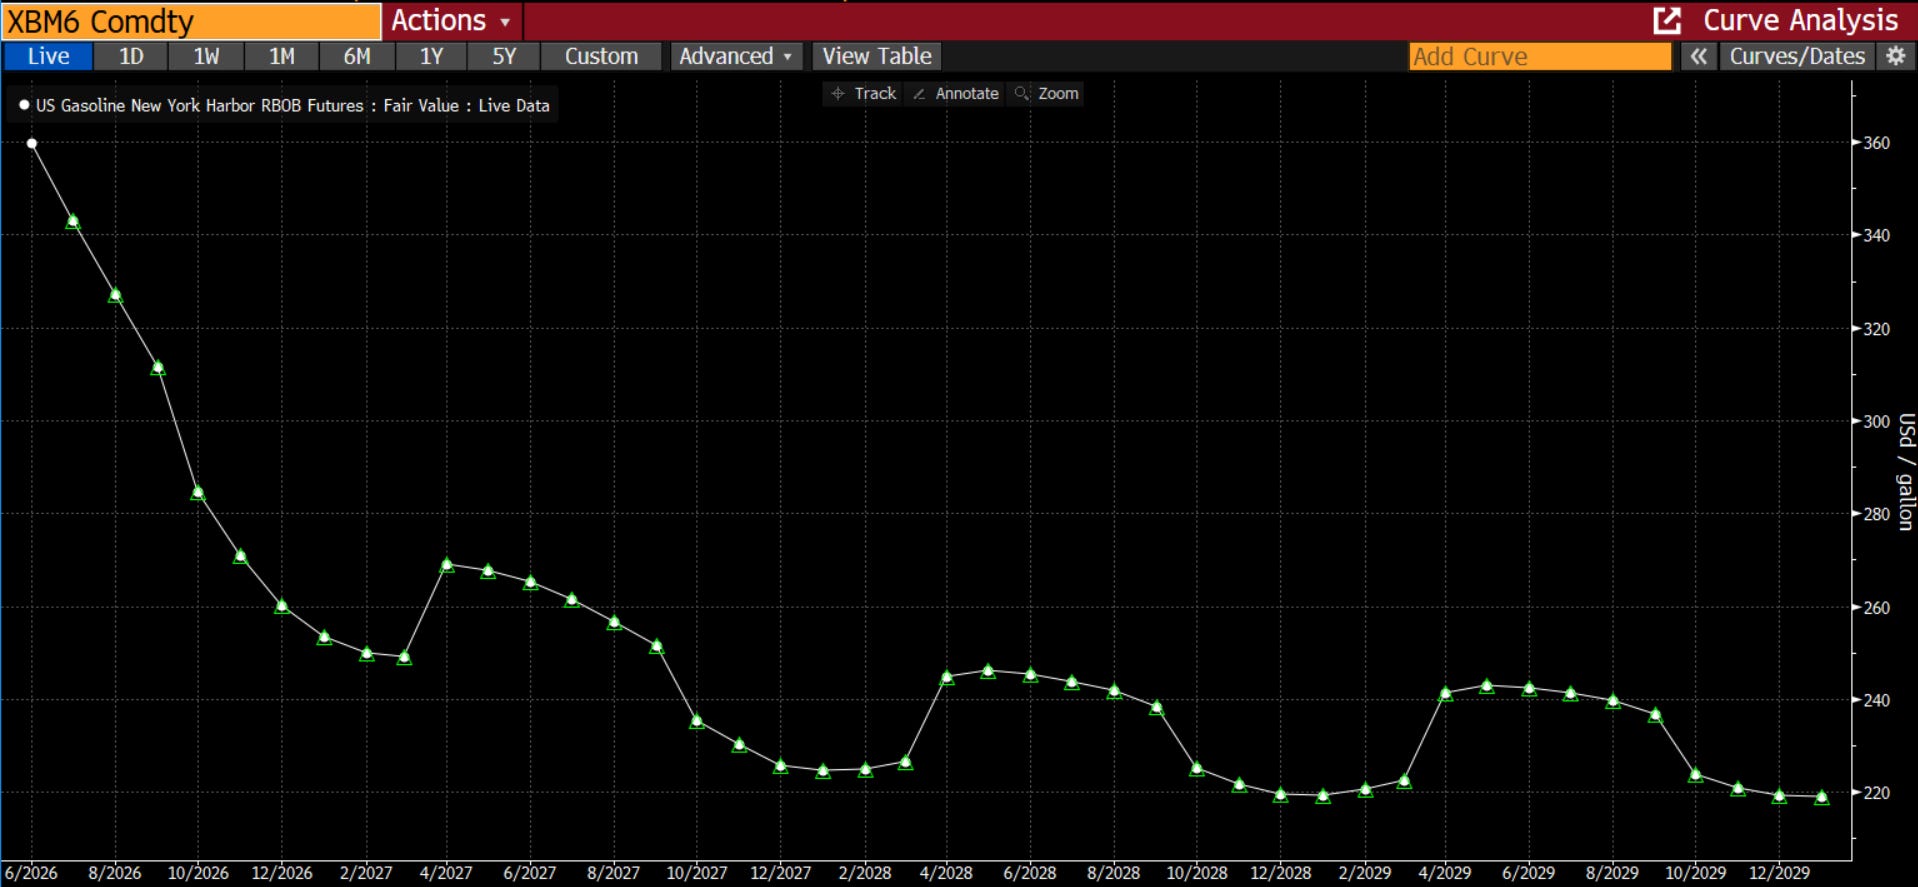
Consumers care less about oil prices and more about gasoline prices as they need to drive to work everyday. Gasoline prices are set to end this year back below $2.50 a gallon. Again, not as good as 6 months ago, but not bad at all.
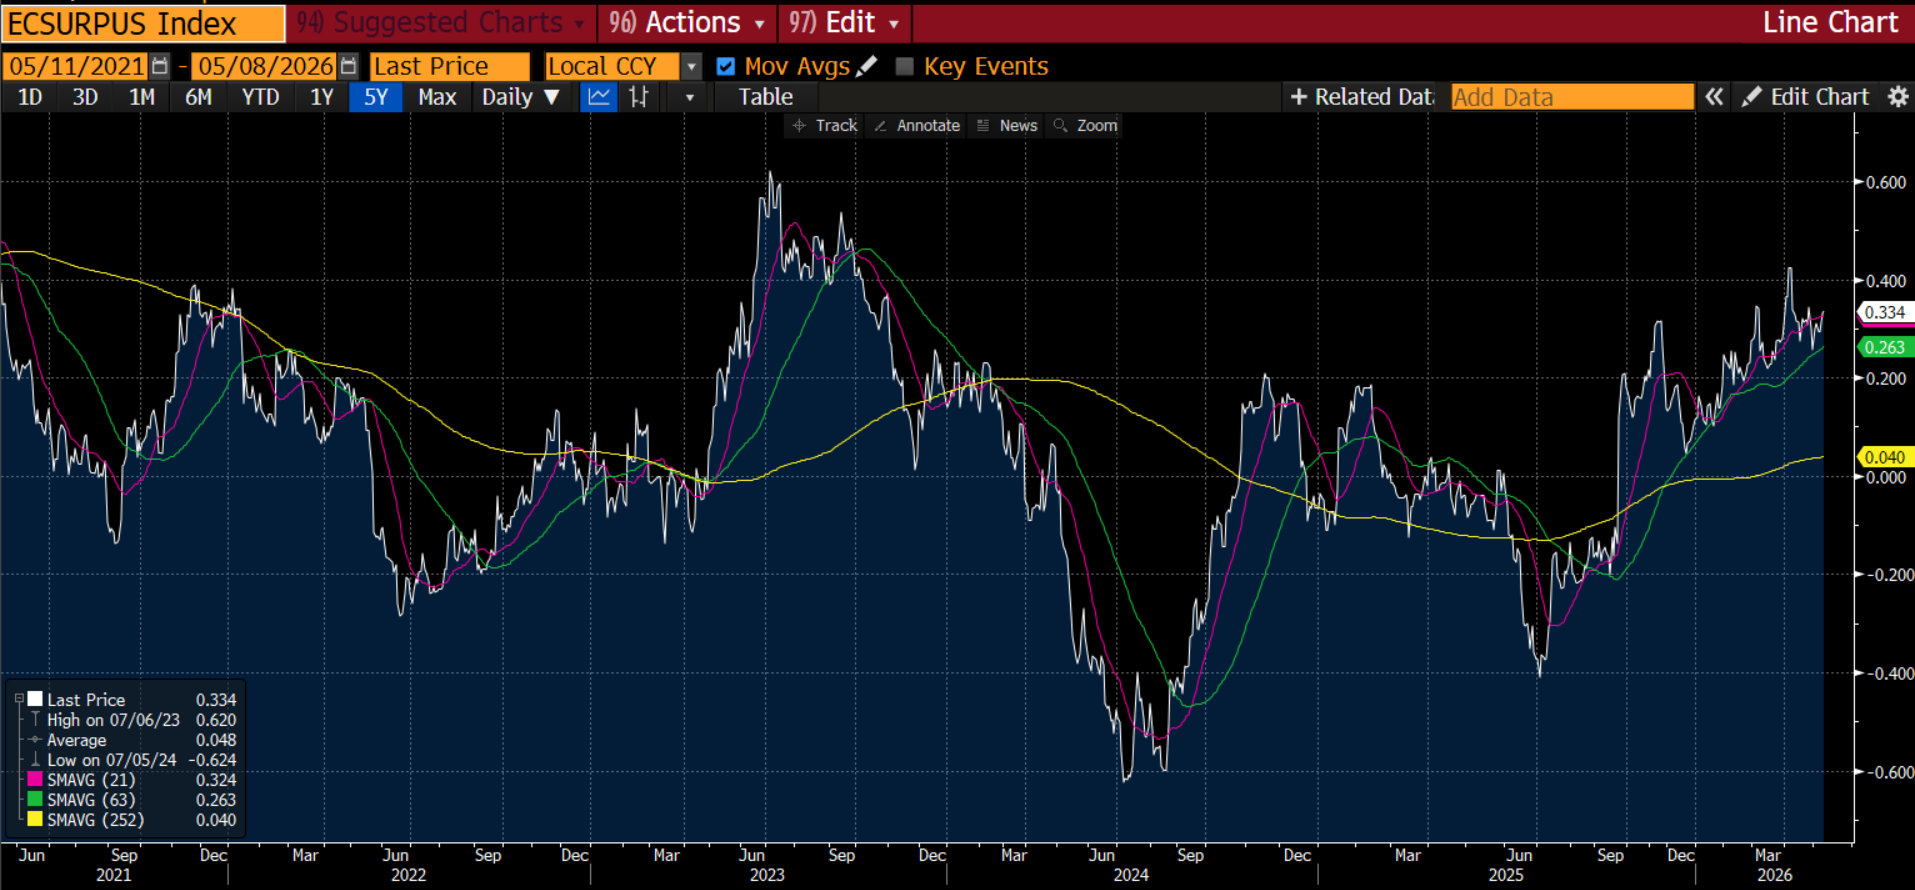
Finally, if we aggregate and look at the economic surprise index, we can see that economic data has been better than expected across the board. The economic data, much like the earnings data, is not only good, but better than expected.
The catalysts are telling us things are not only good, but improving. I know this is hard to believe for a lot of people caught up in the headlines of the war. However, I would tell you that what we are seeing is a classic business cycle driven by monetary and fiscal stimulus. Is the war good? No, not at all. However, it is hitting an economy that is cooking with gas as they say. In 2007, bad news hit an economy that was weakening. In 2020, bad news hit an economy that was weakening. In 2026, bad news is hitting an economy that is accelerating.
Across the board, on a fundamental, behavioral and catalyst basis, the news is good. The economy is strong and accelerating. This is leading to better earnings. This means companies will continue to invest. It means companies will hire. It means consumers are doing fine.
With all of that info, Riddle Me This, Batman. Where is the stock market headed over the coming months?

Truckers are busy. I understand flatbed rates are through the roof and they’re turning down work. Is this due to the crackdown on non-dom drivers? Perhaps. Seems to be more to it, however. We’re building big stuff. HRC Steel confirms that.
Very insightful as always. Thank you Rich👍🏻