Spring Break
Across the developed markets, it is that time of the year when desks are sparsely-staffed and prices move for inexplicable reasons
It is that time of the year. You drive around town, and you see a lot of younger people hanging around in the middle of the day. The first thing that pops into your head is “why aren’t they in school?” Then you realize, it is Spring Break. My perspective is off because my kids are older, and we are not planning vacations around their Spring Break. Actually, we plan it around my college break which is earlier than that for middle school and high school students. This week and next week are also big holidays for European students. Around the world, people are focused on getting time away.
What does that mean for the financial markets? This means that the more senior people in the office, those with families of school-aged children, are headed on vacation. With junior people on the desks, they are tasked with doing as little as possible to affect the portfolio. Positions would have been reduced or hedged, and orders put out, with the charge to only call in a case of emergency. We see the same thing in August and around the Christmas holidays.
As a result, the market can tend to move less on ‘fundamentals’ as the portfolio managers and senior analysts are not around to make that call. The market ends up being more ‘technical’. By this, I do not mean that it is only the charts that matter. By this I mean that it is the technical aspects of market from a flow basis, can have a disproportionate impact on prices.
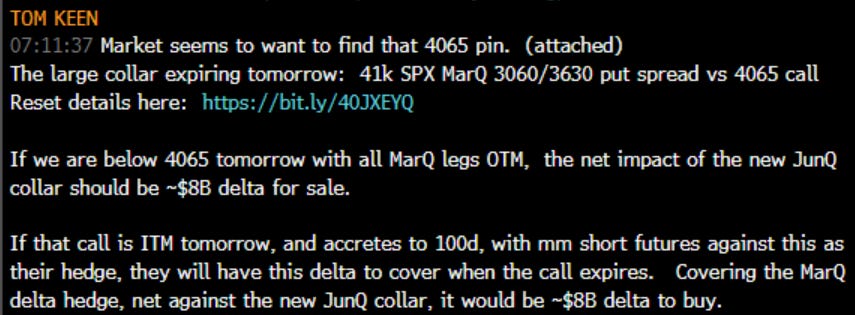
This past week was a case in point. It was the quarterly expiration for SPX options. There was a massive call option position expiring at 4065 in the market. The customer was short this call as part of a put spread collar position it systematically puts on. This is all public knowledge and the dates can be seen here:
My friends at Piper did the diligence on what the details were and what this meant for the notional amount of futures that needed to be traded. The customer would be rolling this position, buying a new put spread collar for June at the time this option was expiring. If we closed below 4065, there was $8bb to sell. If we closed about, there was $8 bb to buy.
As we can see, that as the market became confident that the futures would not close below 4065 strike, it became clear that there was $8bb to buy
Now $8bb is not a massive amount to buy for a market that historically trades about $500bb a day. However, when everyone in the market knows about it, and positions for it, and the rest of the market is out of the office or about to be, this type of flow can be a self-fulfilling prophecy. In fact it was. If you care what the next strikes are in June, my friend Henry at the Cboe highlighted the trade on Friday
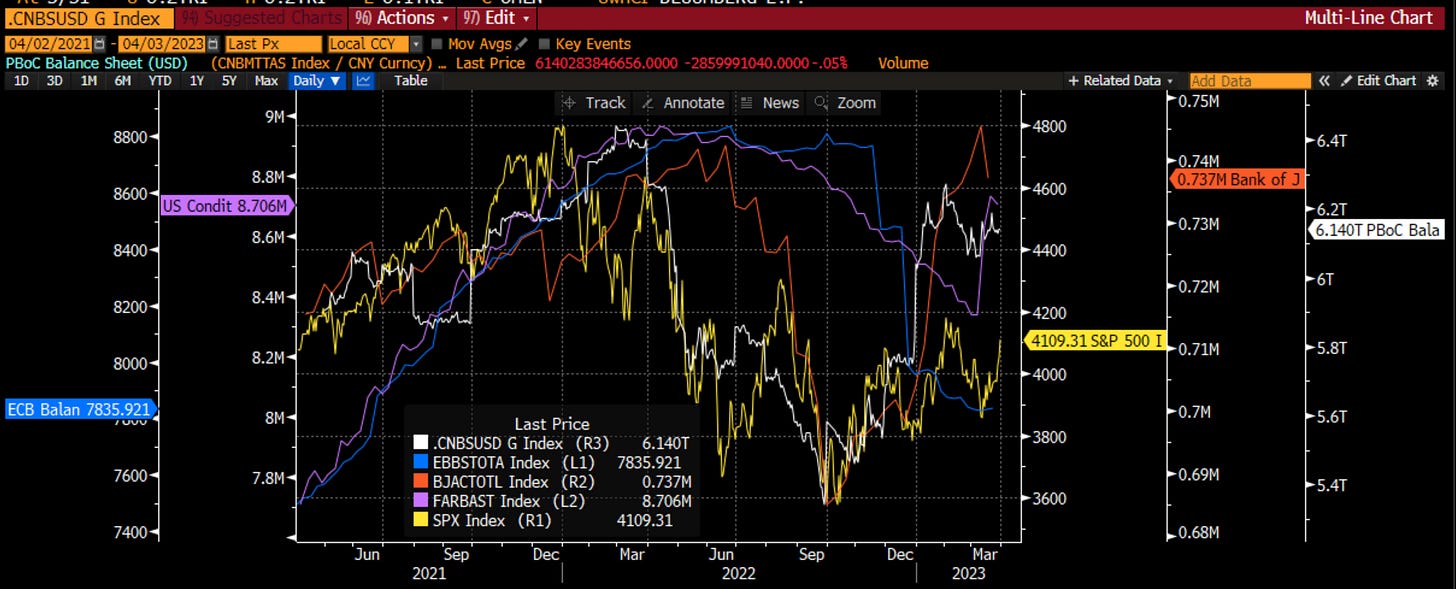
There is another technical aspect to the market, that is also driving futures higher. It was highlighted by Matt King from Citi on the recent OddLots podcast here. Matt spoke about the technical of the Big 4 central banks (PBOC, BOJ, ECB and Fed) adding reserves and growing their balance sheets in aggregate. The biggest drivers were China and Japan as you can see below, but the Fed balance sheet grew on the bailout of uninsured depositors at banks (in what was dubbed not QE). We can see the positive and negative impact the change in these balance sheets have on the SPX (in yellow) with China and Japan having a bigger impact than the Fed ironically enough.
In fact, if I dollarize and aggregate these balance sheets, we can see in particular there is a tight relationship with the NDX, the most attractive part of the US market that brings in the global investors, looking for growth stories.
Some people are interpreting this as saying that equity investors are viewing a soft landing or are more optimistic. This may well be the case. However, there is also a technical impulse to this, as the surplus cash needs to be invested, at least partially, in some stocks, and these are seen to be the most attractive. When I look at the NDX performance, we can see that typically, the forward P/E jumps ahead of prices, and then earnings ultimately catch up. On the downside, the inverse is true as the P/E declines before prices and then earnings come down. Right now, we can see that the forward P/E is jumping and the expectation for earnings is also jumping. This has put the index up 20% for the year, leading some to say we are in a new bull market.
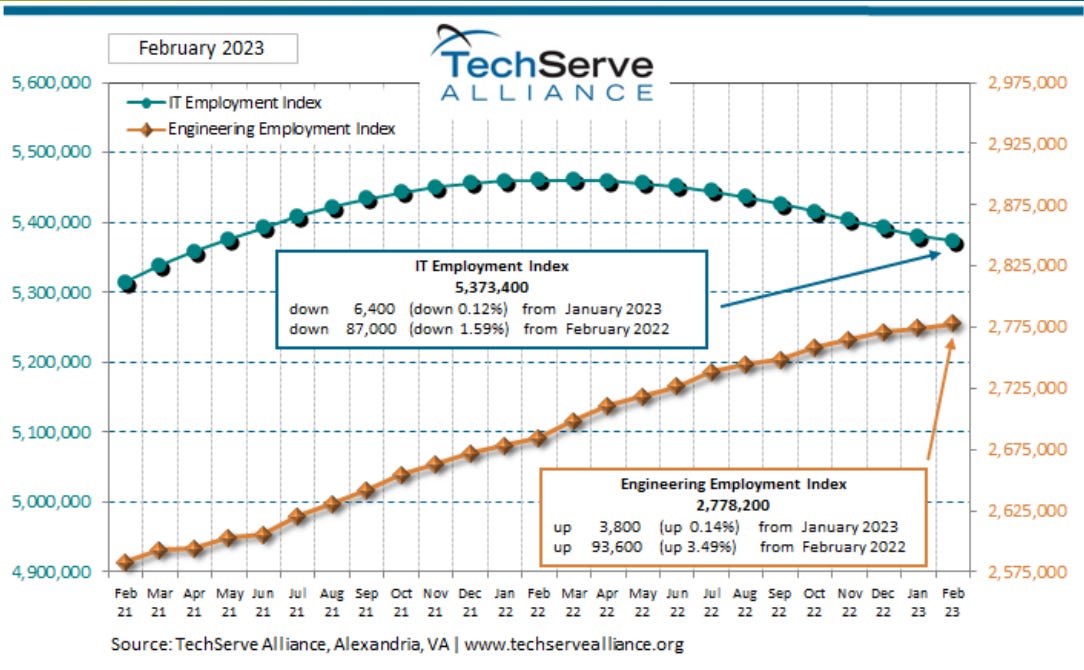
However, is it realistic to think that earnings are going to grow over the course of this year? Does the spike in forward P/E anticipating this make sense? We know the headlines of what mega tech has done with employment, suggesting the outlook is not as robust. We spoke last week about the impact SVB may have on the Valley overall. Here is a chart from the TechServe alliance that shows the outlook for employment among engineers and tech overall continues to deteriorate. This does not suggest to me earnings will move higher the way the market is presumably expecting.
For now, with many people on vacation the next two weeks, and the big part of tech earnings not until the end of April, there may be no resistance to the current price action.
That is also the biggest week of earnings in the SPX, though the week starting April 17, also has a large number of companies reporting. These are the big remaining catalysts in the near term.
For now, many others are focused on the positive seasonality of April, which you can see (top line) has been the best month for stocks the last 20 years on average. In fact, there is another strategist that pointed out April has never been negative in Year 3 of a Presidential Cycle. I don’t know if there are enough data points for me to think there is any significance to this, however, this is the type of narrative that short term traders are focused on.
I think it is important to consider what all markets are pricing in relative to any expected economic cycle. I go back to the intermarket analysis teachings from the CMT exam and pull out this chart, which stylistically uses bond prices, stock prices and gold prices as proxies and shows how each performs around the business cycle trough and peak. We can see that as we get to a business cycle peak. bond prices have been falling for some time and are in the process of bottoming. Stock prices are peaking coincidentally or maybe with a slight lead. Gold is rallying.
When I look at the current futures market, isn’t that what we see now? With the exception that stock prices are accelerating higher now, even though bond prices haven’t fully bottomed out. As you can see above, bond prices typically bottom out well in advance of stocks doing so. This may suggest that equity investors, perhaps driven by the technicals above, are not reading this cycle properly. I hear repeatedly that equity investors look through the bottom. However, prices don’t look through a bottom until it has been determined by bond investors first.
In some ways, it is surprising bonds have NOT bottomed yet. Bond yields still stay somewhat sticky high, perhaps due to QT, or perhaps due to banks needing to sell for liquidity. It could also have some element of concern about the debt-ceiling debate already, which won’t really kick in until the summer. The ratio of copper to gold, which has historically had a good fit with 10-year bond yields, is suggesting there are still economic problems ahead, but the bond yields haven’t sold off (bond prices rallied) yet as a result. All of this suggests to me that stocks are ahead of themselves.
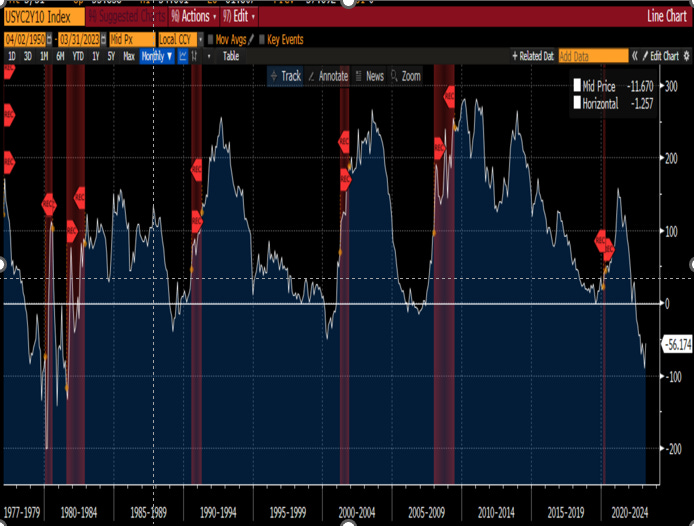
Another story I came across a week ago, which is actually from two weeks ago, highlights the views of the new Bond King, Jeff Gundlach. He highlights something I had put in Stay Vigilant a few weeks ago, the idea that the yield curve inverting says a recession will happen at some point, but when it begins to re-steepen, that is when we know this may be more imminent:
“Jeffrey Gundlach, founder and chief executive of DoubleLine Capital, predicts a recession could come within the next four months, saying the dramatic steepening of the U.S. Treasury yield curve typically precedes an economic downturn.
"In all the past recessions going back for decades, the yield curve starts de-inverting a few months before the recession," he said in a Twitter Spaces audio chat Thursday with Jennifer Ablan, editor-in-chief of Pensions & Investments.”
Here is that chart again:
Don’t forget the Jay Powell recession indicator that I referred to last week. Here is the quote and the chart of that again:
It all feels to me like a recession is fairly imminent, yet equity investors are looking for higher earnings? This really does not make sense to me.
If I am negative, what is the catalyst? One talking point I had this past week revolved around the risk for the Fed in pausing right now in order to assess the bank outlook. As I discussed this with market veterans, we felt there was a very real risk of inflation igniting again. This happened to Paul Volcker in the early 80s. Could it happen again?
Well, then I open my Bloomberg to see that OPEC+ is going to cut a million barrels a day, which will clearly put upward pressure on prices.
This is likely due to OPEC+ being upset with the relentless release of the SPR by the Biden Administration. It is unlikely you will see Biden buy a barrel of oil before the election if I had to guess. You can see the SPR is at 40 year lows now. In a world with higher, not lower, geopolitical risk, this seems to be a careless political move.
The aggregate of all of this is the supply/demand imbalance in oil. I have shown this graph before. When oil is more than 2% oversupplied, prices fall; when there is more than 2% undersupplied, prices rise. This latest chart, which was oversupplied at the end of last year but rising, does not even reflect the 1mm bpd (1%) that was announced this weekend. It won’t put it over 2% yet, but given the negative price action in oil previously, this will change.
We can see the impact that oil has on CPI. Corn, which is tied to the price of oil via the US ethanol policy, should also be expected to move higher. Food and energy moving higher will perhaps change expectations for CPI to continue to fall.
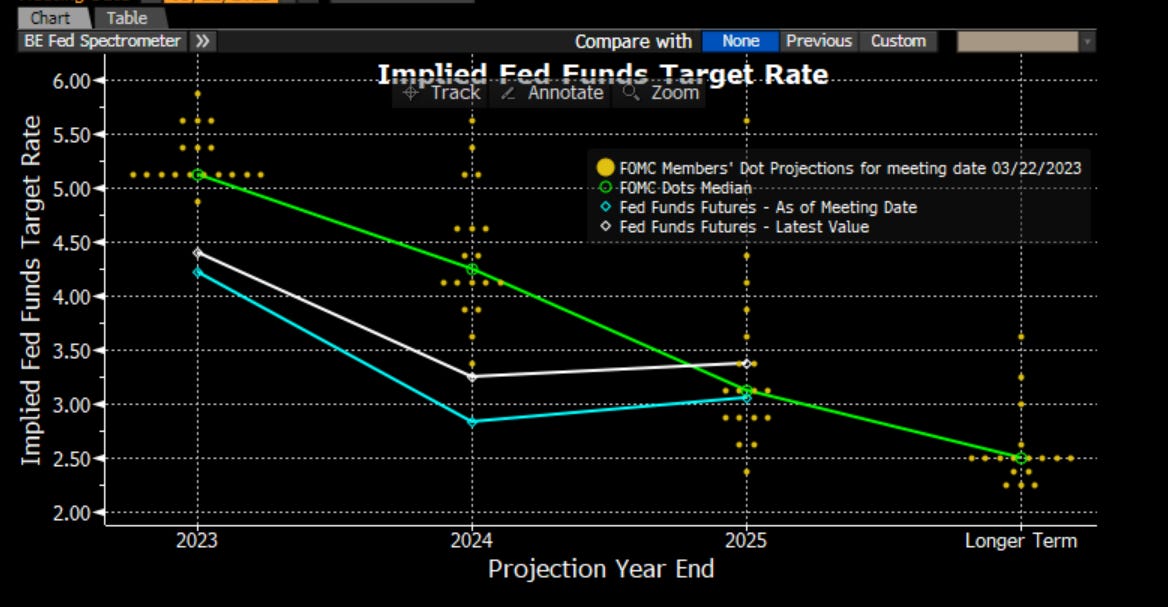
What does that mean for the FOMC? At least the FOMC saw no cuts this year. What does this mean for the market that saw rate CUTS priced in? It puts this at risk. Does this all start to sound like stagflation again?
The terminal Fed Funds rate had been falling. As this falls, the earnings yield of the market also falls. This means the P/E of the market rises. So if the terminal Fed Funds rate rises, and earnings yield rises, P/E will fall. Recall above, P/E is also rising right now. I can see from both the expected earnings angle, as well as the Fed angle, that P/E should actually fall and not rise from here.
All kinds of news and many moving parts. Truth be told, none of it may matter in the coming week. After all, it is a holiday-shortened week with the market closed for Good Friday this week. People are already on vacation or preparing to. So news flow may not matter at all in the coming week or two. As we get closer to earnings kicking off in earnest in 2 weeks (April 17), this could be the catalyst for the market rationalizing the moves we have seen.
Speaking of vacations, with Easter next weekend, I will not be writing a Stay Vigilant. I will be back in 2 weeks to assess what we have seen in these illiquid, holiday laden weeks.
For now, watch the technicals and be careful not to read too much into what we are seeing. Not all of the same market players are expressing their views in the prices we see.
This is the type of market in which to …
Stay Vigilant












I checked on the Y3 April thing in more detail, whilst it is impressive, if you go back to 1928 you will find that there are a few times that April of Y3 is negative, but not many and mostly not recently.
Loved the intermarket analysis diagram...saved it for future reference. Thanks and enjoy your spring break.