


Summer break
After a hectic start to the summer, taking some time to chill. But before I do ...


My family and I are headed to Glacier National Park this week. I have never been but everyone I have met that has been has nothing but the most glowing reviews. I am really looking forward to it.
We never really did the National Parks in the US when the kids were small. We were either living abroad or chasing kid sports and so didn’t have a chance. However, Covid gave us the impetus to do so, and we have done them ever since. Goes to show you the old saying “the best time to plant a tree was 10 years ago, the second-best time is today” holds not just for trees but for travel and even for investing. If you didn’t start saving and investing 10 years ago, well darn, but today is a good day to start.
Before I head off and turn my phone off (except for the camera), I wanted to look at a handful of charts that have caught my eye in the past week. While markets are clearly in a strong uptrend, if you are invested in AI stocks or in the broad NDX or SPX Indexes that is, there are reasons investors should just be aware, be vigilant if you will, to growing risks.
I wrote this LinkedIn post on Monday about where the market sees risk receding but I am not so sure given growing uncertainty:

Chart of the Day - risk relief?
As we come into a new week with investors in America returning to the office, the theme seems to be one of relief. As you can see in the chart today, implied volatilities as measured by V2X Index in Europe are lower, as are the spreads between French & UK bonds vs. German peers
Does this make sense? One could argue that the UK election went largely as expected. In France, while it was a surprise for the far left to win, the mkt was more worried about the far right & no party has a governing majority. Perhaps this is all good news
Stepping back for a bit, in the UK, Labour has promised to fix the healthcare (is that the type of system many in the US want?) by adding 40,000 appointments, scans & visits. It will pay for this by cracking down on tax avoidance. Empirical reality suggests that little money will actually be raised but the costs to the govt will surely go higher
In France, coalitions will be attempted but they probably have little hope of success as the differences are too stark. This would seem to suggest little could be accomplished. This sort of gridlock is what mkts tend to like except France has a massive govt debt problem to solve
In addition, the data from the US on Friday was perhaps not as good as it appeared on the surface. The headline number was again solid but not spectacular. However, we continued the trend of massive negative revisions to the 'hard data' from the govt
It is hard to see how we can trust that things are really as good as the hard data has suggested. Importantly, the Sahm Rule for recessions crept higher again and is now at 0.43. Recall 0.5 is the level when a recession has always happened. It seems we are getting close
Throw into the mix the political uncertainty in the US. Stories over the weekend of powerful Democrats urging Biden to step down. The President seems resolute in his desire to continue. What will this mean at the convention?
If the President does step down, what will that mean for the nominee? Will it be VP Harris? Someone else? Again seems like risk is only beginning and not ending
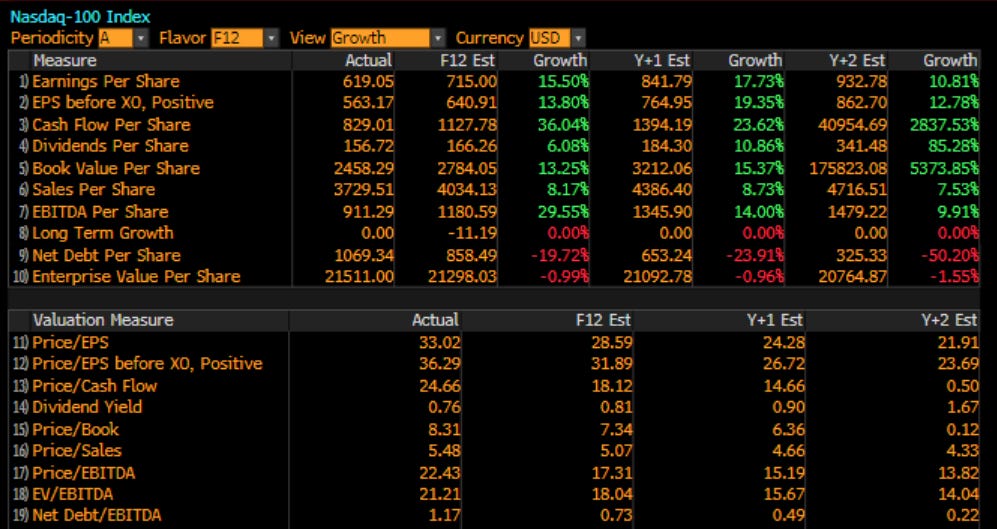
Finally, we start earnings this week. The expectations for growth are about 9% this quarter, the highest since 2021. Over the next 12 months it is a positive double digit growth expectation. While companies (at least a handful) have driven beats in the past, this bar is again quite high
Many things point to the possibility that risk is only entering into the framework, at a time when we get a sell-off in risk measures because the mkt things we should buy the rumor and sell the news
This can be a successful strategy, but I think stepping back points to quite a few things that can still go wrong from here
I then wrote this post on Tuesday, showing where there may be signs of growing risk in the markets:

Chart of the Day - risk tension?
Yesterday, we looked at how some markets, namely Europe, might be showing signs of a relief in risk concerns, but posited if that was really what should be happening with so much uncertainty
Today, I want to look at a market which is showing signs of tension, of growing risk, which could spill over into other markets. Is this just an oppty to BTFD or HODL?
Bitcoin has moved below 60k and is not looking very healthy. A few weeks ago, in a post called "Please hold", I pointed out that the crypto index was at a very precarious point. It could either bounce to new highs or break down & lead to a 15%+ correction. The latter is happening
The top chart today shows you the price action of Bitcoin. You can see it has broken below the 60k level which isn't just a psychological round number. 60k is the average price people who have bought Bitcoin this year are long from
This is approximately the price that all of the money that has rushed into the new Bitcoin ETFs has traded on average. That means the average account that bought Bitcoin ETFs this year is now down money
The recent catalyst could be the Mt. Gox settlement in which $10 bb worth of Bitcoin could hit the mkt. Mt. Gox was formerly the largest crytpo exchange but it was hacked and billions were lost. It has been recovered to some degree & is being paid back after 10 years
Perhaps those that receive won't all sell it. Perhaps those that lost it, replaced their Bitcoin, & this is just found money they didn't expect so will monetize. Time will tell
However, simply looking at the technical charts, this is headed to the 38.2%-50% retracement zone or 49-55k, which would be about a 33% fall from the highs and put recent buyers solidly underwater. Will they panic & sell or will they HODL?
The bottom chart overlays Bitcoin & the NDX. We can see that over the last 5 years, these charts have largely mirrored each other. Both are examples of disruptive technology & growth. Both are examples of ebbing and flowing risk appetite
One is breaking down while the other hits new highs. One just had a catalyst which may shift supply & demand near term. The other is going into a catalyst where the bar is set really high
This could be early 2021 when Bitcoin sold off but stocks marched higher & Bitcoin then followed. Or it could be early 2022 when Bitcoin sold off & then the NDX did as well. That is for you to determine
For me, the supply & demand dynamics in an asset that is seen as a harbinger of risk appetite have me worried. I think it is a sign of growing risk tension
All of that said, there were a few other charts I wanted to look at which have caught my eye, and I think the market’s attention. The first comes from the labor market. The Sahm Rule, created in 2019, is based on the rolling 3-month average of unemployment vs. the previous 12 month low. Back-testing has shown that whenever the difference moves to 0.5%, two things happen: 1. it moves a lot higher after 2. we have a recession. Well folks, it is at 0.43. This is worrying because two more months of 0.1% increase in unemployment and we will be there.

This excellent chart from Francois Trahan at The Macro Institute, shows that state level unemployment gives us a good indication of the direction of unemployment at the national level. Warning bells should be going off.

Second, you know my love of the ISM. I discussed the ISM and New Orders last week. The manufacturing ISM was mixed, with headline weaker but new orders bouncing. However, people haven’t been buying ‘stuff’ for a little while. The part of the economy that has held up very well has been services, as Boomers travel and eat at restaurants, and companies hire consultants to figure out their AI strategy. Well, ISM services numbers came out on July 3 after I had written and were very week. This shows the expectation, the actual and the previous month. You can see the headline moved into falling growth, employment dropped, and new orders dropped. No bueno:

If we combine the manufacturing and services, in the proportion that they are of the overall economy, we get a look at the ISM total and the New Orders total. When this measure has hit 47 in the past, we have had a recession. It is just above at 48.77 but it is falling rapidly. Again, another warning sign:

Finally, earnings start this week. Every quarter these have largely delivered. My mantra is stocks follow earnings and earnings follow the economy. If earnings deliver again, no one will care about the above two charts. However, as we enter this period, it is again important to note that the bar is REALLY high:
I will leave you with that. I am going to be out of pocket and not checking in until I get back. I wonder if I come back to Groundhog Day or if things will be different. Right now, I can’t say I care as I am excited to head to Glacier.
Stay Vigilant

Enjoy your trip, Richard. I have traveled thru the Glacier National Park via train to Seattle. It is beautiful.
Re: your post today...best tweet I read this morning "The US economy is so bad that people are living airport to airport..."
I am also concerned about the growing weakness signals that the economy is giving us, while the stock market continues to grind higher. Perhaps not a bad time to break away from the screens and take a vacation. Cheers!