Sun and Fun
Back from a golf trip with college friends, it's time to look at what happened in an exciting week in the markets
The annual golf trip with college friends was this past weekend. Too much sun and always a lot of fun, this annual venture also helps me gain perspective on what is going on in the economy that you may or may not find out from simply looking at the economic data.
Of course we spoke about AI, but it was more in the context of what this might me for a labor force disruption. Who is most at risk? Is it a certain industry, a certain skill or a certain age bracket? We certainly hear of more companies strongly encouraging employees to get back in the office, and the incremental fear that a machine and not a person may replace you is another tool in the toolkit. I have to think about this more but I didn’t hear anything that made me more bullish on the economy. That said, it also seems very unlikely a 2008 type of event will happen either. Just a continued slowdown from the red-hot pace of 2021.
When I come back from long weekends, it is also important to look at the news of the week, and importantly, the reaction to this news.
FUNDAMENTAL
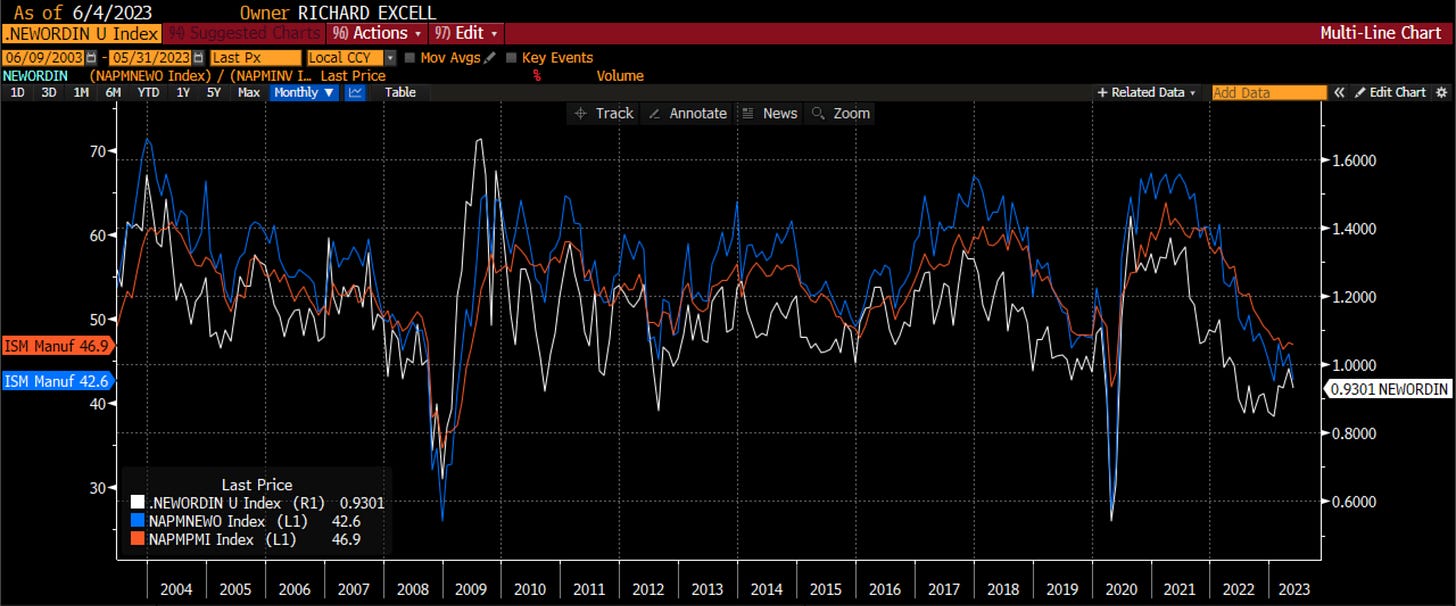
The most important news for me is always the ISM data. It is the best forward-looking measure of growth that is also coincident with the equity market. You can see the historical relationship but also see the disconnect between what stocks are currently pricing in (better economy) versus what we are actually seeing. Perhaps this is only because a handful of names are driving the market and the bulk of stocks are in fact pricing in this slowdown. Like I said, it is coincident with the market and so it is important to know that it came in worse than expected. What can help us determine where ISM itself is headed?
For this I like to look at either the ISM New Orders Data or the New Orders to Inventory ratio. It makes intuitive sense that orders will pre-empt all other aspects of the economy. On this front, new orders feel again after having held up a bit better, which had cause the new orders to inventory ratio to perk up and hint at a bottom the last few months. Not this month. It is moving back lower suggesting there may be some struggles ahead.
We also see this in the regional Fed data. This past week we got the Dallas Fed data which was also much weaker than expected, taking the geometric average of the regional Fed surveys lower too. Another indicator saying we have yet to see the bottom in the ISM.
We also saw the MNI Chicago PMI data. Being in the center of the country as a transportation hub and increasingly a distribution hub for e-commerce, Chicago does get a feel for how the entire country is doing. The number was pretty shocking. This was another indicator that was hinting at a bottom in ISM but which is now telling a different story.
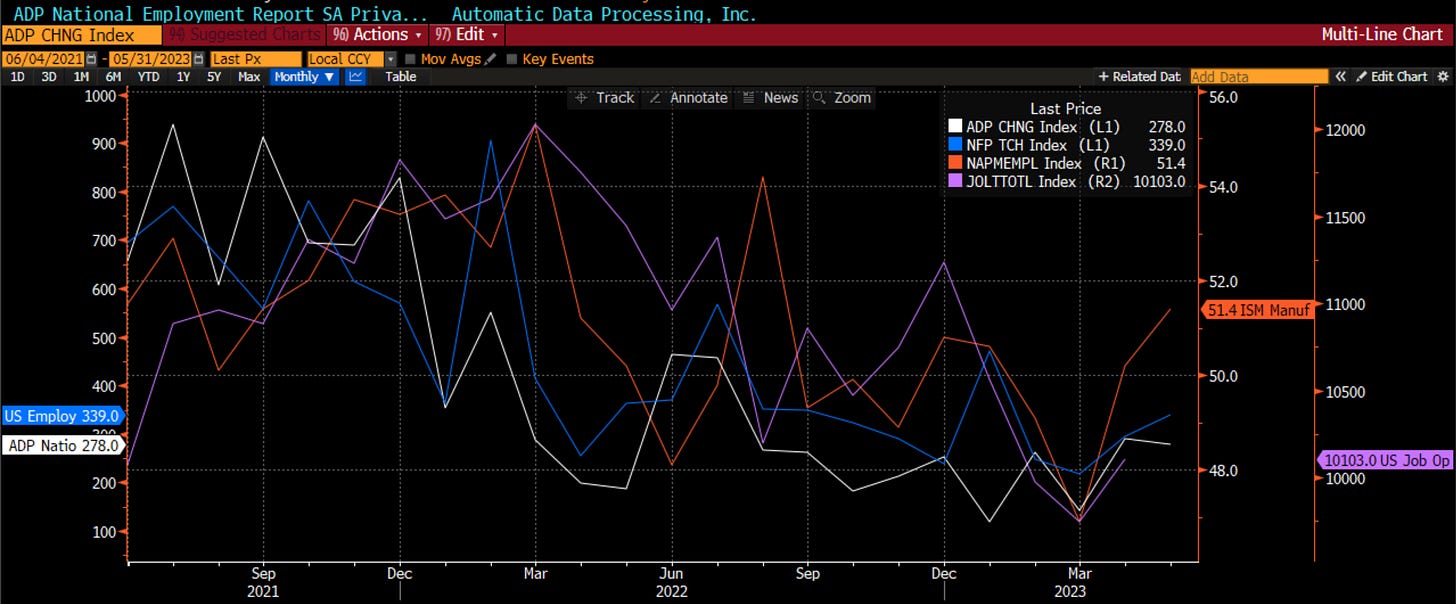
Given this expected slowdown in growth, it is perhaps surprising to see strong jobs numbers. I am not just referring to the non-farm payroll number on Friday. I never look at only this number because it is lagging, subject to multiple revisions, and skewed by birth/death adjustments. Over the last 4 days, it was not just NFP that was stronger than expected. ADP numbers were also better, as was the ISM employment data and the Job Opening/Labor Turnover survey. They all corroborated that jobs are holding up better than expected. Recall I have said several times that we may see a '“job-full recession” which would be the opposite of the “jobless recovery” we saw post GFC. In that period, the 1% did well and the 99% still struggled. I think with more companies focusing on all stakeholders more, and supply chains being rationalized, we might see the 99% do well while the 1% struggle. We are seeing this with high profile layoffs in tech and investment banking, while education, healthcare and leisure are still hiring away.
This of course makes the Fed’s job a little harder if employment is staying strong even when other measures of economic growth look weak. Recall Jay Powell has told us that the way he intends to slow inflation back below 2% is through the labor channel. So what do you think Jay saw this past week? The market actually took the odds of a hike in June and July down a little bit as the result of all of the data. However, the bond market has been more dovish than the FOMC many times. We have 10 days until the next meeting. Will higher for longer still be a thing?
In general, I still feel there are headwinds to the economy and the FOMC is still potentially in play. Thus, I still feel the fundamental backdrop is still negative for risk.
BEHAVIORAL
All year long, we have seen the tension between the fundamental and the technical. The data is giving us one story, yet the price action in the market is giving us another. Last week was no different.
With the move on Friday, the SPY broke out above the resistance level in the pennant formation. This continued strength would point to new highs. The market does look a little overbought right now, but this is a strong technical pattern.
We do not see the same strength in the equal-weighted S&P however, This index is running into resistance at these levels and continues to lag the broader market. This means that unless you own about 10 names of the SPX, your portfolio is probably pretty flat for the year. The returns on this index look much more consistent with the economic story.
Small caps had a really good day on Friday but they too are running into resistance at these levels. The big move on Friday had the feel of very active short-covering and thus may not be sustainable.
I had written about the Nasdaq vs. Russell 2k relative performance on a note and on Linked In on Thursday. I discussed this with other people too. The general sense was ‘I hear your point, but who wants to own small caps instead of tech?’ Then on Friday we see the Russell outperform the Nasdaq by 3%. This had the feeling of short-covering by people who were probably long QQQ and short IWM.
We also saw the Goldman Sachs basket of the most shorted names rally 1.3% on Friday which further indicates that we saw short-covering. However, you can see that this index also formed a doji which is quite interesting after a big move higher. It is potentially another sign that the market is getting a little exhausted.
If we look across to other markets, namely commodities, whether it is copper or oil or the raw industrials commodities, all are on or near their lows which still is suggesting the economy is not doing too well. This is not just the US either, but China has also disappointed on the growth front.
The options market is much more upbeat. If I look at the 20 day moving average of the put-call ratio (inverted here), it gives a good signal that corresponds to the market. Right now it is still suggesting stocks head higher. Until this peaks, it is hard to get too bearish on the market.
Finally, another metric from the options market is the shape of the VIX curve. This also can help us predict short-term moves in the market. It is also giving us the all clear for stocks.
While there are some signs of trouble (commodity prices, short-covering price action, lack of breadth in the market), overall, the category still rings pretty positive to me. Thus, I would give this category a positive but want to keep a close eye on signs of exhaustion occurring.
CATALYST
We are moving into a period where the catalysts are really going to be about the Fed and positioning into the summer. I covered that discussion in my post on Tuesday. We no longer have earnings news as a catalyst. This past week was the big week for economic news. Most importantly, we avoided any problems from the debt ceiling negotiations. Thus the catalyst section gets pretty quiet.
I covered the debt ceiling and what should happen now in my recent Macro Matters podcast with Monique Thanos and Tony Zhang. You can listen to that here. The punchline is the liquidity build of the Treasury General Account is the big thing to focus on. It will have to go from under $100 bb to almost $1 trillion in fairly short order. Where will this liquidity come from? Bank reserves? Probably not. Foreign accounts? Maybe but the BRICS countries seem less interested and the FX hedging will be too expensive for Japan. Last place will be money market accounts. We are already seeing individuals sell stocks and raise cash that they can get 5%+ risk-free on. This will be the big hurdle for stocks this summer.
The catalyst section is thereby neutral, but I may look to change it quickly if we see more indications that individuals are selling stocks to buy US T-bills.
In total, the fundamentals are still negative but the technical picture is offsetting this. There are no more imminent catalysts and so I have to be neutral in my positioning. For me, the risk-free return just looks too attractive at 5%. Sure, if you owned the S&P 500 or Nasdaq 100, you are doing better. However, the S&P equal weight is flat for the year so you would be doing worse. If you were in small caps, you would be losing. It all depends on how your portfolio was positioned. Cash with some tactical options still seems like the best strategy for me. It is still time to …
Stay Vigilant


Beautifull content as always, thanks
Great piece!