


That ship has sailed
What do supply chain disruptions and sea shanties have in common?


“Come all you no-hopers, you jokers and rogues
We're on the road to nowhere, let's find out where it goes
It might be a ladder to the stars, who knows?
Come all you no-hopers, you jokers and rogues
Leave all your furrows in the fields where they lie
Your factories and offices, kiss them all goodbye
Have a little faith in the dream-maker in the sky
There's glory in believing in
And it's all in the beholder's eye”
- “No-hopers, jokers and rogues” by the Fisherman’s Friends
My daughter, the designer of the Stay Vigilant logo, stumbled across a unique niche of the musical world - sea shanties. Growing up in the Midwest, far from an ocean (but next to Lake Michigan which to most people’s surprise, looks like an ocean), there is not a big culture of commercial fishermen. Perhaps there was at one point, but when the refineries and manufacturing moved in, I think that largely stopped.
One of her favorites is Fisherman’s Friends and as I scrolled through their extensive list of shanties (must be a fun day out with these lads), I came across this one titled “No-hopers, jokers and rogues”. Perhaps it is 30+ years in the market, more likely it is 30+ minutes on Twitter, but when it comes to the markets, there are plenty of no-hopers, jokers and rogues!
However, with markets at all-time highs, one always has that thought in the back of their minds that “We’re on the road to nowhere, let’s find out where it goes”. Some may even make the fatal mistake of confusing brains and a bull market and choose to “leave all your furrows in the fields where they lie, your factories and offices, kiss them all good-bye”. Unless, of course, you are the Beachman who left the corporate world for analyzing the stock market and does a really nice job of it (you should follow if you aren’t).
Sea shanties were on my mind as I continue to stumble across a couple stories that I don’t think have fully played out in their impact on the markets just yet. The first one I touched on last week in “The good, the bad and the ugly”, which is the collapsing of volumes in the Panama Canal due to the drought in South America. As I mentioned in the slides, the time to get through the Canal has lengthened from 5 days to 3 weeks, an eternity if you are on the ship and awaiting passage. We can see from this chart, that volumes have collapsed. Bear in mind that 40% of cargo to North America goes through the Panama Canal. Sure, one can say this can be re-directed to other ports. However, the logistics may not be in place to handle getting that cargo to the right place, and with the archaic Jones Act still on the books in the US, ships can’t just go from port to port in the US. Thus, we are setting up for another ‘supply chain shock’. Remember how that went? Remember the double ordering that goosed the economic data, led to delays in getting anything built (housing is meant to be a driver), but importantly drove inflation higher? Remember we are counting on an easy Fed? This chart overlays Panama Canal volumes and US GDP. Could we be at risk of a hard landing that will be explained away but would still be a hard landing? I don’t know, but I do know it is not priced in.

It isn’t just the Panama Canal either. The Suez Canal has its own problems. With this canal, we have a history with disruptions. Remember the Ever Given that got stuck in March of 2021? Remember that the impacts were felt throughout ALL of 2021, even well after it was resolved? Well, that obstruction was resolved relatively easily. This one, as Borat might say … not so much. This one is caused by Houthis launching missiles at cargo ships and oil tankers. Why? In solidarity with Hamas and Hezbollah. This tells me that the Houthi missiles and drones aren’t going to stop until the Gaza events stop. Will that happen in the next month? Three months? Do I have any edge in calling that? Even if/when they do stop, the effects will be felt for many months after this. We can see the big spike in EU GDP when the Suez was blocked, primarily from double ordering. We then see the correction. You can see this drop in volumes is much larger than 2021. Are we in for Suez Canal redux?

I know what you might be thinking as I thought the same thing. Isn’t the Suez Canal really a European problem? Do US investors really need to worry about it? Well, for one, I am lucky enough that there are readers from all over the world, so I do care about it. However, even the average US investor needs to care about it. Why? Well, the double ordering I discussed means that container rates from Shanghai to Rotterdam are moving up considerably (white line). This means ships get pulled onto this route from other routes, such as the Shanghai to LA route (in blue). Thus, prices to LA go up in sympathy. Sure, these costs for both are only up 150% right now. However, these problems are only just beginning too. The orange line is EU area inflation, and the purple line is US CPI. We can certainly see as these shipping rates moved higher, inflation moved higher as well. Will it go up as much? In some ways, I don’t think it matters. If it goes up at all it means the FOMC can’t cut rates as the market is expecting. If it goes up at all how will the ECB react when Germany is already in a recession? At least with a single mandate, the ECB is able to look at inflation as a tax on consumers. The Fed, again as Borat would say … not so much.

Moving back to the US, as this is the market that everyone in the free world seems to be long at the moment (shades of the mid-90s savings conundrum that Greenspan discussed), perhaps it is the shipping problems already percolating. Perhaps, it is the impact of higher wages throughout the logistics vertical (rail, trucking, air, last mile) that are hitting home. Either way, small businesses are intending to raise prices. This chart (and most of the rest of them) come from Nancy Lazar at Piper Sandler. I have known Nancy for a long time. She is simply the best economist on Wall Street. Extremely thorough. Very well-followed. Always thinking about moves several steps ahead. This past week, she highlighted many of the problems at small businesses in the US.
As an aside, small businesses make up 99.9% of all business in the US and employ 49.5% of all employees as well. 80% of small businesses have no employees, so they outsource everything, and those costs hopefully get passed along. Well, if small businesses are planning to raise prices, doesn’t this tell us that the gently falling inflation many are trying to will into existence may not be a thing?

It isn’t entirely clear small businesses thing this pricing idea is going to work. Sales volumes are dropping pretty sharply.

Revenues = price * quantity. What do you think of small business revenues? I can tell you what they think

Maybe it is these factors or maybe it is the lack of access to capital as banks reign in their lending. Either way, this cohort of the economy that employes 45.9% of workers hasn’t been this downbeat since the Great Financial Crisis. With urban areas getting hollowed out, maybe we are seeing the impact here.

That’s okay, it will get better. Right? Well, see for yourselves. We have bounced from the depths of 2022, but are still at levels that are the worst in 40+ years of data.

When you aren’t making money and you aren’t feeling so great about the outlook, you tend to not invest in your business to grow. Capex plans at small businesses are once again falling.

For the record, this does matter for US GDP. Another potential shock to GDP that is not really being priced in.

I want to pivot really quickly to another thread or narrative that is taking hold in the markets. Again, I refer to charts from Nancy Lazar but I can recall Barry Knapp at Ironsides Macro talking about this early last year. He mentioned it on the podcast I did with him on Stay Vigilant. He is another great follow.
The idea here is that gross domestic income, a measure of the economy based on all income earned, may be doing a better job at measuring what is happening these days than gross domestic product, which looks at output and not incomes. These should be tied at the hip, and you can see historically they have been, however, there has been a dislocation of late. You know I like to highlight these dislocations.

We can see that GDI did a much better job helping us anticipate the problems in 2008 than GDP did. GDI was falling sharply in 2007 and this weakness carried into 2008. GDP, on the other hand, didn’t really tell us there was a problem until it was almost over.

It isn’t just Wall Street that is onto this. Federal Reserve economists have studied this and found that GDI might be a better indicator.

I am not here, as Chicken Little, saying the sky is falling at all. I am just highlighting where there are some potential dislocations in data that the market is not fully anticipating or pricing in. As portfolio managers, as risk managers, we need to think about what can go right, but also, what can go wrong.
Speaking of the market not anticipating something, the market was caught by surprise on CPI this week. If you were reading Stay Vigilant. You were not. Listen, I know I get a lot wrong, we all do. However, once in a while the blind squirrel finds a nut. This is what I said on LinkedIn this week:
Chart of the Day - I told you so
Let me start by saying that I am not one of these finance social media punters that is always touting how great I am and then trying to sell you a newsletter or get you to invest in my fund
I am also one who is more than happy to tell you when I have gotten things wrong and I have done that many times. Expecting a recession last year was one of those times for sure
However, when you get something right, I think it is also worth pointing out. That is not to toot my own horn, but more so to highlight the risks that are still very apparent in the market that are not being priced in
Two weeks ago I went through all 5 variables that are in my CPI forecast index. These are based on variables my students come up with regularly. I showed the impact of each of those on CPI and suggested what I thought could happen
You may recall, not all pointed to higher CPI, but most did. None pointed to a lower CPI with 1 suggesting it stays flat. Thus, I was thinking at best CPI stays flat at an elevated 3% ish level (well above target of 2%) or at worst, it re-ignites and heads back higher. You can see this in the top chart
Today CPI came in at 3.1%, well above the 2.9% expected by the market. Yes, below 3.4% last month I acknowledge. However the core CPI, ex food and energy, was flat at 3.9%, almost double the target rate. This is not a number that screams 'five rate cuts in 2024'
That, my friends, is the major risk here. I also showed you the bottom chart before and I highlight it again. The historic rally in stocks & bonds at the end of last year came as the mkt priced in aggressive Fed cuts
2 year US yields fell from 5.2% to 4.2%. This drove forward P/E higher and stocks ripped. Not because of earnings. Almost entirely because of multiple expansion. The longest duration, highest beta stocks ripped the most
Look at that chart again now. 2 yr yields are back up to 4.6%. However, forward P/E and stocks are still near the top. Did we see earnings across the entire market that would justify this? No we didn't. We saw it in a few names
Should the multiple stay at expanded levels if we aren't going to see the rate cuts we expected? No it shouldn't
Have investors priced in the perfect outcome of rate cuts and soft landing and ignored we could get either soft landing and no cuts or rate cuts because of a hard landing? Yes they have
Be aware of what is priced into expectations and what could go wrong that changes those expectations. Markets move at the margin

Back to Nancy’s chart on the CPI diffusion index. Does this look like gently falling back to trend such that rate cuts are in order?

If this were a stock, you would buy it and not sell it.

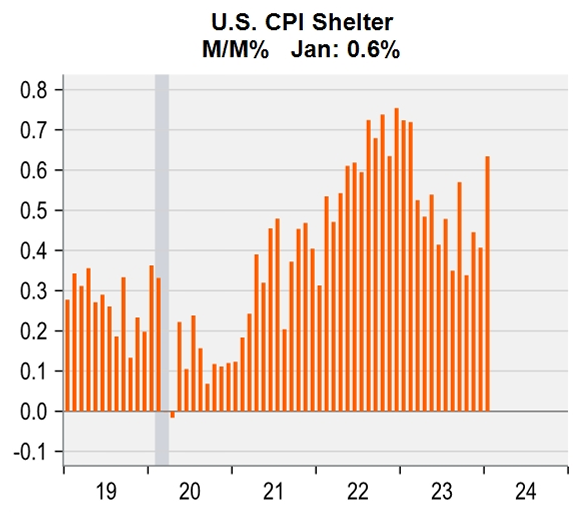
Yes, shelter was a big driver of the number. With Millennials forming households and demanding houses, do we think this is going to collapse regardless of what Zillow says?
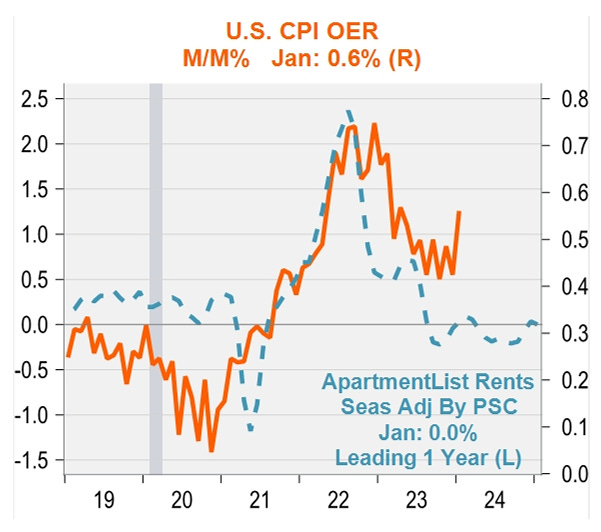
Yes, the CPI OER does tend to move in line with these online services. This may take some time though.
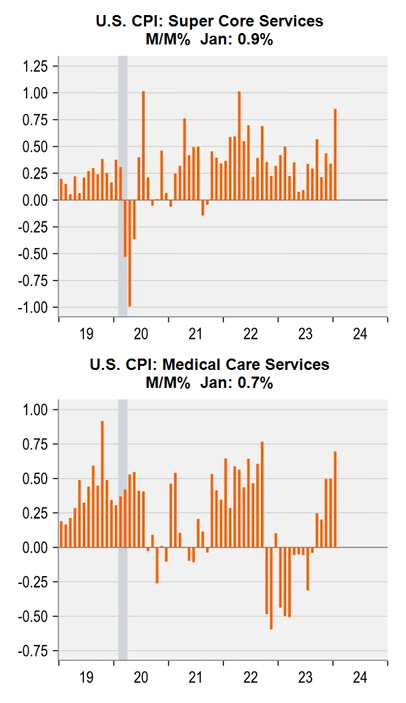
Remember that ex-food, energy and housing services number the FOMC presumably cares about? As John Candy said in “Planes, Trains and Automobiles”, you are going the wrong way! How about medical costs? Not that there aren’t scores of retiring Boomers demanding more and more healthcare each day or anything. Rate cuts? Not so much
I know I write missives like this, and people think ‘man, he is really bearish’. I presented my missive last week to a company and they asked, ‘Do you write for ZeroHedge?’ No, I don’t and no I am not super bearish. I just believe that the market is pricing in wildly optimistic outcomes. These can happen. These can persist for many years. I think there are a lot of similarities to the late 90s, but is it 1996 or 1999? If it is 1996, there are still big gains ahead.
This is the difficulty in managing money. However, as we saw in the slides last week, option insurance, particularly downside options, are relatively inexpensive. In addition, the yield curve and real Fed Funds suggest this can be a more volatile year. Heck, the shipping charts and small business data suggest this can be a volatile year. So, I am not saying get out of your stocks that are minting you money. I AM SAYING, consider how you implement your ideas, consider how you look at your portfolio, consider adding convexity or long options as a way to help you be more prepared for potential shocks that the market is ignoring. I AM SAYING don’t be a no-hoper, joker or rogue. If the market corrects, make sure you ship hasn’t already sailed.
Stay Vigilant

fantastic read
Excellent post like usual Richard, thank you for all the time and effort you put into writing these!