The behavioral biases of the market
It is not just fundamentals that drive prices, but supply and demand that do, particularly in the short-term. How do biases affect this flow?
Throughout my career, I have had the good fortune of investing in many countries and in many asset classes. The commonality across all of these is that behavioral biases affect the decisions being made. This is not just a retail problem, but an institutional problem as well. This is a problem that I myself face. As a result, I have tried to add into my investment process a way to objectively look through a variety of information that helps me combat these biases. I am going to focus on a handful of biases that I think are the ones we all face the most, and some of the charts I look at to help me get over this hump.
The first type of bias that I focus on is Anchoring Bias. It is a cognitive bias that causes us to rely too heavily on the first piece of information we are given about a topic. We don’t even realize we do this. I recall in grad school being part of experiments where we were asked to guess something e.g. the number of countries in the world. Then we spun a rhuelette wheel and got a number. When asked to adjust our guess, we invaraibly raised or lowered our guess based on whether we got a lor or high number on the spin. Completely random and independent events. However, it had an impact on us nonetheless. What is the biggest piece of information that we all tend to anchor on in investing? Valuation particularly relative to peers. I have heard students talk to me about a ‘conservative’ multiple of 20x EV/Revenues as well as ‘overvalued’ numbers with a P/E of 8x. We should certainly get the information of what similar companies look like, but in absolute terms, we need to ask ourselves how are we going to make money?
In the world of #FinTwit, the anchor is on the SPX P/E. Often it isn’t even on the correct version as people look at Price to trailing earnings or the even more useless Shiller cyclically adjusted P/E. There are so many problems with looking at index level valuation over time given the changes in index composition. For example, should an SPX that was full of banks and energy in 2007 be compared to one full of technology today? That said, if we are going to anchor on something, we should anchor on forward multiples and ideally the forward EV/EBITDA which factors on the way companies finance themselves. This number should also not be considered in a vacuum. The ‘right’ multiple is a function of the cost of money in the market. We intuitively know this when we calculated the WACC for our DCF. The Fed knows this when it lowers rates to push us out the risk curve. However, the Twitteratzi seem to forget this too often. This is why stocks were not necessarily overvalued when rates were zero but why they may very well be overvalued with short rates close to 2%. The chart below looks at the forward multiple relative to the 4th Euro$ contract, telling us where the cost of money is headed. With rates presumably headed higher, there seems like there can be some continued pressure on multiples maybe not to the lows of 2018 or 2020, but I think it is safe to call the rate expectations a headwind to risk-taking.
Another way to think about valuation, from a very different perspective, is to compare the dividend yield of the SPX to the 10 year Treasury. It is not apples to apples, but it is a comparison that financial advisors inherently make for their clients over time. Retiring clients want to lock in a lifestyle if they can. US government bonds have been the place to do this. When rates have been too low, sometimes advisors may look at dividend paying stocks. At the very least, it may indicate where the opportunity cost is higher. Right now, we are looking at a 10 year yield that is almost double the dividend yield of the SPX. Sure, there is a buyback yield as well. There is also credit risk in stocks you don’t (yet) have in the US government bonds. This is another potential headwind for stocks.
A second type of bias we all contend with is Confirmation Bias - the tendency to interpret new evidence as confirmation of one's existing beliefs or theories. A variation of this is Cognitive dissonance which occurs when newly acquired information conflicts with pre-existing understandings, causing discomfort. Everyone is guilty of this, particularly when they are passionate about an idea. What are people more passionate about than the money they have invested. I try to avoid this as best I can but looking at a variety of indicators that consider information from a number of different viewpoints.
The first is an indicator I came across from the legendary Ed Yardeni. If you have ever watched financial television you know how. Lately, he is all over social media too. This indicator has some intuitive logic to it. The FSI is an index calculated from jobless claims, consumer confidence and CRB raw industrial prices. This tells you how consumers and companies are feeling about their current condition. If both groups are feeling good and the indicator heads higher, so shoudl the stock market. The converse is true as well. It helps us stay grounded when the stock market is having wild gyrations, though as we saw in 2020, this indicator itself had extreme moves. When it is confirming the move in stocks, it si time to have more confidence in your bullish or bearish view. Lately, there is a disconnect. The FSI continues to head higher in spite of the weakness in stocks. This is an indicator that prevents me from getting too bearish right now.
Another view to consider is that of Wall Street strategists. Perpetually a bullish crowd, it is still interesting to watch to see the extent to which they change their year end forecast when we see moves in the market. They are human after all, and tend to see their forecasts affected by the market itself. The reduced target in 2020, only to completely retract and head higher is a great example. In spite of early year weakness, forecasts have only come down a little bit. There is still an element of bullishness on Wall Street.
Main street doesn’t feel quite so flush. Perhaps they didn’t just have their bank accounts filled with record bonuses. Perhaps it is because they actually have to go to work in the office or factory and not work from their condo in Manhatten. Either way, small business, which hire more workers than any other segment of the economy, are not feeling too great right now. They typically have some pretty good leading properties of the economy (they do hire a lot after all) and seem to be suggesting that the move lower we have already seen in the ISM could have more to go.
Something we all need to keep in mind is our feelings of Loss Aversion - the observation/reality that human beings experience losses asymmetrically more severely than equivalent gains. For an institutional investor, the fear of loss is exacerbated by the fear of potential outflows from your fund and, if severe enough, the loss of your job. I can tell you this is a very real and rational fear. As a result, when investors are really nervous, they buy insurance - they buy options to hedge their portfolio. They don’t do this at all times because systematic option purchases are a drag on returns, which cause one ot lag their benchmark and also risk outflows. So we can see when nervousness is high, or when complacency sets in, by looking to the options market.
A great measure of this is the ratio of the number of puts trading to calls trading. When this ratio is moving higher, investors are getting nervous and security prices tend to be moving lower. Conversely, when this heads back lower, investors feel better and are probably either unwinding their hedges or selling calls against their long stock. I look at a 20 day moving average to factor out some daily noise and have found that this is a good short-term indicator for the direction of the market. You can see from December of last year, this indicator was moving higher signalling trouble ahead for stocks. In late February it turned back lower telling us that the worst had been seenin the short-term. It is still pointing lower which is good news for stocks.
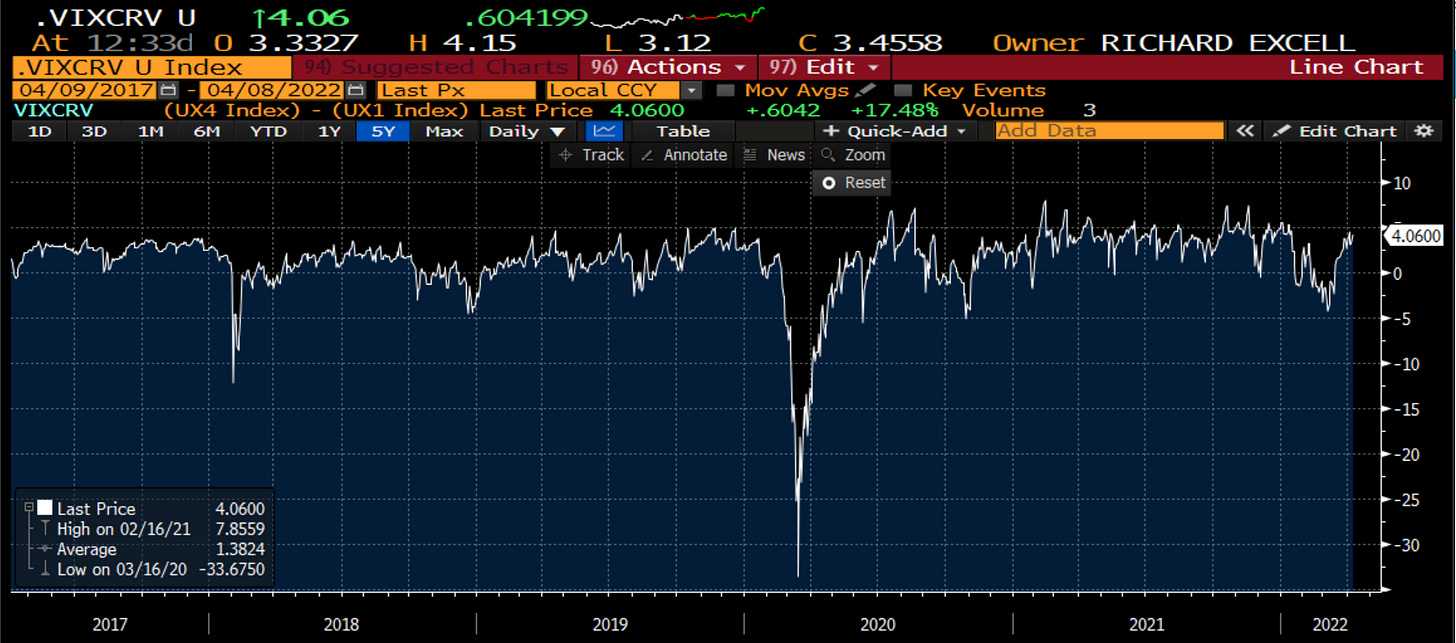
Another measure to consider is the VIX. I could look at the MOVE Index for Treasuries, the JPM FX Vol Index or even credit spreads. However, as the most liquid volatility contract in the world, the VIX is the place investors of all asset classes look to hedge. The futures curve here is normally upward sloping, again because no one wants to own option hedges unless they have to. When they get nervous, we see a big uptick in hedging in the shortest contract listed. This is when the VIX futures curve inverts i.e. the 1st contract moves above the 4th contract. As it happens, it is coincident confirmation of a market in trouble. When it gets extreme, it can be a contrarian bullish signal. In February it got to high (I wouldn’t say extreme) levels. We have sinced moved back to a very normal volatility futures market. There is no sign of concern when one looks at this market.
One last measure which tries to capture the same idea is the Cboe SKEW Index, measuring the volatility for OTM options relative to ATM options, with puts having a higher weight than calls. It is again concident and when it moves higher, hedgins is picking up. When it moves lower, it is usually when trouble is already happening. While hedging had picked up ahead of the Jackson Hole meeting last year, it all looks pretty normal to me.
Another bias we face, not just in the markets but in life itself is the Framing Bias which occurs when people make a decision based on the way the information is presented, as opposed to just on the facts themselves. A simple example would be if I presented you with some object and said ‘this is pretty cool isn’t it?’ You will now be biased to say you like it, even if you don’t understand why I do. A variation of this is that we have a tendency to view the world of risk depending on the market in which we primarily focus. When I was in the FX world, I seemed to always be bearish on risk, why? Because macro markets do the best and get more interesting when the world is falling apart. When I moved into equities, I noticed I got a lot more optimistic on risk. Why do fixed income investors all seem to hate stock and stock market investors? Because fixed income tends to do better when stocks suffer. In order to avoid this framing bias, I look at technical charts of all types of markets and try to see the world through their eyes. Not only that but within the US stock market itself, I look at different time frames of charts, because there are high-frequency traders, swing traders and long-term investors. How are each thinking of the world. i will go through these more quickly, with fewer comments, but trying to see the world through the eyes of different types of investors.
The standard daily chart of the SPX. Rolling back over, looking neutral but with a risk of lower prices.
This is the very short-term 10 minute chart. A series of lower highs and lower lows signals a lower market.
Stepping back and considering the weekly chart of long term investors and we can see the trend is still higher and positive.
You wouldn’t be so positive on risk if your benchmark and universe was the Russell 2000 small cap stocks. I think the students in the Investment Management Academy can relate to this.
You would be even less optimistic if you were a global investor and focused on the major markets outside the US like the Korean Kospi Index. The central bank headwinds the US is no facing, emerging markets investors have been facing for a year.
What about other assets? One of the most used commodities in our economy is copper. It is in the most cyclical parts of the economy. Right now it is holding up pretty well.
In fact commodities overall look healthy. This is the CRB Index which looks at 19 commodities across energy, agriculture, indutrial metals and precious metals.
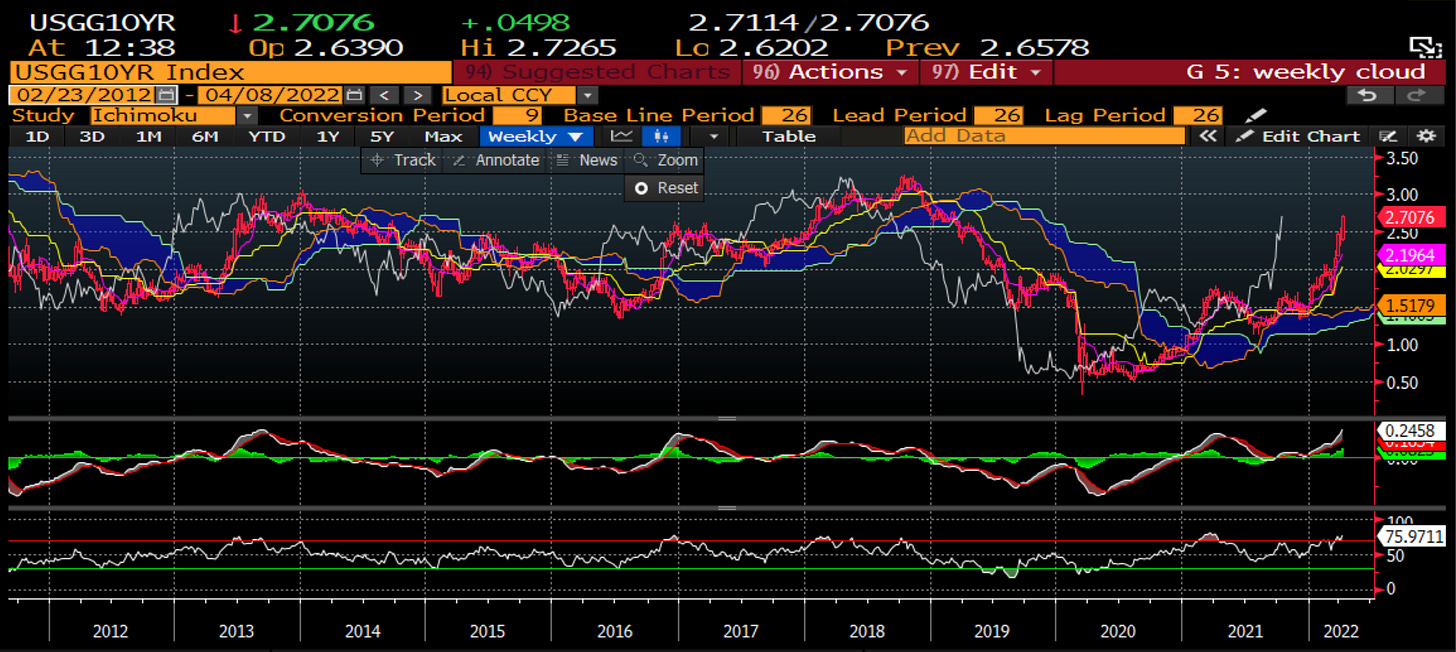
As I tell my students, if you have to have a view on one asset in the world, make it the 10 year US Treasury. It is the asset that, as of now, all other assets base their price. The cost of money, and the discount rate for all other assets, is heading higher. This is not a good sign for risk.
Finally, as I go through this analysis, I don’t want to drink my own Kool-Aid too much. Many investors, C-suite managers and decision makers can fall victim of Overconfidence. Overconfidence bias is a tendency to hold a false and misleading assessment of our skills, intellect, or talent. In short, it’s an egotistical belief that we’re better than we actually are. It can be a dangerous bias and is very prolific in behavioral finance and capital markets. In order to assess if this could be happening, I look at how the flow of money - the flow of decisions - is going in the market.
Money flowing into mutual funds and etfs is still seeing a positive trend in spite of the wobbles this year. Are people too confident about buying the dip?
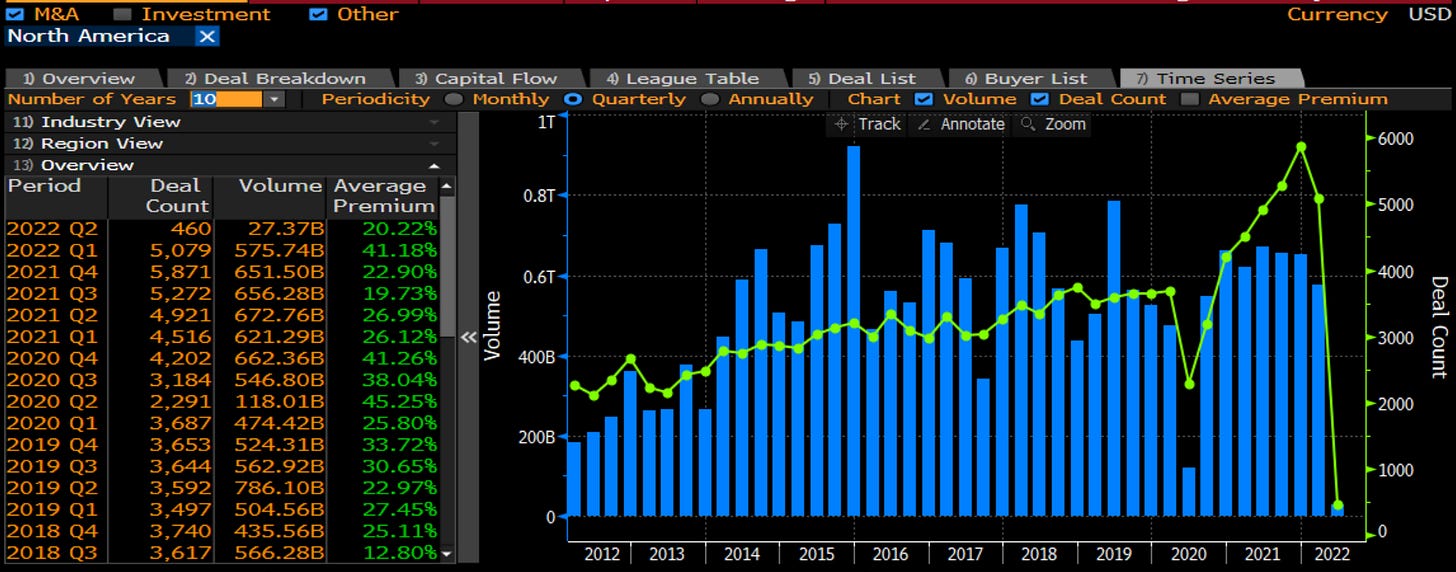
This chart is somewhat skewed because we are early in the quarter. So avoid the extreme drop-off. The last two years we have seen an explosion of confidence in C-suites with a strong economy, historically cheap capital, and a currency to spend that has never been higher. Like investors, there seems to be too much confidence.
The same is true in the IPO market. it has dialled back the risk a little in 2022 but 2020 and 2021 combined were record years for issuance of IPO (and SPAC not shown) as the private markets were looking for exit strategies. So it isn’t just public investors, but private investors also seem overly confident.
Finally, I look at CFTC data to see the position of non-commercial traders. Their flows can lead the market. Not looking good right now.
Pulling this all together, in what I admit is quite the long blog, I find the following:
Anchoring bias as seen in valuations - I get a negative signal for now. There are headwinds to risk.
Confirmation bias that I look to surveys and other indicators for I get a mixed signal and therefore I am more neutral. FSI points higher but small business point lower.
Loss aversion as seen in the options market is also neutral. Put-call rations, VIX curve and Skew Index are all in the meh category right now.
Framing bias that I avoid by looking at all time frames and markets I get more negative. The longer term trend in stocks is positive, but the shorter your view, the worse it looks. Small cap and international stocks look quite poor. The cost of money is heading sharply higher which undercuts all risk.
Finally, overconfidence as measure by money flows into funds, M&A, IPOs and the like is all pretty high right now which gives me pause.
Looking across all of these measures in a variety of markets and time frames and I come away negative on risk markets. The options market is giving you a good opportunity to hedge or add convexity to your portfolio and now might be a good time to take advantage of that.
Have a good weekend and … Stay Vigilant


Fits right in with the Turkey comparison. Thanks again for the venues and opinions you share with us. I have been investing since 1967 and I love learning something new everyday.