


The readers react
This week I wanted to try something new and answer questions from the readers. The first of hopefully many mailbag issues.


Thank you to everyone who sent in questions. There were some similar questions that I will try to generalize and answer. There were also some questions about the discussion that occured in the comments. Once again, thank you for taking the time. I will do my best to answer so here goes.
The first question is about supply chain issues. This has clearly been a topic of conversation, long before even the last year in which every company has blamed supply chain issues for problems. In fact, many supply chain issues go back to the 2019 period when the tariffs and trade war with China started. This was exacerbated by Covid, with lockdowns meaning goods couldn’t flow. It was stressed further by the Evergreeen/Suez Canal crisis of 2021. Now, as another Cold War seems to be starting, one can think that these supply chain issues are not going away any time soon. In fact, I covered the topic broadly in 2020 for the CFA Society Chicago podcast in which we explored whether we had seen Peak Globalization. You can get that 11 part podcast series here or just look for the CFA Society Chicago podcast on any podcast app and search for it.
The punchline at that time was that we had in fact seen Peak Globalization. That did not mean the entire world was going back to only their own internal, domestic markets. However, it meant for a variety of reasons, companies were looking to rationalize supply chains and build in redundancies, given there were new risks in the world. In addition, with ESG concerns at the forefront for most companies, making goods closer to where they are consumed (in North America for the US market or in Eastern Europe for the EU) was favorable to having all supply manufactured in Asia. Asia would still be robust manufacturing but for the Asian consumer market. However, this will take years (and billions) to create and so until then we still have the status quo.
What are some indicators I like to watch to assess the health of the supply chain and what that will mean for the markets?
Baltic Dry Freight Index which is comprised of 40% Capesize, 30% Panamax and 30% Surpramax. You can see below that the index is not the greatest when it comes to predicting recessions, even though you will see this trotted out on Twitter right now as a portent of impending doom. We did have big falls before 2008 and at the end of 2019. We also had one early this year. We can also see big falls in 2005 that predicted nothing. We can further see recessions without big falls. One thing we can see is that post 2000 when companies really began outsourcing to Asia, this index has gotten a lot more volatile that it has been before.

For the US in particular, we should also look to the Port of Long Beach, the busiest port in the US for consumer goods. This is a little bit better in signalling problems ahead. If we look over the last 20 years, whenever the number of containers (here is total in white and inbound only in blue) falls below the periods average number, a recession seems close. We are pretty close. Another issue to watch is that there is the potential for port stoppages as we go into Q4. Both the truckers in California as well as the stevedores that unload the vessels have lobor contracts coming up and negotiations are ongoing. There is the risk of strikes if a deal cannot be struck. This would certainly be negative news ahead of the holiday season.

Speaking of shipping, a lot of those goods in Long Beach make their way across the country via rail traffic. It takes some nuance to look at this data as there is quite a bit of seasonality. As you can see, traffic slows markedly in November and December, but then picks up in the new year. Be careful if someone shows you a rail traffic data point at this time without seasonally adjusting it. Overall, we can look at how 2022 is relative to the 10 year averages. This summer especially, things have been a little slower. It will be interesting to watch this unfold.

The goods that are not shipped by rail are shipped by trucks. We can see both the actual and forecasts on Bloomberg. As this trends lower (I have 1 and 2 year moving avergages on here) recessions have happened but it may take a while. The averages went lower all of 1998 & 99 before the 2001 recession, all of 2007 before 2008 GFC, were going lower all of 2019 before Covid and have been going lower of late. Not a positive sign at all.

The last one is the Cass Corporate Freight Index, which measures the movement of goods by any mode. Again, watch for when the averages head lower. They are holding up for now.

Collectively, the shipping and supply chain data so far look okay. Goods are still flowing. The costs to move those goods are still elevated relative to 2019 but have come off the peak. It still argues for a bit higher inflation but slowly slowing. It also suggests any recession would be in 2023 and not 2022.
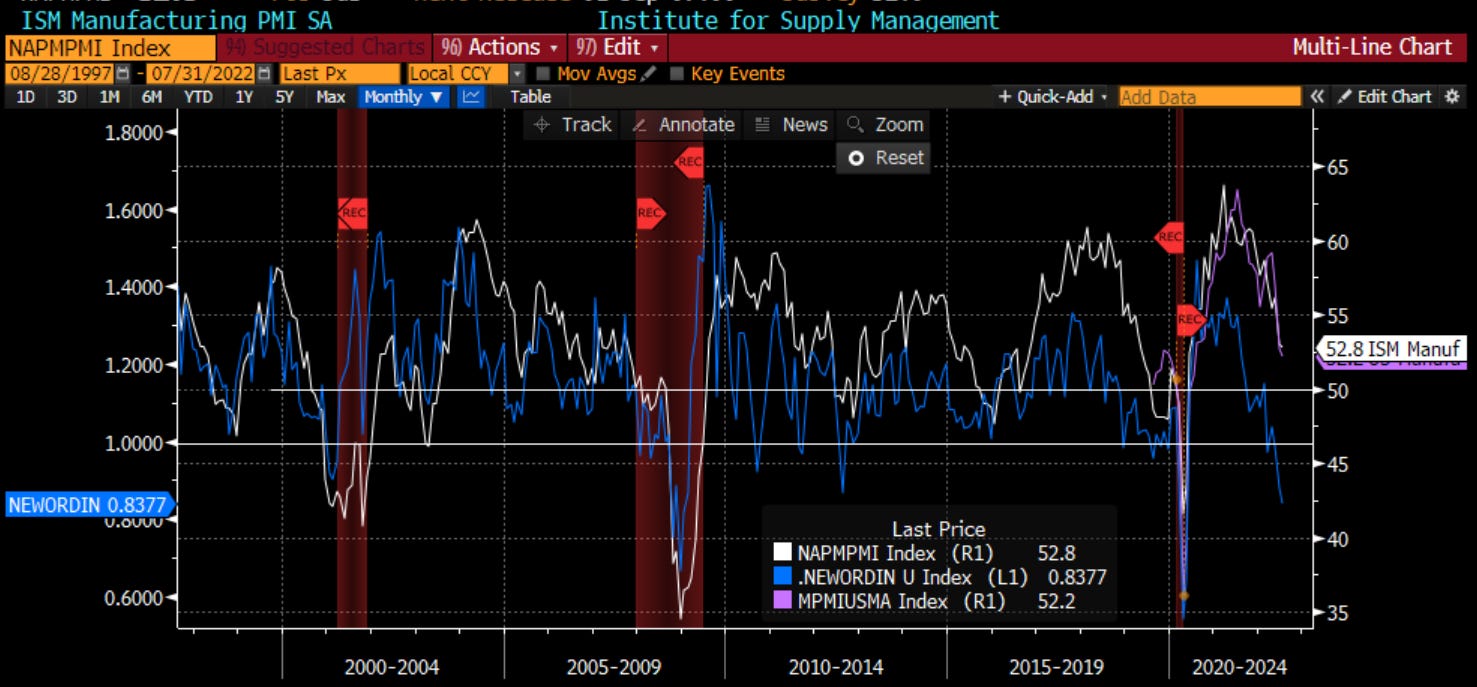
Speaking of recessions, last week we got the S&P (formerly Markit) PMI data and the Composite Index fell to 45. Not many use this data series because the history is not that long. The bears jumped all over it of course. However, it is actually the manufacturing measure that is a better indicator because of the multiplier of manufacturing vs. services. I also use the ISM data with a longer history. It comes out this week. The ratio of new orders to inventories has been telling us it will continue to fall. When this ratio goes below 1 (it is now) and the ISM goes below 50 (not yet) we have a recession and negative returns for stocks. Something to watch this week.
I received many questions that essentially amounted to ‘where is the market going now’, ‘will we go back to the lows’, ‘how will the S&P end the year’? In addition, I got a couple that asked how one should trade this type of market. In order to be successful in investment management, you must know when to be dogmatic and when to be pragmatic. The issue is when will we have trending markets, higher or lower, and when will the lack of clarity lead to choppier markets. Right now, the economy is slowing and the Fed will continue to slow it. This means we likely have a recession. However, as we have shown before, everyone knows this and is already bearish. Hedge funds are very short the market. Long only accounts are still underweight stocks. In fact, the flat skew in market tells me know one is rushing to hedge the downside because they expect it. If anything, there is more nervousness about a move higher. The fundamentals are pointing lower. We will get catalysts in September with economic data and companies speaking at conferences, in addition to the start of the election season. However, for now, you need to watch the changes in supply and demand. For this, I use technical analysis. Technical analysis is more than just drawing lines on a chart. That is one part of it. It is an analysis of breadth, volume, other markets, and patterns to gauge the sentiment of the market. I think of it as the behanioral finance analysis of markets. I heard it described well this week as: technical analysis looks at the fundamentals of a market, while fundamental analysis looks at the fundamentals of a given stock. I can get behind this definition.
One reason I felt strongly that we were having a bear market rally was because breadth and volume were not following price. Fewer names were taking us higher. 86% of global returns came from the US and in the US, four names (MSFT, AMZN, TSLA and AAPL) accounted for 30% of total gains. That is not a healthy market. So when we see that, we look for levels when the market will run out of steam.
Back in August 16, I put out a bonus chart of the day on Linked In that pointed out how the market was running into big time resistance on a number of indicators. Not a common event and one that told me to get short, particularly given the other signs (breadth, volume) pointed lower as did the economic news. This is that chart.

If I update it now, you can see we pulled back to, and through, the 38% retracement level. With the Moving Average Convergrence/Divergences in the middle pointing lower, as the Relative Strength Index also heading down, the market will move lower. How low? The 390 level in SPY (3900 in SPX) is where we get a number of areas of support in the near term. However, as I suggested last week, the low end of the range could ultimately be 3300. Personally, in this type of market, I like to use overwrites and underwrite on the names I like. I sell calls against my longs and if I have been taken out of longs, or if there are watch list names that are close to my entry level, I will sell puts on those names looking to get assigned. If nothing happens, I collect premium. I then try to spend this premium tactically on broader market index or cross asset puts to again insulate the portfolio and trade the range. The options market is the only insurance market in the world where one can both buy AND sell insurance. Take advantage of that.

You may recall in “Inflection Point” back in the middle of July, I talked about the similarity of this period to the post WWII period because the fiscal and monetary stimulus we got at that time is the only thing similar to the Covid response. I said then, that we could perhaps see a simialr pattern, that as the stimulus is removed, the market heads lower, but then trades in a long sideways pattern. Given we have so many bears, but also the bias of many to want to be long which came out when we got to the highs, we could very well just go sideways for a while. This is probably the thing that hurts the most people, bulls and bears alike. Markets like to move in ways that hurt the most people. This would suggest trading ranges for all of 2023 and 2024.

Speaking of fiscal and monetary stimulus, this week we got the story of the potential for the canceling of student loan debt. While I acknowledge the desire to help those in need, I frankly think this is not the right way. In fact it creates many disincentives. In fact, one could (and do) argue that the broad canceling of debts undermines the sancticity of contracts, contract law and property rights. However, leaving that aside, I wrote on Linked In this week:
“Yesterday we got the announcement, that everyone expected, the Biden Administration will canceling some amounts of student loan debt. Let's leave aside for the moment the terrible disincentives this creates for everyone & just focus on the numbers. This is going to be about $700bb of spending. Now, if we flash back a couple of weeks to the poorly named Inflation Reduction Act, that bill included roughly $500 bb in spending, about $750bb in offsets for a 'deficit reduction' of $250 or so. These are all rough numbers because the govt spending measures never, & I mean never, raise what they say. But let's take them at face value. The new spending on student loans then chews up basically all of the offsets in the IRA bill, which means we are basically getting $500 bb of new spending. At a time we are trying to control run-away inflation. Does anyone want to think through the scenarios of how this may end?
If we look at the chart today, we can look at the Covid period on the right. The blue line is the growth of money and the green line is the growth in fiscal spending. Both were at multi-decade highs. As a result, we got multi-decade high inflation. If we look back to the post GFC period, while money growth first moved higher, it quickly pulled back as fiscal spending took over. Then as the 'deficit hawks' pushed back on spending (there are basically none left in DC), money had to grow again. However, there were checks & balances here. You can see that thru time, that monetary & fiscal move in the opposite directions, checking each other.
That can certainly continue to happen now. The Fed may continue raising rates & selling down its balance sheet. At a time when the Treasury also needs to sell bonds. Then we need to ask, who is going to buy those bonds? We froze Russian central bank assets & seem to have upset the Chinese. EM central banks are struggling with their own economies. We do have the fincl repression that will force fincl institutions to buy but at what price?
Another scenario is that the Fed, will hiking rates, realizes it cant continue on with QT. It wont happen at Jackson Hole as I posited several weeks ago, but could happen early next year. However, that most likely happens when we have a mkt mess.
As I think through the scenarios, I am struggling to see a happy ending right now. Love to hear your ideas.”

We can rightly suggest that if this idea does go through, and there will be court challenges, the Fed will need to continue to be that check on the system and stay aggressive. This is not helpful for risky markets.
Is it helpful for gold? There was a question in the comments about gold. I think there is a logic for that but let me point out a few things. Below I have gold in white compared to the growth of M2 in purple, the growth of the deficit in blue and real yields in yellow. Near term, gold does follow real yields and as the Fed is trying to get these to move higher (less negative) that is a headwind for gold. However, stepping back, is it monetary of fiscal largesse that drives gold? I think we can see in periods when money growth is moving higher but the deficit is shrinking, gold struggles. When money growth moves lower, but fiscal spending moves higher, gold does well. When both move higher, gold does the best. So we do not know what will happen fiscally, and even with the IRA and student loan bill the metric has moved lower because of how much spending was done the previous year, but we do know that money growth is moving lower and real yields higher. Thus, for me to really get excited about gold, I would want to see fiscal spending move higher. I am not rooting for that, but if I were long gold, that is what I would want to see.

Last point. My framework for top-down investing looks at the economic cycle in 4 distinct phases: growth moving higher and inflation still falling (recovery), both growth and inflation moving higher (strong economy), growth stalling while inflation stays high (stagflation or peak) and both growth and inflation falling (recession). There are empirical rationales for what asset class, country, sector and style to own in each of these phases. Right now, the market is at an inflection. We are still in stagflation but there is a sense we are going into a recession mode. In stagflation, you want to be long commodities and short equities. In fixed income you want to be short duration. However, if/when we tip into recession, you want to be short both commodities and equities and be long bonds not bills. This is the battle we see in the markets right now. We have seen those long bonds and short copper and oil looking for a recession get stopped out on a good non-farm payroll number.
This is also obfuscated by current positioning. With CTAs short the cyclical commodities, Hedge Funds short equities, and a preference for bonds, even if we get more recessionary data, will it move the needle on the markets? I talked about that this week on my Linked In:
“Chart of the Day - movement. I had several discussions yesterday about what could happen in the mkt after the 1st day of Jackson Hole. The conversation started to end up sounding like the battle of wits scene in the "Princess Bride". People got short because they knew the Fed would be hawkish but then fast money got long because it knew investors were short, but smart money got short because it knew fast money was long because they knew people were short ... You can see how far one can extend this. The answer was ... inconceivable.
The reality is, we don't know who or what investors were active yesterday (in reality, probably far fewer than you think). What we do know is how investors changed their portfolios over the last month, & how much of an effect on the mkts that movement did have.
You see, the gold standard is the BAML Global Fund Mgr Survey. The top chart shows us how investors changed portfolios in the last month. You can see a large rotation back into equities & tech & out of defensives. You can see a move into the US and out of UK. You can see moves out of commodities. Investors are still U/W stocks, but that underweight was cut from 40%+ to 20%+ so a pretty big move.
In the bottom chart, we can look at the relative rotation or relative movement of a variety of macro ETFs relative to each other & to the SPX which I use as the risky asset benchmark here. The upper left is the quadrant that usually sees the biggest price moves because it is the one going from lagging to improving, from left for dead to better. The biggest names here are the GS most short basket & the NDX 100. Seem familiar? In the lower right we see the biggest pain point because it is the area that went from leading to starting to weaken, again catching people by surprise. What do we see here? Commodities, risk parity, credit mkts. The new least favorite place to be, that is in the 'lagging' lower left quadrant is Europe/UK and EM. Probably not a surprise and we have discussed this the past 2 wks. The upper right, the leaders in the clubhouse so to speak? Various US equity benchmarks.
This doesn't mean this will continue. As we saw over the last month, things change, money moves, some of those money moves have a bigger impact than others especially when investors are caught off guard. The big question we must ask ourselves now, as we think of the next month, is will this rotation continue or was this a one-off position-squaring in an illiquid summer month?
We will hear more from central bankers, we will get more economic data, we will hear companies at conferences. Will these catalysts continue to drive a reduction in U/W equities & O/W commodities? Will it continue to move money into the US & out of the rest of the world? Or was that a flash in the pan? This is what we must ask ourselves. Otherwise we fall victim to one of the classic blunders, second only to 'Don't start a land war in Asia'.”

I look at the YTD sector performance, and the price action suggests the market is pricing in a recession led by inflation, the classic transition from stagflation to deflation:

It makes sense if you follow these signs. However, given the moving parts in the market, now is a better time to be pragmatic and not dogmatic. It is a time to be in cash and trade the range. It is a time to look at options on both the long and short side. Most importantly, it is a time to …
Stay Vigilant
Rinse and repeat ,pretty soon. Put off the bubble to 2024 and beyond. I guess the pig for the feast is not plump enough for slaughter.
JH Thoughts---going in markets greatest fear is that the Fed has tended to pivot when faced with lower growth or adverse market moves. This fear is the result of analysing past Fed reaction functions. Powell, just had to comeout strong against that and he did. However, there is a non-sequitur. Powell laid out a road map and various Fed speakers also laid out thier road map for Fed policy as well. This seems somewhat strange given that it was about a month ago that the Fed announced a shift away from forward guidance to a return to "data dependence." So arguably, what really matters more than this 10-min Hawknado, is the next payroll report if in fact the Fed has shifted back to data dependence. On the stock markets, it feels as if we are entering a zone of frustration, a violent chop with a backdrop of horrific liquidity, capable or frustrating everyone and just stopping out in short term momentum traders...Btw Rich on that other thing, I got the green light for that...