The story may be changin'
The bulls are focused on the declining inflation and a Fed on pause; the bears are focused on growth that may be falling even faster than expected
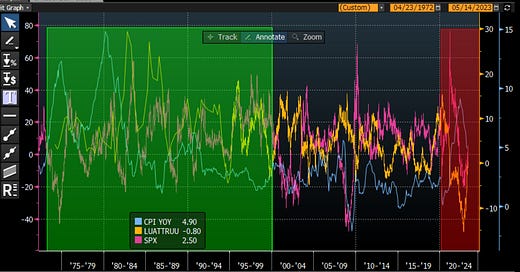
You may recall the chart above. I have used it before in this Substack. I first started writing about high inflation being a problem for portfolios back in 2021. It wasn’t just the deleterious effects of high prices, it was the correlation issue. In a world where growth is the concern, and inflation is not, stocks and bonds are positively correlated. Thus, a portfolio that holds each - whether a 60-40 retail portfolio or a risk parity institutional portfolio - is balanced to the risks. As growth falls, stocks suffer, but the Fed is expected to cut so bonds rally. As growth picks up, stocks rally but then bonds suffer as the Fed hikes interest rates.
The problem when inflation is the issue is that stocks and bonds become positively correlated. High inflation hurts margins and therefore earnings, especially for companies with high percentage of human capital. As 75% of the US is services now, that is many companies. The Fed is hiking aggressively so bonds suffer too. Thus your portfolio of stocks and bonds hurts both ways. Enter the year 2022.
In 2023, the narrative is changing. You have many who are more bullish talking about inflation falling. There are those with a longer-term focus who will talk about the disinflationary impacts of debt, demographics and disruption. The US has too much debt which will slow growth. An aging population will spend less and slow growth. Ultimately, technology is very disruptive and deflationary as people are put out of work and the cost of compute power comes down with Moore’s Law. AI is the poster child for this.
There are also those that are showing the falling inflation expected to get back to 2% this year now. For instance, I got the next two charts from Raoul Pal and GMI and I think they are consistent with the bullish story. CPI was a little lower than expected at 4.9% vs. 5% expected. PPI also fell and if you look at it, PPI leads CPI by 1 month and is pointing to lower levels.
GMI also had this chart which shows the New York Fed global supply chain pressures and the Citi inflation surprise index. The numbers are all falling.
However, the University of Michigan inflation expectations number also came out and it is persistently high at 4.5% expectations for the next year. We also see the bond market 5 year-5 year forward inflation expectations at 2.55% so even the longer-term numbers are above the Fed target. Perhaps this is why the 10-year yield is not falling further.
This is also why employees are asking for higher and higher wages. Every week now we are seeing more unions winning bigger concessions for pay raises. While the cost numbers have peaked somewhat, they aren’t falling that quickly whether it is the Employment Cost Index, Average Hourly Earnings or the Atlanta Fed Wage Growth Index. This is why I think the Fed will stay higher for longer even though goods prices are falling.
I also think there is something else to consider here. Even if inflation, especially in goods, is falling, we must ask if this just means that we now need to focus on the growth issue. Will growth re-accelerate and inflation fall? Possible. Will the Fed cut rates if this is the case? Unlikely. I wrote about this potential growth issue on LinkedIn on Friday:
“Chart of the Day - commencement
It is one of my favorite times of the year. It is graduation time where we get to celebrate the success of the students who have worked to hard to get to this day, whether completing undergrad or grad degrees
This day is rightly called commencement because this is a beginning and not an end, even though I know for the students it will be quite the relief to have school behind them. I can speak for most when I say don't be in such a hurry to get into the real world, we miss school
In the markets I think we are celebrating the ending of the last 2+ years, call it mkts grad school, of the fight against inflation. Inflation expectations have come down and the US bond mkt is pricing in rate cuts to begin as soon as July
Yes, there are other central banks, namely the ECB & BOJ, that are continuing the fight against inflation. But let's be honest, not everyone graduates on time
But as much as this is a celebration of a job finished, it is also a beginning. It is the beginning in my mind of the concerns over growth. The last 2+ years, growth has not been a concern, only prices. That is changing
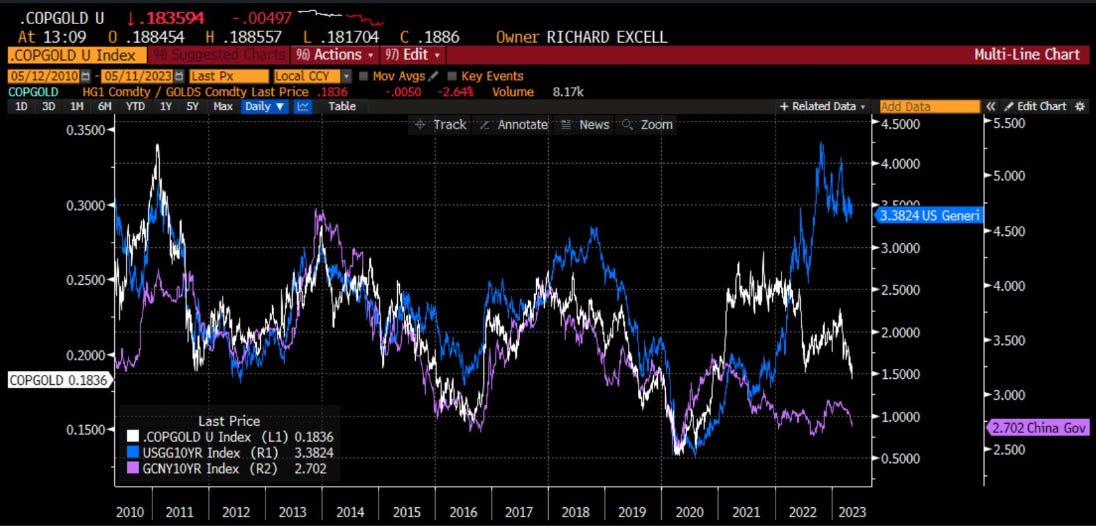
The best mkt metric to see this I believe is the ratio of copper to gold. This is an old commodity mkt tell but it has also been popularized by bond gurus such as Bill Gross & Jeffrey Gundlach
Given its uses in plumbing & electricity, copper is very economically sensitive. Some used to joke it had a PhD in economics. Gold is just a store of value. The ratio then tells one what the mkt thinks of the economy
We used to care about the global economy. That was true from 2000-2019. The global economy was largely synchronized. With trade wars, Covid, supply disruptions and the like, the global economy is become less synchronized
We see this in the chart today where I compare the copper to gold ratio to US 10yr yields & Chinese 10yr yields. There was a tight fit between all 3 up until Covid. This is why bond gurus liked the measure
Since then it is less clear. The US meaningfully outperformed. This year, Chinese re-opening was thought to carry the torch. However, that is apparently not happening. We see this as the copper/gold ratio is falling quite precipitously
I have waxed poetic on the US economy. If we look at China PMI, Li Keqiang Index, Hot-rolled steel etc, China is not recovering as most hoped. Growth may be becoming an issue
I want to end on a positive note. Again, this is one of the happiest days of the year. Yields look to be headed lower in the long run. A lower cost of money will create more opportunities, the same way graduates have many opportunities
Congratulations to students & parents. Remember to ..
Stay Vigilant”
If growth becomes a concern, then the returns that we have seen on stocks are too much. If we look at year over year stock returns vs. ISM and CPI, we can see that stocks can go higher but only if growth is going higher. If growth is falling, stocks will fall. In fact, CPI only has big down moves when growth falls. If you look back through time, there are few periods where CPI falls precipitously while growth re-accelerates. Right now the bulls want it both ways - growth picking up and inflation falling. I just don’t see a lot of precedent for that.
I still could get behind the stock move if the worst news was priced into the market. However, that is just not the case. In fact, some pretty good news is priced into the market if we simply look at the multiples on both the SPX and NDX. I wrote about this on LinkedIn as well as sent a Note this week as well:
“Chart of the Day - margin of safety
Fresh off the Berkshire annual mtg, I thought it was worth thinking about the idea of margin of safety. Invented by Graham & Dodd but popularized by Buffet & Munger, the concept is simple - it is the more room you have to be wrong in your forecast
After all, we are all wrong in our forecast. Investing is about forecasting the future & forecasting is difficult. We will all make fun of the weather forecasts being wrong, but how often do we step back an analyze the accuracy, including timing, of our own
As I tell my students, if you are right 50-60% of the time, you can be a rockstar in investing. The best are not right more often, they are better risk managers, protecting how much they can lose & making multiples more when they are right
The key is finding strongly positive reward to risk ratios for each idea, & building a portfolio of these asymmetric ideas, managing risk for those that don't work while profiting from those that do
One way we can measure that margin of safety in the overall stock market is to compare the earnings yield of the overall mkt to the Fed Funds rate. This is after all the highest return on cash, as banks are finding out with deposits fleeing to lock in this yield
This topic came up on my recent Macro Matters podcast which I will post later today. There are other ways we can look at this: versus 10 yr yields or corporate bond yields, compare stock dividend to 10yr etc
However this one is pretty simple and pretty straight forward. What incentive do I as an investor have to move out of my money market account and buy stocks? Do I have a margin of safety in case I am wrong on my forecast?
Today's chart shows this equity risk premia for the SPX in white & NDX in blue for the last 30 yrs. I would show longer for NDX but it doesn't go back before 2001
We can see the avg level of this risk premia is around 3%. I have drawn lines at 1% (getting close to expensive) & 5% (getting very cheap). We can see that by this measure, stocks were very expensive leading up to 2000 & 2007
Conversely we can see that stocks got cheap in 2002-03 & very cheap in 2009-2016. This was the period when the FOMC was incentivizing investors to take risk by making the oppty cost essentially zero
The avg of 3% equates to about 3% cash & 3% premium for 6% earnings yld which is roughly a 16x P/E. That is about where the avg has been but we don't spend a lot of time at avg
If we look at the current reading? In the SPX we have 0% equity premia i.e. the SPX earnings yield is the same as Fed Funds. For NDX it is negative meaning the earnings yield on tech is below Fed Funds
This is not asymptotic. These type of levels can persist for some time. However, when we look back thru mkt history, no one will tell you that 98-00 or 06-07 were great times to buy stocks. Those periods are marked with more regret than success
This is a time to ...
Stay Vigilant”
Perhaps that is because earnings are depressed you might argue. Yes, earnings did fall this quarter even though in general these numbers were better than expected. Across many sectors earnings are falling:
But if we look at the forward expected earnings per share, and compare to where that forecast is versus the peak forecast, we can see that the expectation is for hardly much decline at all - less than 5% for SPX and less than 10% for NDX. It had gone down a little more but ratcheted up after last quarter and has flat-lined. This is not a market where there are depressed forecasts going forward.
The thing is, when growth slows down, earnings come lower. If it is a small fall in growth as measured by ISM, perhaps earnings flat-line. However, the fall in growth we have seen in the past year would be more consistent with a fall in earnings at the higher end of the 15-20% falls we have seen this century. Peak to trough in this cycle, so far, it was 5%. Is that really all we will see?
The Fed pause has been good for multiples. We have seen the forward P/E of the SPX move from 16 to 19 as the terminal Fed Funds was expected to be around 5%. We will have a slew of Fed speakers this week ( I think there are more than 10). The question we should ask is whether these speakers are going to be saying ‘Mission Accomplished’ on inflation, or will they be giving us more of a hawkish tone of higher for longer? What does higher for longer mean for multiples which are already elevated?
I do think the Fed will pause but I also do not see the Fed cutting. With core, ex-housing services inflation still high, the Fed will remain on guard against a re-acceleration of inflation. It knows of the fiscal stimulus that is out there. I do think there is a pause because the Fed also feels banks are going to start tightening credit, which is going to be akin to more rate hikes. I wrote about this a couple months ago. I put out a note on that this week as well after we got the Fed Senior Loan Officer Opinion Survey:
“Chart of the Day - hard landing
Yesterday we got the qtrly update for the Fed's Senior Loan Officer Opinion Survey. The instant mkt reaction was a rapid drop followed by an equally rapid recovery. The narrative was that it was a non-event & 'only marginally worse'
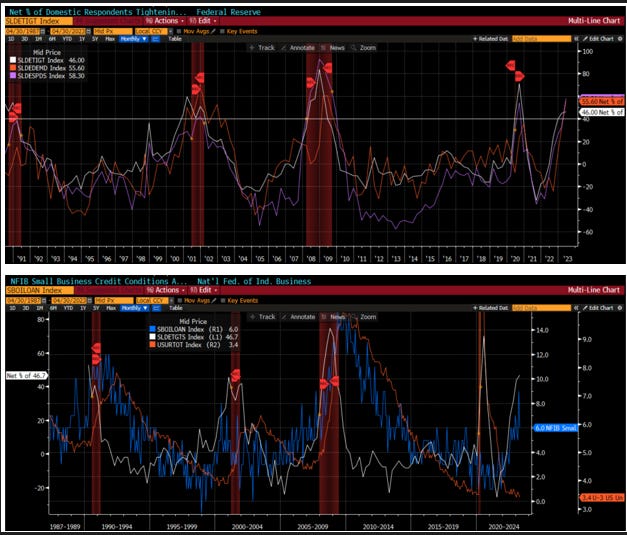
However, looking through the numbers, there may be some reasons to be cautious. First of all, this survey & its various components have a 100% hit rate on forecasting a recession. Perhaps it won't happen this time around, but it is tough to bet against
The logic is quite easy-banks provide the credit that is the blood flowing through the veins of the economy. When banks shut down that flow of blood, the body will soon suffer. FinTech has not shown in can or will fill this gap
Consider the top chart today. It shows 3 different measures of credit. The white line is the % of banks tightening loan standards for large & mid size companies. Fewer deposits (or loss of deposits in most cases) means banks don't have the funds to loan out
The purple line is the spread banks are charging over the cost of credit. As the yld curve has inverted, banks margins have been crushed. Banks need to compensate by widening spreads meaning companies face higher Fed rates + wider spreads
Not surprising then is the orange line (inverted) which is the demand for loans. This line is plummeting (rising here) as the cost of the money is squelching demand for loans
I have drawn a horizontal line back for the last 35 years. Whenever we have crossed above this threshold in each of these measures, we have had a recession. Not a soft landing, but a hard landing. Sure that is only 4 data points. I will let you wager it is different this time
The bottom chart narrows in on small businesses. Small biz are 99% of the companies in the US, 65% of the job growth in the US, 50% of all jobs & 44% of all economic activity. Suffice to say small biz matters
The white line is the % of banks tightening standards to small biz. It has also moved higher. Maybe large companies - like Apple - can come to mkt with bonds & skip banks. However, small biz NEED regional banks to supply the funds & that is getting harder
The blue line is the NFIB credit availability index (inverted). It corroborates the SLOOS data. Banks are telling you it will be harder to get a loan and small biz are agreeing that it is harder to get a loan. This impacts 44% of all economic activity remember
The orange line is the unemployment rate that just came out - better than expected. You see, jobs data are lagging. Always have been. If anything it might lag even more this cycle given how difficult it has been to hire
But ultimately, if biz can't get loans, activity slows down, and ultimately people are let go. There is no debate on this. In fact, this is the transmission of policy that Jay Powell has been telling us he is counting on to slow inflation. It has been his goal. Even Jay said to ...
Stay Vigilant”
The narratives may be changing and right now the bulls are in control. However, be careful for the negative growth narrative to take hold. This is not priced into the market right now and it is not top of mind with many investors. However, it just may be the story of the summer.
Stay Vigilant


With declining inflation we wil see how much of the growth was due to rising inflation itself.
In the first paragraph, I think you meant to say they should be negatively correlated:
"In a world where growth is the concern, and inflation is not, stocks and bonds are **positively** (negatively?) correlated."