


Tings to considah


Over the break, I had the good fortune of traveling to Hawaii with my family. It was my first trip to the Big Island and while there, we got to see Kilauea erupting (the picture above is one I took). We went to the volcano as part of a 12+ hour tour of the Big Island, which was led by an amazing tour guide named Drew. He was a transplant from Oklahoma but had lived there long enough that he spoke Hawaiian pidgin. He had many phrases he would use when he would tell a story that may have some island lore in the description of the many things we saw. As he finished, he would always say “tings to considah”. We found this very entertaining. This came up the other day when my daughter asked what Drew might say about my post that included UFOs. I think I know what he would say. For the record, more people voted for that as the most likely thing to happen, more so than the DeepSeek disruption or no landing for the US economy.
Speaking of the US economy, there was very good news on the ISM front this week in the data. The headline index surged above the 50 level and even more importantly, the ratio of new orders to inventories, which leads the headline index, moved even higher suggesting more strength to come.

This has historically been a good signal for the market as stocks have a positive return on average when ISM is above 50. The best time to own stocks is when ISM is below 50 and rising. However, the only bad time is when it is below 50 and falling. The idea that it has been below 50 for what is I believe a record 26 months, and bouncing back and forth between rising and falling, has given business-cycle focused PMs a nightmare in trying to position their portfolios. This is a chart from CS (a moment of silence please) on what ISM levels and SPX returns are:

The idea that the US market overall has done well in this regime likely comes down to government spending. Barry Knapp highlighted this in the podcast I did with him last fall but it is worth highlighting this again as his chart was shared by Mr. Risk this week (another guest from last Fall) indicating the magnitude of excess government spending. With DOGE en fuego highlighting waste, fraud and abuse, and new Treasury Secretary Bessent speaking this past week as well on his 3-3-3 plan, appeasing the bond market, the trend in government spending looks to reverse. Good news for bonds, but maybe a headwind for stocks in spite of the ISM data.

Mr. Risk also had a great chart from his colleague Lee Ferridge highlighting the outperformance of US growth vis a vis the rest of the world:

Sure, globalization is slowly unwinding, and economies are decoupling but something else looks to be afoot here and one wonders if it is this excess fiscal spend. If that unwinds, does that mean this US growth miracle unwinds?
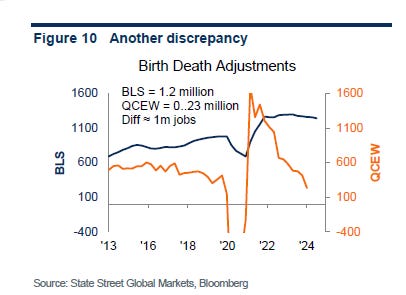
Another ting to considah is the US labor market, which has been so strong. Or has it? E.J. Antoni from Heritage Foundation pointed out on X the consistent negative revisions to the BLS data. Is the market really as good as the government data has said it is?

Back to Mr. Risk, who highlights the massive difference in BLS vs. the QCEW (Quarterly Census of Economy and Wages). The difference comes down to the birth/death adjustment in BLS models, their guess for whether companies are starting or closing. The BLS has misrepresented jobs by over 1mm. Nefarious? Incompetent? Fooled by Covid? Tings to considah
Last week I discussed whether the small caps might finally take on the large caps names. The SPX hasn’t just outperformed small cap US stocks, it has outperformed the rest of the world. This was something I took a look at on LinkedIn this week:

Chart of the Day - European outperformance
Writing a monthly piece for Eurex this month, it was noticeable that European markets got off to a very impressive start in January. Far better than their US peers
The Stoxx600 was up over 6% in the month, the third best January performance in the last 15 years. This was more than 3% better than the US, which itself had a strong month
The chart today shows the relative performance of the SXXP vs SPX for the last 10 years. Let's just say it has been a tough decade on a relative performance basis
US and Global investors who have diversified their portfolio or allocated to Europe over US have suffered badly. Could that be changing?
Since the lows in December, European shares have outperformed their US peers by over 7%. As you can see, this is but a blip on the radar. In fact, stepping back and looking at it, you can hardly tell
However, 7% is nothing to scoff at. This has also come at a time when the relative news flow on the economy and earnings has not clearly favored Europe. The US economy looks stronger, US companies have better earnings growth, and the US central bank is ahead of the ECB on rate cuts
Yet, in spite of the news flow not favoring Europe, price action is. Going back to "Reminiscences of a Stock Operator", when stocks don't go down on bad news, it is time to take notice. That is also true in relative performance and relative news flow
Mean reversion has not been a particularly good strategy. Momentum is king right now. Momentum has favored the US
The threat of tariffs don't help. Weakness in China, a major European trading partner, doesn't help. Yet, in spite of this, Europe had a great month in January
Time to take a look? What do you think?
Of course, it has been tech that is leading the charge in the SPX. So, I also took a look at tech and compared it to other sectors. The relative performance of tech vs. financials really stood out to me. I wrote about that on LinkedIn too:

Chart of the Day - what are sectors telling us
Probably surprising many people, the Financials sector has outperformed the Tech sector by over 10% in the last 12 months. In fact, Financials have outperformed over 1, 3, 6 and 12 months. It been a pretty sound beating
Sure, if you owned NVDA, you did fine. However, for the average Tech stock vs. the average Fincl? You were better off in Financials
Why? A big part as you can see is the historic relationship between this performance and the 10 year yields. This seems to have broken down in 2021 as everyone was chasing tech. Quietly, though, it is starting to re-connect
If this were to re-connect, there is a LOT of upside for Financials relative to Tech. That doesn't mean both go higher. Both could go lower. It is simply making a relative performance observation
Why would Financials do well? For one, the yield curve has re-steepened past zero. The yield curve is highly correlated with net interest margins for financials. Thus profitability should improve
In addition, deal flow is definitely picking up and we see investment banks, after record bonuses last year, looking to hire. This is good for all (but especially the students!)
Why would tech do poorly? Potential for overspend of capex chasing AI. Perhaps DeepSeek suggests it is not necessary, while the dollars have been allocated
Will rates stay higher? There is reason to think so. For one, the Treasury has $7 trillion to issue. For another, the tariffs are not only going to make it harder to sell to trading partners, it is going to give them less dollars to recirculate
For another reason, on the first order, tariffs could be inflationary. While the market was excited about CPI, at 2.9% yoy, it is still well above the 2% Fed target
There are just a lot of moving parts right now. However, quietly, behind the scenes, sector performance is giving you an indication of what investors are thinking
Should we take notice?
Would this mean reversion - small vs. large, US vs. ROW - happen in a world when growth is strong, or growth is weak? The US rates, which the financial sector is leaning on to outperform, may come lower. Bessent may convince bond investors things will get better. This is what Barry Knapp (again, a really good follow) was writing this week:
“A funny thing happened on the bear steepening (higher rates led by longer maturities) grind to a retest of the October ‘23 5% peak in 10-year Treasury, the Treasury Secretary’s office transitioned from a labor economist who never saw a rate cut she didn’t like, to the first macro hedge fund manager ever to be Treasury Secretary. Assigning all of the attribution for this week’s pre-payrolls short squeeze of Treasury short duration that turned the bear steepener into a bull flattener (lower rates, also led by longer maturities) to Secretary Bessent and President Trump’s pivot to 10s from the Fed’s policy rate, simplifies the narrative, is incomplete, but is significant. The UST rally began with a sharp drop in December job openings ahead of a January employment report that has had big upside surprises the last three years largely due to the pandemic corrupting season adjustment factors (see our Payroll Preview: Another Big January? for details). The rally intensified when Bessent’s first Quarterly Refunding Announcement (QRA) provided guidance that note and bond issuance increases market participants were expecting were on hold, likely until the ‘big, beautiful reconciliation bill’ was completed. The rally may have been fueled by the realization that the DOGE effort might actually build momentum towards returning spending to 20.5% of GDP. Consequently, by the time Secretary Bessent and President Trump made it clear they were less interested in the Fed’s policy rate, and are targeting the 10-year, the short duration, Trump Administration policy skeptics were on the defensive. The rally stalled following the BLS employment Situation report on Friday, but as we explain, the report was a mess and didn’t change our view that the supply of labor is abundant.”
The ten-year yield coming lower, not my base case I will say, led perhaps by sluggish growth, clearly not the market’s base case with only 4% of investors saying there could be a recession this year, would surprise a few people. The commodity market is saying just that as I wrote on LinkedIn:

Chart of the Day - big picture
Lots of moving parts in the past two weeks with DeepSeek, US tech earnings, tariffs, then no tariffs, retaliation etc
As everyone is trying to sort through what will happen and what the impact will be, I think the best answer I heard was from Paul Donovan of UBS on the Bloomberg Odd Lots podcast
He said "we have 4000 years of data on tariffs going back to clay tablets and Babylonia. Consumers pay the tariffs. Period"
There are first order and second order effects including immediately higher prices and potentially lower trade volumes. We also need to consider that many of the thoughts on tariffs came from studies on periods when supply chains were very very different
For me, I want to look at how certain parts of the market are responding. TO me, the best 'tell' for the market, will be the copper to gold ratio. Copper is growth. Gold is a safe haven. What do commodity investors think? They are at the front of the line on this
Today we can see that copper gold continues to trend lower. It has been for over a year. This has a lot to do with weakness in China and Europe. However, it also has to do with the easy fincl policy of central bankers which is not stimulating the growth it should be
Thus, my interpretation of copper to gold is giving some stagflationary feelings. I may be wrong
Bill Gross and Jeff Gundlach like to use the copper to gold and compare to 10 year yields. This overlay would suggest much lower 10yr yields. This is in stark contrast to my expectations thus I need to take notice
This relationship has broken down the last couple years, a period of massive fiscal stimulus in the US. Or maybe it is AI that is causing this breakdown
What are your thoughts?
A US growth scare, led by tightening fiscal policy because of DOGE and Bessent, while the Fed is on pause, would surprise a few people, not the least of whom is Trump. He would get his lower rates, but probably not for the reason he wants. However, given UK and Europe are easing still, may give reason for why US large cap tech continues to lag. The mean reversion comes from lower markets, not because markets rally. Maybe this is what institutions are thinking as they are rotating out of tech:

This is not what retail is thinking as Fidelity highlight the massive buy the dip retail flow post DeepSeek:
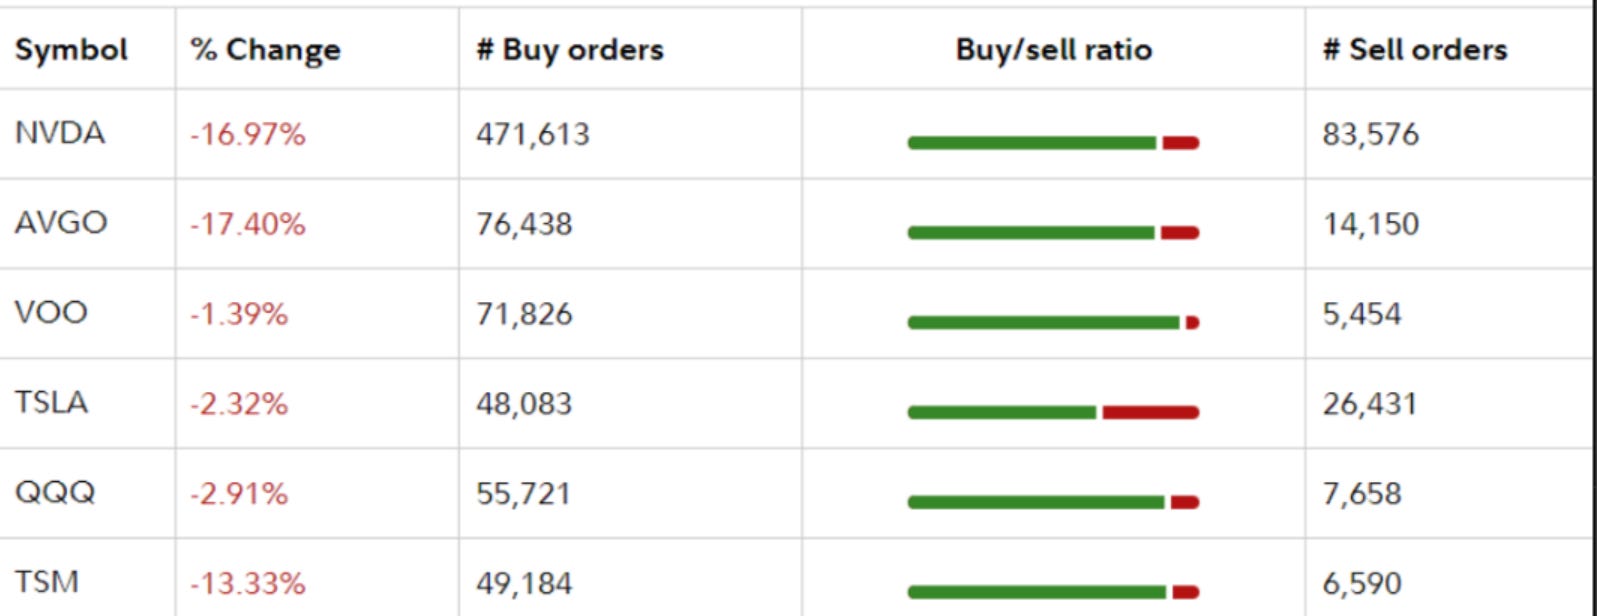
In addition, Goldman Sachs prime brokers say three of the five busiest days of retail inflow in the past 6 years have come in 2025. Retail accounts are all in and buying US tech aggressively, just as institutions are selling, and perhaps that is why you see this overlay charts comparing NDX now to 2000 or NVDA now to CSCO:

Again, it is not my base case that we will have a US growth scare. However, can DOGE continue to find abuse, fraud and waste and rapidly cut fiscal spending from the current 24.4% to the historic 19-20% of GDP? Can the strengthening economy handle it? Will Bessent’s 3-3-3 plan get annual budget deficits to 3% to appease his friends in the bond market? What will be the impact on US growth? Is it time to rotate out of large cap US and US tech into other markets like Europe, other capitalizations like small caps, or at least other sectors like Financials?
Tings to considah
Stay Vigilant

So many interesting tings to considah...very informative read. Thanks, Richard!
Have any thoughts on China? Economy/valuations?