


Too soon?
Is the market going to its seasonal low in March


March Madness. March comes in like a lion and goes out like a lamb. The Ides of March. Many different phrases to discuss events in March. All tend to describe the considerable uncertainty and risk that comes with events in March. When we are in the midst of that uncertainty, we always want to know when the end may be near.
It may just be me, but I seem to read and hear more commentary that is asking or looking for where the low may be, when it is time to step in and buy this dip, and less discussion about whether this is the start of a more meaningful move lower in risk. In order to stay objective and avoid confirmation bias or cognitive dissonance, I revert to my three-step approach to analyzing the market to understand if now is the time to put some cash to work.
Fundamental
The first and most important step to the analysis is trying to make heads or tails of the economy. The economy drives earnings and earnings drive stocks. The economy drives the willingness to lend money and the ability to pay that money back.
Coming into the year, based on survey such as the BAML Global Fund Manager survey, over 95% of investors saw either a soft landing or no landing for the economy. Only about 4% of investors saw a recession as a possibility. This was driving allocation into the most growth and most cyclical parts of the market. However, that sentiment may be changing. To be honest, I am not surprised. My portfolio management class forecasts the economy the next 6-9 months. The groups in the class just finished the work and are forecasting a slowdown in growth but persistent inflation. Thus, stagflation. The groups last semester forecast the same thing. In fact, the semester before too. Are they perfect? Of course not. Do they look at the same market variables everyone else in the market uses? Do they put them together using a variety of models from diffusion index to various regressions to machine learning? Yes, they do. Thus, I think they are usually pretty good. Now, the market is starting to come around to how my class has seen the economy unfolding for the past year or so.
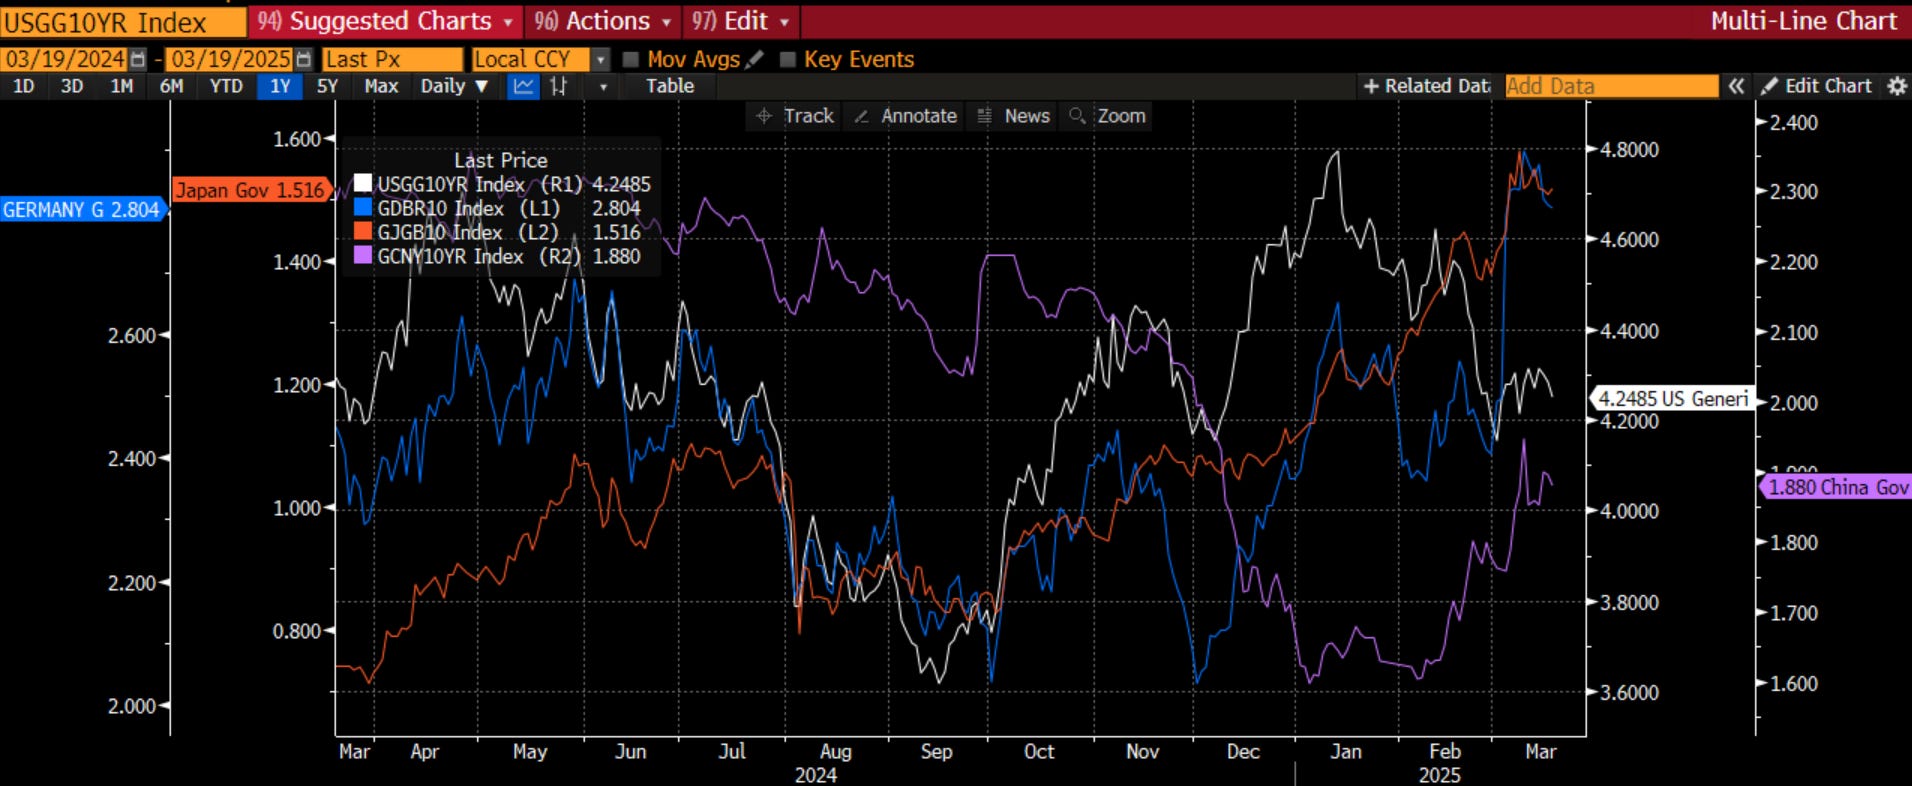
I wrote two weeks ago that the most important chart was that over the various bond yields across the world. At that time, we were starting to see the excitement over the desire to spend more in Germany and China and spend less in the US. We were feeling better about disinflation in the US, and inflation finally happening in Japan. How are we looking now? Those trends have continued. Bond investors are willing to fund the massive US deficit as there are some signs spending may be coming under control. Bond investors are raising their yields, as they know the supply that is coming, but the moves in Germany and China have not been dislocating because Germany has the capacity, and China needs to avoid a balance sheet recession. So far, so good, but I am watching to see if the back-up in global yields starts to impact the US yields and the US ability to fund the $9 trillion in supply this year. Treasury Secretary Bessent tells the market to watch the 10-year yield, and I am watching it like a hawk. As long as US 10-year are contained, this correction probably doesn’t become anything worse and there is a reason to buy a dip.

Very few see a recession. However, one person that does, is Jeffrey Gundlach from Doubleline, the self-proclaimed “Bond King” now that Bill Gross has moved on. In fact, Gundlach puts the odds at over 50%! How can 96% of investors be so wrong? I think there is some bias among investors to not call for the next recession that may not come. After all, many people, me included, thought there would be a recession early in 2023. It never came. Thus, they are a bit gun shy. However, there is one tried and true indicator that we always seem to forget about - the 2-year 10-year yield curve. You will hear every time it has inverted, we have had a recession. The initial inversion is not the signal, though. There are long and variable lags from the initial inversion to recession. The signal to watch is when the yield curve moves back above zero after having been inverted. When this happens, a recession is more imminent. That is what is happening right now. That is likely what Gundlach (and probably Bessent) see right now. This is NOT what the vast majority of the market are expecting.

There has been some data out in the last week that is worth noting. The regional Feds put out activity indexes for their area. Not surprisingly, they give an early read on ISM. We got the data from the NY Fed (Empire survey). Not only was the headline index lower, but we see two vital components also signaled some trouble ahead. New orders were lower, and prices paid were higher. Wait a second. That sounds like slower growth and persistently higher inflation. Maybe my students were onto something.

Another regional Fed measure watched by the market is the Philly Fed outlook (not only is sports programming east coast-biased, but all of the data tends to be as well. We are used to it in flyover territory). Similar story - the headline index sank, new orders were lower, and prices were higher. Another sign of stagflation. Not a good look for the stock market, particularly when few are looking for it.

Housing is the key to the economy, though. I have discussed the H.O.P.E. approach where housing is identified as leading the economy into and out of recessions. Housing leads orders, which ultimately lead profits and employment. We received a lot of housing data this week. The Natl Assn of Home Builders real estate index continued to weaken. Building permits also weakened. Housing starts were better, but this was thought to be some weather-related make-up from the previous month. None of this should be surprising because we have a measure that I have discussed previously that gives us an expectation of these leading indicators - what I call the mort*job index. You see, most focus only on mortgage rates to anticipate housing. I combine mortgage rates with the unemployment rate because one needs a job to pay for a mortgage, not just low rates. When you use this (white above), you can see it is at least coincident with these leading measures. It is trying to bottom as mortgage rates have fallen 100bps. However, jobs are starting to weaken and there are estimates DOGE might raise unemployment by 0.5%. This would not be good for housing, for the economy, for earnings or for the stock market.
Overall, going through this portion of the analysis, I am left feeling there is more risk than reward. The economy is not on the edge of a precipice, but it has quite a few challenges ahead of it. This is combined with the idea that few investors are expecting this. In the latest Fund Manager survey 83% of investors still see a soft landing or no landing. The number seeing a recession has moved higher, but is quite low. The fundamental of the economy and the market looks weak and unexpected to me.
Behavioral
All is not lost. As we saw in 2023, while the fundamentals can look weak, the technicals can still carry the day. In fact, it was the technical portion of the analysis that kept me invested in the market to some degree even with a recession call in 2023. After all, price is the intersection of supply and demand so we need to acknowledge when price is giving us a signal we may not be anticipating. It all comes down to ‘what is priced in’ and ‘who is there to take the other side of the trade’.

First step is the daily S&P 500 chart. There are pros and cons. The cons are that it has broken below the ichimoku cloud, and the lagging span has as well. This is negative and this has flattened out the upward trend into a new sideways market. Now for the positives. I have circled the areas where the RSI got oversold and has now turned higher, and the MACD has crossed over and turned up. Both of these give reason to believe from a technical standpoint, we can get an oversold bounce in markets. I think any bounce will be sold into and contained on the upside at or near the 6000 level where the cloud is now leveling off. However, that is enough for a 5%+ bounce which is something.

Another short-term technical measure I watch is the 20-day moving average of the Put-Call ratio. When this is moving higher, there is more demand for insurance protection. When it is falling, either hedges are being sold, or upside is being bought. Thus, a rising measure is bad for the market and a falling measure is good for the market. It has not rolled over yet, so we are not getting a sign from the options market that we have seen the low just yet. If and when this rolls over and moves lower, I will feel much more comfortable about buying the dip, even if for a bounce.
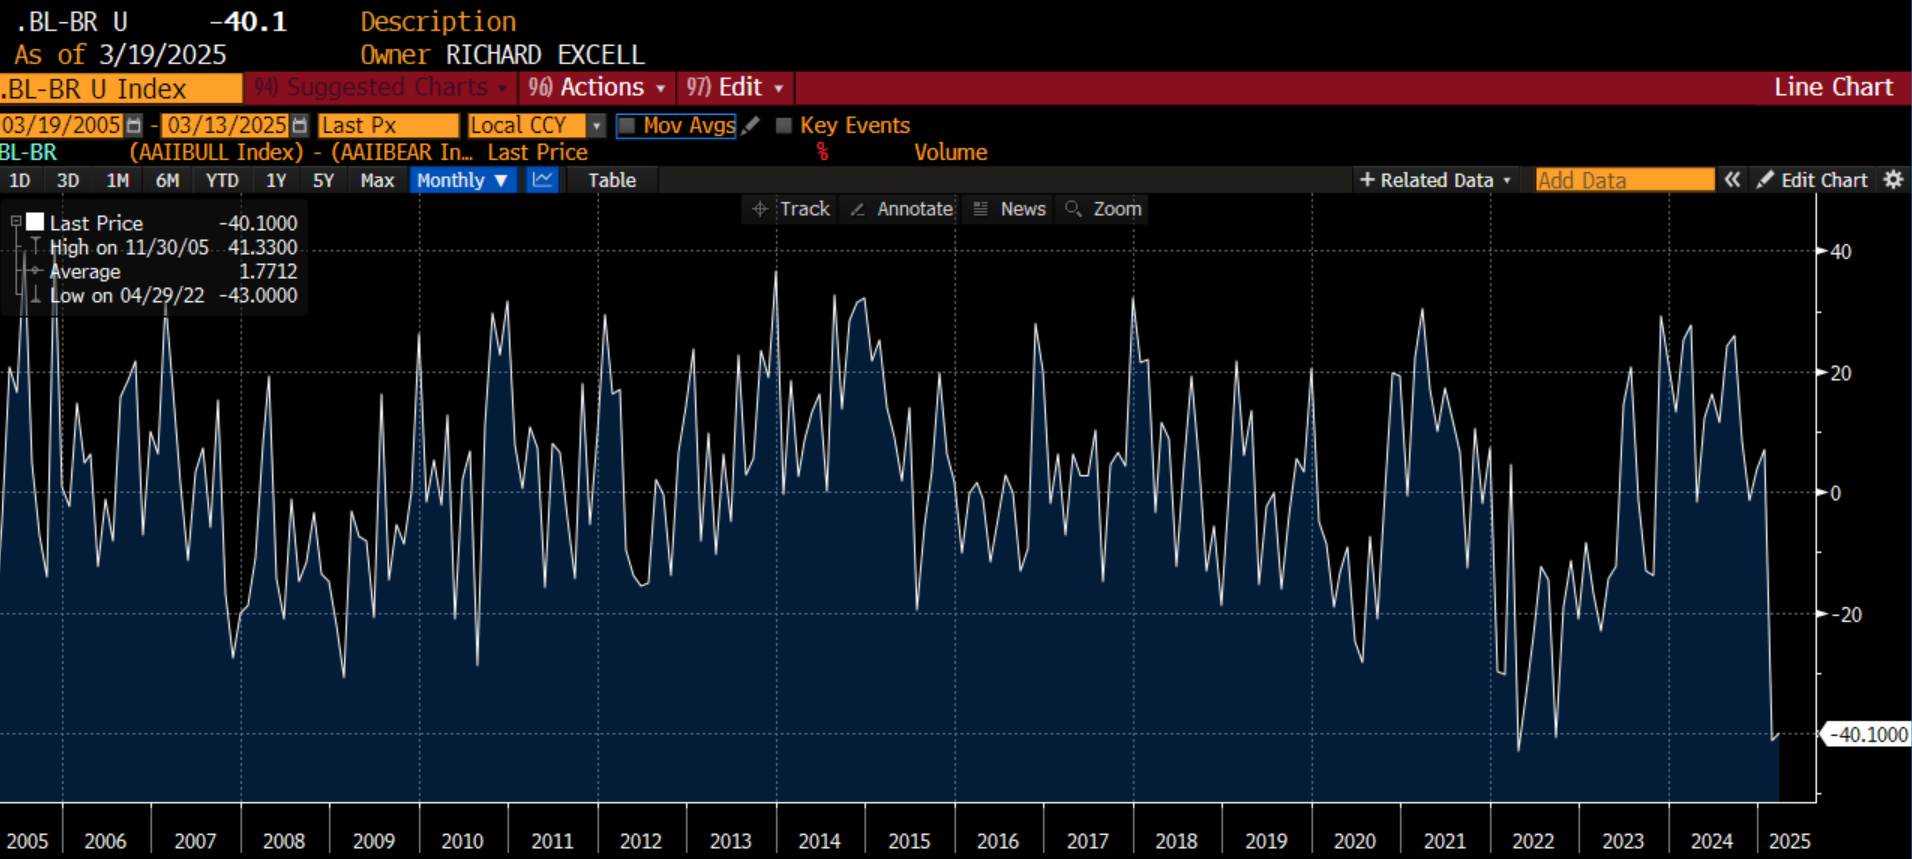
However, there are survey measures that are extremely oversold. This one has been brought up quite a bit. It is the American Assn of Individual Investors Bull minus Bear index. It shows the number of bulls less the number of bears. It is at levels last seen in 2022 which themselves are the lowest levels in 20 years. Could it get worse? Maybe but usually not. Does it mean immediate bounce? No but it has been pretty good at signaling when the market has gotten too bearish. Thus, it is a sign that there is scope for a bounce higher.

Similarly, the CNN Fear and Greed Index is also showing signs of extreme fear. The biggest drivers of this are the options market we discussed, but also market momentum and breadth as well as demand for safe havens. Another potential sign that things have gotten pretty bad.

Where will money go if it isn’t into US stocks? We have seen it flow into US bonds, but we have also seen it flow overseas. Europe is outperforming by so much, many think the entire move has happened. Admittedly it has been a 16% relative move this year, which is quite massive. Admittedly global investors are still very underweight Europe vis a vis the US. That said, there is a lot more that could happen if we look at the 10-year trend of the SXXP vs. SPX. We will want to see earnings start to support this move, and we have not yet seen relative earnings revisions moving higher in Europe. If this starts to happen, though, don’t think we can’t see more of a relative move in these indices, even if it takes years. Governments in Europe are stimulating. The government in the US is taking away stimulus. The relative set-up still favors Europe.

While the relative move in stocks is favoring Europe, the relative move in bonds favors the US. We see this as the Bund yield compared to Bond yields. That is a positive driver for European stocks vs. US stocks, however. The relative bond move corroborates the relative stock move.

The same is true in Japan. US bonds are outperforming Japanese bonds, meaning the yield spread is compressing between the US and Japan. When we have seen this in the past, Japanese stocks (Nikkei) have outperformed US stocks. It has started to happen this year but there is more that could happen on this move too.
Overall, there is potentially scope for a bounce in US stocks for up to 5% given oversold survey data and some short-term technical measures. I would feel more comfortable if the options market was giving the all-clear but that will only bolster the move more. While the US has some relative room to bounce, the clearer path to take risk to me right now is on European and Asian shares. Technicals are positive but only for a trade otherwise.
Catalyst
The last step is to identify the catalyst. What will get people to change their views. How can this be about anything other than the events in D.C. which are changing the global narrative on a daily basis?
The first was an interesting takeaway from the All-In podcast as captured by Bloomberg. On it, Treas Secy Bessent called himself a deficit hawk, news to the ears of the bond market. However, he also tried to soften the tone by saying he realizes that all of the spending can’t happen at once, news to the ears of the stock market. Will the Administration be able to ‘land the plane safely’? That might be overly optimistic when they can’t anticipate how businesses are reacting to the news, how consumers are reacting to the news and how other countries are reacting to the news. I do think it is interesting to note that the primary spokesperson for the markets is aware that he needs to message to both stock and bond investors. This is probably positive at the margin.

I have been reading the work of Andy Lapierre and Don Schneider from PiperSandler very closely. I think they are the best analysts on DC. Don is a great follow on X as well. They remain convinced that tariffs are going to happen, and they are not just a negotiating tactic. They are telling investors that they are all expecting this to just be noise that goes away, but it likely is not noise that will go away. Here are a couple snippets from the team this week.
On the April 2 tariff deadline:
President Trump says April 2 will be a “liberating day” for the country as he more formally sets in motion a complete revamp of US trade policy. Investors should expect this shift will take tariffs to levels not seen in our lifetimes. Market sentiment was buoyed earlier this week by reports that Jamieson Greer, the new USTR, wants to bring more structure to the trade policy-making process. We don’t expect April 2 to reduce investor uncertainty surrounding the trade outlook except to the extent it reinforces expectations of a sea change in tariff rates.
Press reports highlight that many key decisions have not been made by President Trump. Three big developments are scheduled to happen around April 2. First, the executive order Trump signed in his first week in office requires the major departments of the government to issue the findings of their comprehensive review of trade policy by April 1. These findings will provide the rationalization for Trump’s overall approach to trade. Second, Trump has said that reciprocal tariffs will take effect on April 2, though there is come uncertainty whether they will be announced or take effect that day. Third, Trump has identified a number of industry or product tariffs that will be announced (and could take effect) on April 2.
On the fundamental belief of this Administration that an adjustment to trade is needed:
The whirlwind since the election has investors struggling to put the second Trump term in a historical context. Trump himself has highlighted his admiration for William McKinley and his support for tariffs. My colleague Nancy Lazar has drawn some parallels with the big policy shift that took place after Ronald Reagan was elected. I think the better historical parallel is Andrew Jackson. Just as Jackson never wavered in his determination to kill the Second Bank of the United States, Trump is likely to follow through on his signature second-term economic priority – jacking up tariff rates to levels not seen in our lifetimes.
In 1832, Jackson had a smashing reelection win, taking 219 electoral votes to just 49 for Henry Clay and winning the popular vote by 20 percentage points. Trump’s election win last year was narrow by historical standards. But like Jackson, Trump believes he has a mandate for his agenda, particularly tariffs. Like Jackson, Trump was a household name before ever running for president and enjoys exceptionally passionate support from his most devoted followers. Some of that passion comes from the fact that their supporters felt they had an election stolen from them. Jackson won the most states and the plurality of the vote in a four-man contest in 1824, but the House of Representatives selected John Quincy Adams (who awarded the Secretary of State job to Henry Clay, who came in fourth) in what critics deplored as a “corrupt bargain.” (At the time, the Secretary of State was the steppingstone to the presidency.) Trump’s claims the 2020 election was stolen from him are bogus, but polls show most of his diehard followers don’t agree.
Like Jackson, Trump has a personality that the establishment of his day considers dangerous. Thomas Jefferson, who was from a faction (of what became the Democratic Party) generally aligned with Jackson told Daniel Webster, “He is one of the most unfit men I know of for such a place [as the presidency].” Arthur Schlesinger’s sympathetic book on Jackson reports, “Jackson did indeed bear the reputation of being intemperate, arbitrary and ambitious. As a general he had tended to do necessary things with great expedition and to inquire afterward into their legality.” Put another way, he disobeyed orders at times. He suffered most of his life from bullet wounds not in his many military battles, but from his duels.
Like Jackson, Trump reviles his political opponents. Jackson blamed the vicious personal attacks on his wife by his opponents for her untimely death shortly after he won his election in 1828. Trump’s political opponents tried to put him in jail, bankrupt him, and keep him off the ballot. Both also miraculously survived assassination attempts that led some of their supporters to believe their leadership was ordained by God. In his second term, Jackson was shot at from point blank range by an assassin with two pistols. The percussion caps exploded in both guns but didn’t ignite the gun powder so neither gun fired. When tested later, both guns worked fine.
And of course both are widely regarded as economic populists driven by a deep-seated hostility to, in Jackson’s case, banks, and in Trump’s case, international trade. Paul Johnson’s A History of the American People reports that Jackson “did not hate Indians: they were simply an anomaly. He did, however, hate banks, especially the Second Bank of the United States.” He goes on to write, “Jackson made ending the SBUS a major issue in the 1832 election and he felt that the landslide result gave him a clear mandate. It is important to grasp that Jackson spoke from his moral heart as well as his bank-hating head. The nation, he said was ‘cursed’ with a bank whose ‘corrupting influences’ fastened ‘monopoly and aristocracy on the Constitution’ and made government ‘an engine of oppression to the people instead of an agent of their will…Jackson’s love of conspiracy theory and his taste for a moral crusade went hand in hand.”
As we have highlighted many times before, Trump’s protectionism and his disdain for our major trading partners is felt deeply in his bones. A couple of weeks ago Trump said, “Look, let’s be honest, the European Union was formed in order to screw the United States. That’s the purpose of it.” This is ahistorical nonsense. The EU was formed to keep France and Germany from going to war, as they have done so many times during the past couple of hundred years.
But everywhere Trump looks, he sees cheating. It’s not unlike how Bernie Sanders sees the world. If someone is making a profit, there is exploitation. It’s as simple as that – the details don’t really matter. When Trump looks at any international trade, he sees someone, in his words, trying to screw the citizens of the United States.
Even a NAFTA deal he renegotiated and rebranded (USMCA) with zero tariffs on virtually all goods Trump sees as a rip off. NAFTA, it is worth noting, was launched by President Reagan, an ardent free trader and believer in mutually beneficial exchange. Trump’s zero-sum mentality could not be more different from how Reagan viewed the world, which is why their policy agendas differ dramatically in key respects.
Jackson’s strong personality, passionate backing from much of the country, and his deeply felt hatred of banks is why he steamrolled those who opposed his decision to pull the deposits from the Second Bank of the United States and block its reauthorization. And that included his own Treasury Secretary (who correctly worried about a financial panic), Vice President Martin Van Buren (who was instrumental in his campaigns), and many others in his cabinet, who also opposed his Specie Circular that further tightened financial conditions in 1836. Trump shares a lot of Jackson’s personal qualities, and their presidencies have some interesting parallels. In our judgement, it’s a bad bet to believe Trump is going to fold his tent on his signature second-term economic priority.
Finally, a bit from Michael Hartnett at BAML on the latest fund manager survey, where things are getting really negative really quickly. Yes, sentiment has collapsed. However, positioning is not matching that sentiment. We have fully invested bears it would seem.

There is reason to think that the set-up is such that there is a tradable low at some point in 1H of 2025. The actions of the Administration combined with the effects of the yield curve and unwind of fiscal stimulus will bring a slowdown in the economy, which few are expecting even if they are getting more bearish. There are signs the market is getting oversold, but any bounce is likely one to sell into because we are likely not at the real low yet and won’t get there until the April 2 tariff news is either real and baked into the price or avoided and we get an all-clear. The fundamentals of the economy are weakening, and this will start to factor into the earnings revision news. This keeps me from wanting to buy the dip and hold until year end. As I said, I think any bounce is to be sold into because positioning will need to adjust to reflect the bearishness. Medium term, I think the Treasury Secretary and Administration can find the right mix of cuts in spending and stimulus from taxes and regulation to get the economy growing again, but that is a 2H story imho. Be careful out there in your risk taking.
Stay Vigilant, stay firm, stat sober-minded. There will be opportunity but don’t be in too much of a hurry.

Another good missive, thanks. I read a lot. Most of the factors you touch on are mentioned by other writers as well, which gives me more confidence as to what is important to the thinking community out there. Other writers tend to isolate factors rather, and expound on them, which is certainly helpful. Your strength however is to go beyond and link factors together into logical sequences that make sense and paint a more complete picture. Sound thinking.
Thanks again for your effort and I hope your " curve ball" is straightening out somewhat.
I think we’re headed in two directions - stagflation and recession. What are the odds of us slipping into stagflation, breaking the backs of consumers, which then pushes us into deep recession? I’m thinking a repeat (maybe not to the degree) of the 70’s stagflations story, with a 2000’s style recession on the heals of it?