Trick or treat
As Halloween approaches, stock investors have had their own sense of trick or treat as we are in the throes of earnings season. What is the message so far?
Throughout my career, earnings season has always been a big focus for investors. However, as more and more investors move to passive vehicles, it takes on even more importance these days, since active investors use this time as really the one time to position or re-position a portfolio based on the news and trends, knowing full well that once the season is over, fund flows driven by macro conditions will dominate the price action. As you can see, we just finished the first of three big weeks of earnings.
This is the calendar for November. The end of this week and then the following week will be the last of earnings season. There are still more names to report, but by November 10, really by November 3, the attention will move to Black Friday and any year-end rally.
Trying to level set where we are and why it matters, we can see that in spite of the Sturm und Drang about the economy at the start of the year, and what that could do to earnings, the reality is that earnings are only modestly lower so far this year. If anything, it is more of a normalization than anything else. However, you can also see from the red shaded areas, if there is any sort of meaningful slowdown next year, we should expect earnings to get hit pretty hard.
That is clearly not what equity investors are anticipating. The table below is one that I have shown before, equity investors see double digit growth in earnings each of the next two years. That, my friends, is not a recession. It is not a soft landing. It is no landing at all. In fact, this growth is above average growth in earnings which historically are about nominal GDP + dividends or call it about 6%.
The expectations are even headier for the Nasdaq names.
Before I show what has actually transpired, this is what I wrote on LinkedIn earlier this week about what we had seen so far:
“Chart of the Day - Magnificent 7
I am not sure who coined the term for the Magnificent 7. Pretty clever if I say so. It is the term used to describe the 7 stocks that have been leading the S&P in the entire post Covid world. For those that don't know these are Apple, Amazon, Nvidia, Microsoft, Alphabet, Tesla and Meta
The chart today shows that relative performance of the SPX Index vs. the SPX index ex these 7 stocks. Thus, the higher relative level of the S&P shows you the impact the 7 stocks are having. In percent terms, the broader mkt is up over 10% while the index without the 7 is up just over 2%
If you look at the bottom panel you can see that we are at the highest relative levels of the last 5 years. It is higher on a relative performance vs. the broader mkt, than it was at the peak of the bull mkt in 2021
You can also see that in 2022, when the mkt drew down severely, it was led lower by the relative performance of the Magnificent 7. Thus it is safe to say that these highest mkt cap stocks are driving the bus right now, higher or lower
Because of the impact on the index, it is also safe to say that when I see the high bar for earnings growth built into the index, a good deal of these growth expectations are coming from the Mag 7. Thus, we really want to know what is happening with the biggest winners
Apple doesn't report until next week. The whisper is that numbers will look light because China sales have dropped severely since the govt is urging people to buy the Huawei phones
Amazon comes out tomorrow. The other consumer names have been hit hard as shoppers are pulling back. Can Amazon continue to be the lone name where people spend? (Editor’s note: Amazon was better than expected 7 it said it’s cloud business is stabilizing leading to a rally in the shares)
Nvidia, everyone's AI hero, doesn't come out until Nov 21
Tesla came out on Oct 18 disappointing on sales & earnings. It is still growing at a level most companies would dream of. However, as equity investors we need to know what is priced into the stock. The stock has traded lower since
Meta comes out tonight (Editors note: Meta earnings were better than expected but it’s guidance was downbeat and the stock went lower)
However, futures are moving today because of Alphabet & Microsoft which both came out last night. Both are moving because of their cloud businesses. Alphabet was light on its cloud revenue. Microsoft was better
Is this because MSFT is further along on AI? Are we seeing early wins from the Open AI stake? Is this because MSFT sells more into large enterprise vs. SMID companies? We know large cap has crushed small cap this year.
Either way, for the names that have reported of the Mag 7, there have been more disappointments than positive surprises. The expectations are still high for the others but investors are probably starting to get a little nervous
How will this play out as we get the rest of the Mag 7. As you see in the top panel or look at the charts, we are near a critical support level. If we can't hold here, led by the top names, it poses some problems for the broader mkt
Time to ... Stay Vigilant”
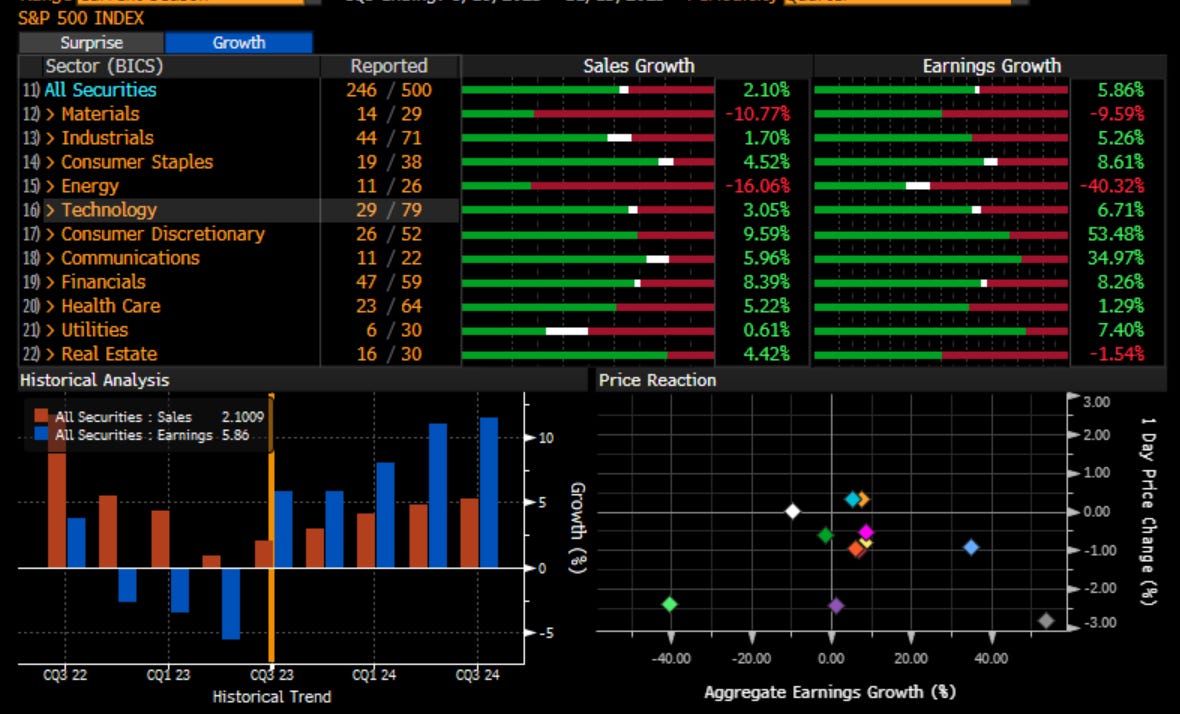
Most investor portfolios will hold more than those Magnificent 7 names though. Let’s look through the various indices to see what it is happening. First, let’s look at the broad S&P 500 market. Sales are coming out largely in line across the board, with no real standouts. Earnings have been consistently better than expected, as usual, with every sector except earnings coming in better than Street estimates. Exxon and Chevron were not the only names dragging Energy lower, but the focus in that sector is more about the mega deals those two names did in the past two weeks. You can see in the lower left panel, this level of earnings surprise is essentially what we have seen all year long. It is interesting to see sales surprises slowly deteriorating. Most importantly, though, as I alluded to in the LinkedIn is in the lower right of this table. This clustering of dots is showing you that even with sectors reporting better than expected, the 1 day change in stock prices has been negative across the board. Don’t even think about missing earnings as these names were severely punished.
On the growth front, again we can see sales are basically in line and earnings growth is about 6%, which is average. Companies are also saying it will be worse than this. However, recall from the earlier table, that double digit growth is priced in for next year. Thus, the negative reaction in stock prices.
The Nasdaq has fared better than the S&P with sales growth at 8% and earnings growth almost 30% this season. You can see in the lower left that the sales growth is in line to what we have seen and expect to see while the earnings growth is much higher. In spite of this, in the lower right, the reaction is still more muted to largely negative in spite of some mega cap names that have beat number and moved higher. Is AI getting priced in?
One part of the market that has struggled all year long, and continues to struggle, is the small cap area. It isn’t just flows and technicals, as we can see negative sales and earnings growth. Small cap companies are feeling a triple threat of slowing if not negative growth, higher inflation crushing margins, and expensive if not unavailable credit that is impairing the ability to make changes to their business. The negative reaction by the stocks suggests this bad news is not priced in despite the index being negative on the year. I find this very disturbing as small cap stocks are often referred to as the canary in the coal mine, an early warning of what could happen good or bad. Given the small companies have more leverage to the economy, small caps will have a higher beta. The struggles of small cap are a major yellow warning flag for me.
This is the best approximation I could find of the negative guidance. It is the difference between companies reporting positive vs. negative financial outlooks. It is noisy on a day-to-day basis but you can see the 1 month moving average cutting through the data, trying to smooth it out, and it is clearly moving lower over the last two months.
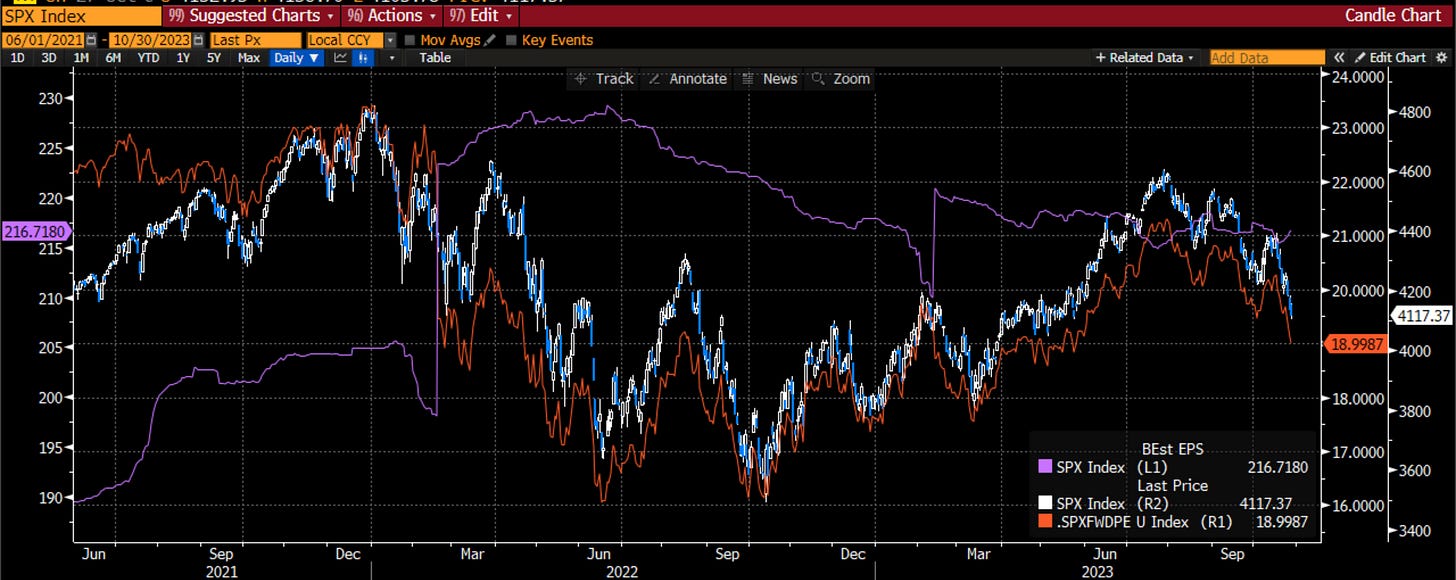
As I have said before, the economy moves earnings and earnings move stocks. Investors will anticipate the earnings moves and thus we may see earnings multiples move before earnings. Multiples then become a good gauge of investor sentiment. In this chart I plot earnings in purple, index prices in blue/white and the multiple in orange. You can see that over the last two to three years, it has been the multiple really driving index prices with earnings playing second fiddle. The higher multiple anticipating much higher earnings growth has held index prices at higher levels than many investors think is appropriate. Can this continue?
This chart shows you the earnings multiple vs. the Moody’s Corporate Baa yield (inverted). This is the cost of equity vs. the cost of debt. Of course, there is a relationship. With the cost of money moving higher with sovereign yields hitting multi-decade highs, the cost of debt has gone up a good amount. It would appear the cost of equity needs to go higher as well. In fact, this overlay would suggest the multiple falls even below the long-term average of 15x.
The news gets worse. Corporate yields have nowhere to go but higher it would seem. If I look at the difference between the Moody’s Bee yield and the 10-year US Treasury, a credit spread develops. If I look at this spread, it is at the tightest levels in 30 years. This says credit investors are not only not worried, but they are also more enthusiastic than we have seen at any time this century. My good friends in the credit market will hopefully comment, as I am sure there are some differences in duration between Moody’s yield and 10-year Treasuries that is adding to this, however, I would suggest that the news can really only get worse for credit. If it gets worse for credit, what will happen to equities which are lower in the cap stack?
I will end with a conversation I had on Friday with a good friend who has been in the markets with me for 30+ years. He said: “All indications are we finish the year higher.”
To which I responded: “If so, it would be purely behaviorally driven. I see nothing from an economic standpoint, a company earnings standpoint, a valuation standpoint, or an asset allocation standpoint that leads me to that decision. It would be entirely because PMs goose the mkt higher to get a bigger bonus. Even the AI luster is fading for now. That is all in the price. We saw no tangible evidence that any theme we have traded on has actually taken root in the fundamentals. I struggle to see how anyone is compensated to take risk right now. I think risks are rising globally. I think the bar is high for earnings. I think there is no margin of safety in stocks. I would be more surprised if stocks went higher vs. lower to be honest.”
I see tricks but others still see treats. As I would tell my kids on Halloween …
Stay Vigilant


