Twas a busy week
We were hit with a lot of information this past week on the economy and on earnings. What are the main takeaways?
The past week was a whirlwind. At times, it was difficult to know what to focus on and what the market would focus on. We were hit with a good amount of economic data and had over 10% of the market reporting. We will get another 23-24% of the market reporting earnings over the next two weeks as well. We are in the heart of it.
We also got a lot of information on the economy before the FOMC meeting on May 3. This could change the path forward for short-term interest rates. This would impact the multiples investors put on a stream of earnings and the spread demanded for corporate bonds. So, a big week. Let’s dig in.
Economic data
The next three panels show the breadth of the economic data that we received. You can see it was led by regional Fed surveys: Chicago, Dallas, Richmond, Kansas City and Philly non-manufacturing. However, there was also a fair bit of information on the housing market: FHFA, Case-Shiller, New Home Sales, MBA mortgage apps. Finally, we got both the Conference Board and University of Michigan conumer confidence numbers.
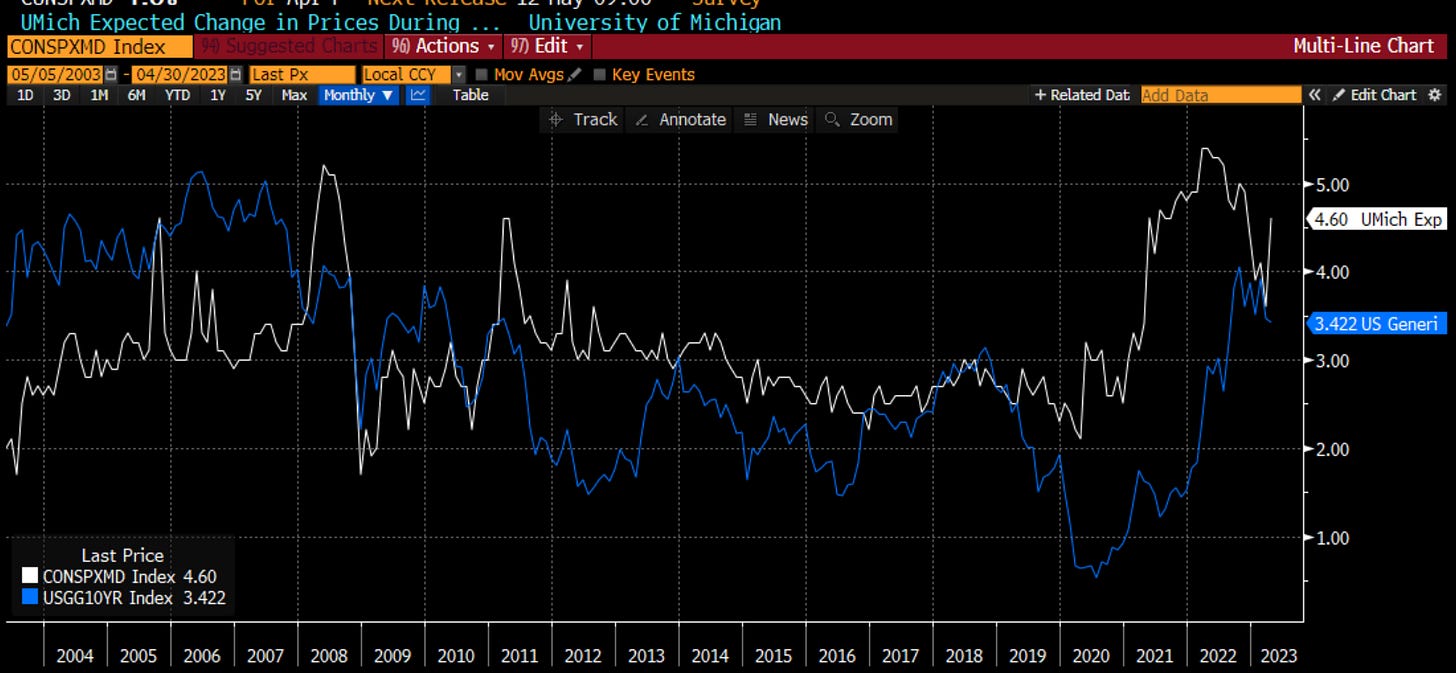
The data to my eye can be summed up best with the numbers we got on GDP, GDP Price Index and PCE deflator - stagflation. Others may suggest that this is not technically stagflation, however as we saw with the GDP number, growth is slowing more than before, coming in at 1.1% vs. 1.9% expected. Prices are still stubbornly higher with GDP Price at 4% and PCE Deflator at 4.6%. Speaking of 4.6%, the University of Michigan inflation expectations are also at 4.6%. This will keep the Fed solidly in play. Not only this but the stronger than expected (though still not strong) housing data. Even jobless claims and continuing claims were better than expected. Thus, a week of better data ahead of an FOMC meeting is surely to keep the market focused.
If I aggregate the regional Fed surveys that we got last week and the week prior, you can see a small tick higher. This could have investors focused on a bottoming in ISM when the data comes out on Tuesday.
The housing market is also giving a potential sign of the ISM ticking up this week. Recall as I mentioned last week, the best time to own stocks is when ISM is below 50 and rising. Many have been calling for this. I have not. I may be very wrong on this. This was another set of information suggesting we might be in that soft landing phase.
However, the tick higher in inflation expectations also may suggest that the bond market has been too sanguine on the rates front. I wrote this week on Linked In about the largest short in the history of the US Treasury which many be driven by a number of things. This helps that position:
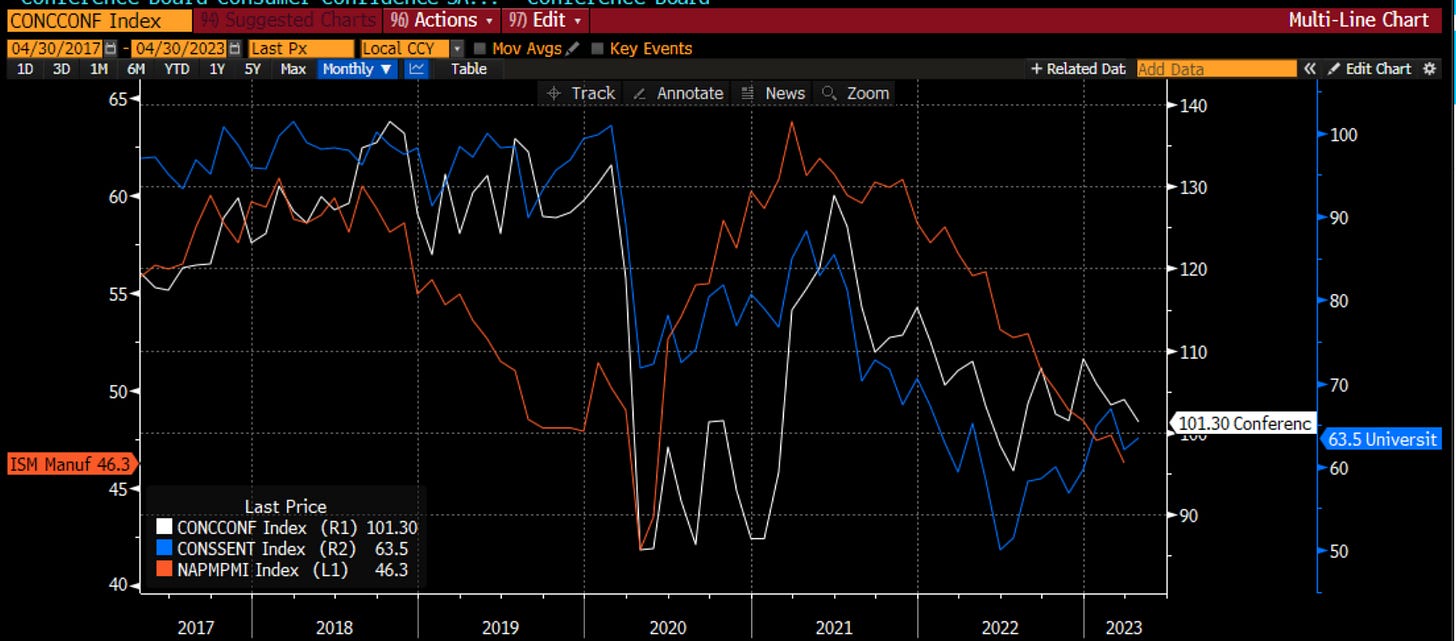
However, the consumer sentiment measures are not pointing to stronger growth:
Labor vs capital
This may highlight again something I have referred to a few times in different ways. I have referred to my idea of a “job-full recession” which would be the mirror image of what we experienced after the Great Financial Crisis which was a “jobless recovery”. In that period, the 1% benefitted from the rise in asset prices while the 99% did not because the recovery wasn’t strong enough to get anyone back to work.
My thought this time was that companies found it so difficult to hire after Covid, this slowdown may be met with less firing and therefore a stronger jobs market. This could keep the Fed in play because it is focused on the unemployment number. At the very least it could well mean higher for longer because even if inflation falls, as long as the job market is strong, there is no reason for the Fed to cut.
There are other signs that the pendulum is moving back in favor of labor over capital. We certainly see this in the populism of our politics, on both the far right and the far left, where constituents of both extreme side of politics are growing and probably agree upon more than they would be willing to admit to.
We also see it in the move toward stakeholder maximization and away from maximizing shareholder value. 181 CEOs of the Business Roundtable signed an agreement saying that companies should focus on maximizing the value for all stakeholders - employees, customers, communities, suppliers and of course shareholders too. Not to be too controversial, but this sounds more like the “Common Prosperity” that Xi Jing Ping was espousing before the last National Party Congress than any of the ideas that Milton Friedman promoted in the 70s.
We are starting to see this in the data. This is a measure of wages vs. revenue that clearly bottomed in the post GFC period and continues to grind higher. Still a long way to go, but if this shift is occurring, it is a multi-year if not multi-decade trend. This chart is courtesy of PiperSandler:
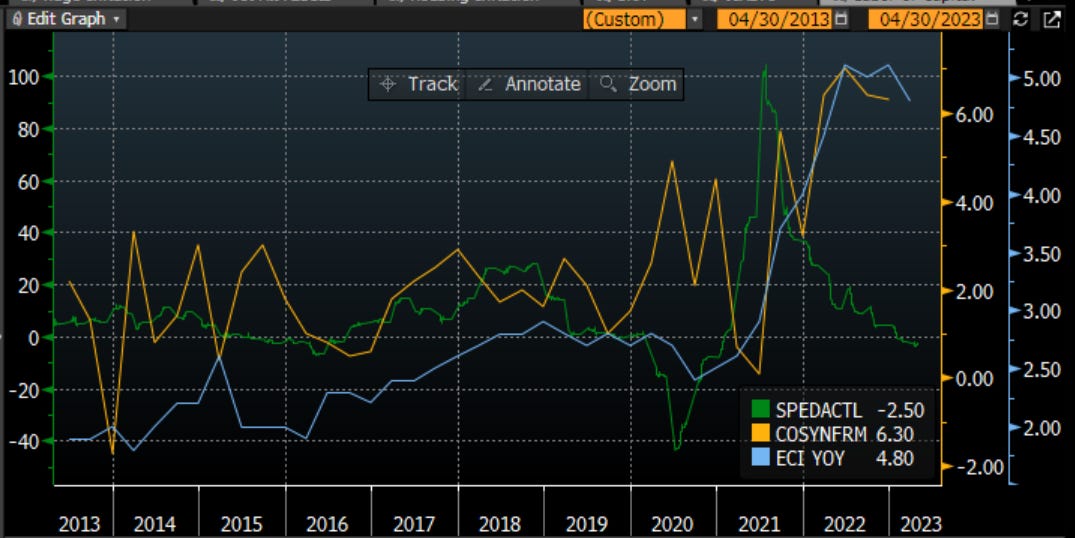
It is also inflationary. The next two charts, also from PiperSandler, show us why this is. We can see the correlation between US CPI and unit labor costs on the left. We can see how far above trend unit labor costs are on the right.
If we look at both unit labor costs and the employment cost index, and compare to the yearly growth of earnings, we can see more benefit accruing to labor instead of capital. High nominal growth is hurting margins because it is passed on to labor in the form of wages.
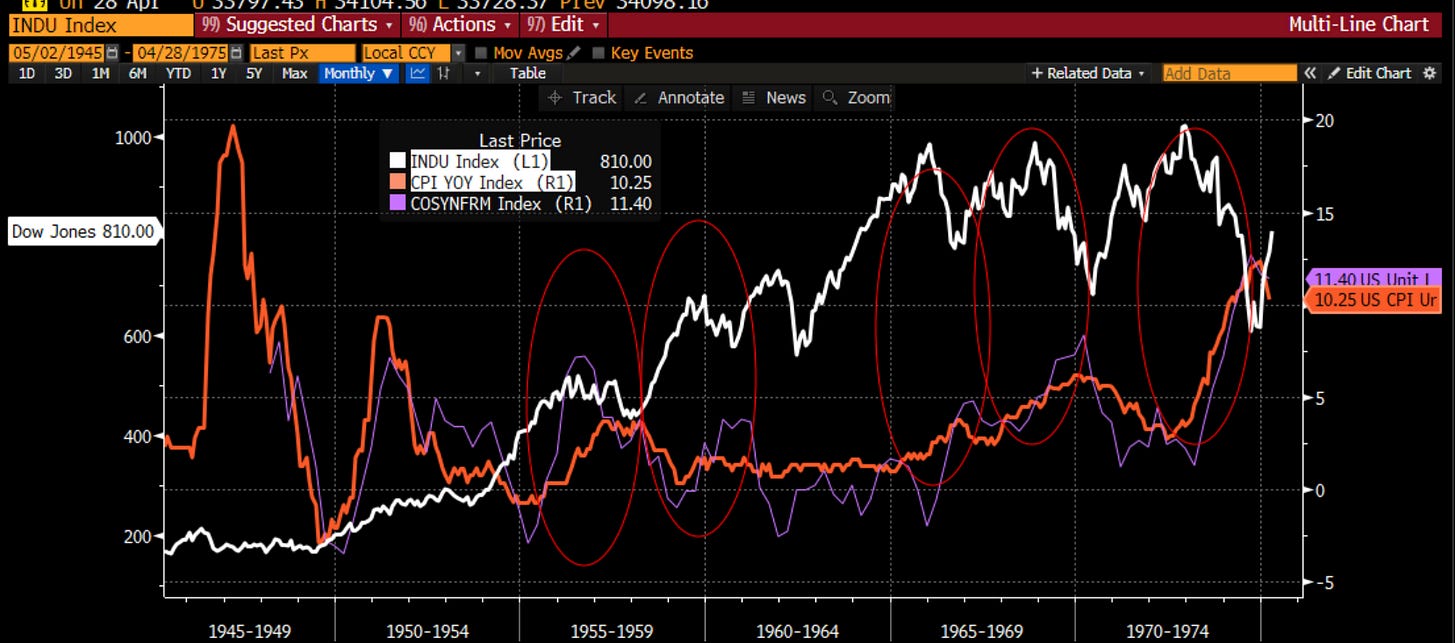
This brings to mind the reaction of government in another period in US history - the immediate post WWII scenario. I have discussed this before as the other major period in US history, other than Covid, when we had the same magnitude of monetary and fiscal policy growth. It took a decade to work through those excesses. In order to do so, the government focused on hurting capital and not on hurting labor. US workers were freshly back from the sacrifices of war, whether they be soldiers or family members who were back here supporting the soldiers in the factories. The government allowed and encouraged higher unit labor costs, which directly fed through into inflation. When we saw this, stocks responded negatively because the government would hurt capital as the way to dampen inflation and not hurt labor. I have circled the 5 periods in the 30 years post WWII where we saw spikes in unit labor costs and therefore inflation, and how this was a negative period for stocks. There was clear political support for these policies and we saw this in the growth of labor unions and in how people voted.
However, inflation became so high and so permanent, something had to give. Enter Ronald Reagan and Margaret Thatcher. The policies shifted in the early 80s. We had academics like Milton Friedman constantly skewering the government for its excesses and we had central bankers like Paul Volker out to crush inflation. However, it was also the political rhetoric and policies of Reagan and Thatcher that shifted from the extremely high tax and high inflation world to a world that favored capital. Unit labor costs and CPI tamed into a low range and we went on to the greatest bull market in stocks and bonds in history.
Leading up to, and certainly post Covid, we are seeing the pendulum swing back toward labor. It was Bernie Sanders AND Donald Trump, both promoting US workers on either side of the spectrum. Now Joe Biden continues the same policies which are clearly aimed at raising wages for workers. The policies from both parties are not about reining in spending and being austere. They are not in favor of capital. They are in favor of labor. Yes, It looks like inflation is falling from the very high levels for now. However, with these policies and the growth in government, should we expect inflation to fall back below the 2% trend? If capital and not labor is paying the price, should we expect stocks to go into a bull market?
The economic data in the past 2 weeks certainly sees a Fed back in play. The odds of a hike have gone to about 80-90%. Also, the number of rate cuts this year have been reduced and the first cut pushed back to November from July. I think before long this will be gone. The Fed is still in play and higher for longer will be the mantra. Labor will get the benefit of higher wages. Capital will have to pay the price.
Earnings deep dive
How did this play out in earnings in the past week? I wrote about this on LinkedIn this past Friday:
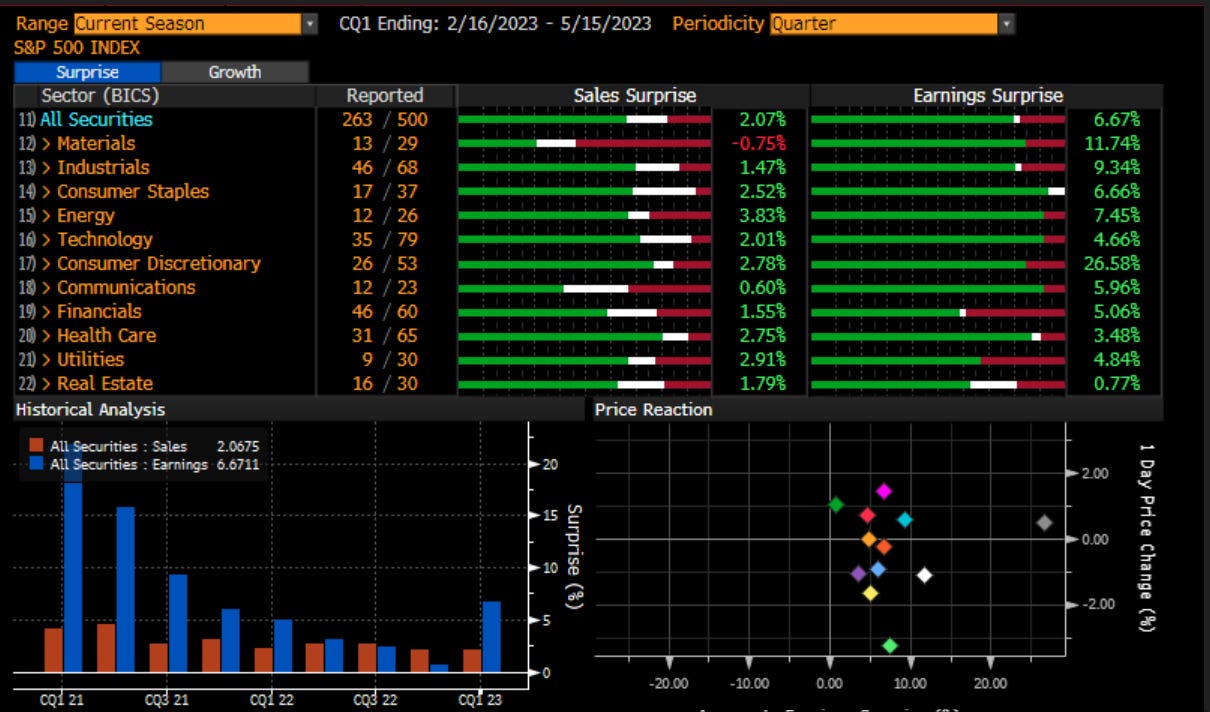
Chart of the Day - better than expected
We have been in the midst of a couple busy weeks of earnings. There is still another to come but that will also include some FOMC focus. It has been almost purely about earnings in the market of late
These earnings have clearly been better than expected. In absolute terms, earnings growth is negative (-1.75%) with sales growth a small positive (4%). However, as you can see from the chart today, both of these numbers are better than expectations
It isn't being driven by just one name or one sector. That is not to say these numbers have been unanimous as there have been high profile misses too. However, go down the list sector by sector & earnings/revenues have been better as you see in todays chart
If you look in the lower left of the chart, you can also see the magnitude of these beats on both top & bottom line are better than any quarter since Q3 21
This gave the market a nice short covering lift yesterday & has allowed it to recover from some bigger down days. Since Easter, so for the last 14 trading days, the market is flat. This probably surprises (and hurts) bulls & bears alike
You can see in the lower right of this chart the reaction across each sector to the beats. The aggregate surprise of 6.7% is leading to a 1 day price move of -0.2%. The market is saying 'meh' to these earnings. Why?
A lot of this has to do with the forward guidance. Take AMZN last night as a great example. It had one of the bigger beats of the season, besting earnings by 70%. However, the stock is looking lower this morning, down about 2%, dragging down futures
On the conf call the company said growth in its cloud division, its most profitable, is expected to continuing to slow down. It said expect earnings & revenues to be in-line going forward in spite of the big beat
Other sectors where the numbers this quarter were much better, but where the aggregate outlook is not as good & thus the stock price reaction has been negative include financials, energy & materials. Whether it is banking issues or lower commodity prices, investors do not see a repeat next qtr
So the mood into the summer may not be as ebullient as the 4200 ish level in SPX suggests. Back to the top of the range, brought here by good earnings, but is it enough to push us into a new higher range?
This is what makes trading & investing so difficult. This is why people who learn to 'pick stocks' by calculating the WACC and building a DCF will get frustrated early on. Short term, it is about playing the player as well as playing the cards
We are a little more than half way through earnings. We have hit most of the mega cap tech names that are the biggest holdings though. Sell side analysts will go back & update models, seeing if the narrative has changed
Traders will shift their focus to the FOMC next week. We will be on to the next catalyst. Earnings have been great. Is that good enough?
Stay Vigilant
A better summary on this earnings season comes from Jonathan Golub at Credit Suisse:
“Below is our 1Q earnings season summary.
Yesterday, AMZN reported EPS growth of 183%, surpassing expectations by 43% on higher cloud sales and stronger advertising revenues. Ex-AMZN, Discretionary’s growth falls from 48.7% to 14.5%.
1Q expectations are for revenues and EPS growth of 2.2% and -4.5%. EPS is expected to grow +6.5% and +7.1% in Financials and Cyclicals, but decline -11.4% and -13.2% in TECH+ and Non-Cyclicals.
61.2% of the S&P 500's market cap has reported. Earnings are beating estimates by +6.8%, with 75% of companies topping projections. EPS is on pace for -1.9%, assuming the current beat rate of +6.8% for the remainder of this season.
Value is delivering stronger revenue and EPS growth (3.2% and 0.4%) than Growth (0.6% and -5.9%). Value results are beating expectations by +7.9% vs. +5.3% for Growth.
EAFE is delivering higher revenue and EPS growth (3.2% and 7.0%) than the U.S. (2.2% and -4.5%). However, EAFE results are topping consensus by 3.6% vs. 6.8% for the U.S.
More globally-oriented S&P 500 companies are delivering faster EPS growth than their more domestically-oriented peers: -0.9% vs. -9.2%.
Despite strong beats, 1Q price action post results have been muted. Companies beating on both revenues and EPS are outperforming the market by 0.1% vs. an average of +1.7%, while ones missing on both are underperforming by -2.6% vs. -3.1%.
Over the next week, 160 companies representing 23.4% of S&P 500’s market cap will report results, including Apple, Pfizer, AMD, QUALCOMM, ConocoPhillips, Starbucks, and Booking.”
Back to my interpretation by Golub’s charts. We see the higher revenues but struggling margins in total. We can also see the distorting effect of Amazon on earnings. Cyclicals are better able to pass on price and have margins hold up which is to be expected. That is why these sectors do well in inflationary environments. Those that have a higher labor cost issue, see margins hurt and are forced into layoffs:
While the absolute numbers show weakness in many places, this is all better than expected. The surprises are positive across the board:
If we break it down by growth vs. value, we can see value names are doing better. Again, value stocks typically have higher fixed costs and therefore inflationary periods benefit them on a relative basis. Growth names have high marginal costs from labor and get hurt more.
We can certainly see Europe, Africa and Far East stocks doing much better than the US though this may be a little distorted by some Communication Services names.
If we look within the US, we can see companies that export are growing faster than those companies focused on the domestic market:
Some collections of company headlines (curated by Piper):
Robert Half sees Q2 EPS $1.09-$1.19. Consensus $1.25. Revenues for the first 2 weeks of April were down 11% y/y. Permanent placement revenues in March were down 17% y/y. For the first 3 weeks of April, permanent placement revenues were down 13% y/y.
UPS fell 10% after it met its profit forecast but said it made less revenue than expected. It also said its revenue for the full year will likely come in at the low end of its prior forecast, citing a challenging economy and other factors. NYT 4/26
Packaging Corp reported an historically steep (13%) decline in its box shipments in Q1 as consumer spending deteriorated throughout the quarter. FreightWaves 4/27
Less-than-truckload carrier Old Dominion reported a 12% shipment (LTL tonnage) decline in Q1 and a 15% decline thus far in April, saying that the economy has been worse than anticipated. FreightWaves 4/27
Google reported a second straight drop in advertising revenue, extending a rare decline as the company navigates economic concerns. WSJ 4/26
Microsoft said its growth remained subdued last quarter as economic concerns cooled consumer demand and corporate orders for the company’s software and cloud services. WSJ 4/26
Amazon has started laying off employees in its cloud services operation amid slowing sales growth. BBG 4/28
Clorox to terminate approximately 200 positions, or roughly 4% of its nonproductive workforce. BBG 4/23.
Mattel posted a bigger-than-expected loss of $106m as it grappled with higher costs and retailer cut-backs on orders. NYPost 4/27
Bed Bath & Beyond filed for bankruptcy protection. USA Today 4/25.
Domino’s Pizza posted better-than-expected profit, but shares slid 6.5% afterthe company warned of a slowdown in its delivery business. NYP 4/28
Gap will slash 1,800 corporate headquarters and field management jobs as part of a cost-cutting reorganization. NYP 4/27
Discount retailer 99 Cents Only Stores reported a decline in fourth-quarter sales due to lower customer traffic. BBG 4/26
In total, we are about half way through earnings here in the US. As I said before, another 1/4 of the market comes out in the next two weeks. By that point, earnings season is basically over. By that point, we will also have had another FOMC meeting where we probably see higher rates and, given the deposit crisis appears to be in the rear view mirror, perhaps some hawkish rhetoric as well.
We can see that the stock market has been in a sweet spot of late. The P/E has been rallying on the expectation of the Fed stopping the hikes and cutting rates at some point. Then it gets the extra benefit of better than expected earnings. However, as we exit earnings season and go into a FOMC meeting, perhaps we will start to see a change in this tune. Maybe we will start to realize higher for longer means P/E won’t be near 29.5x as it is now but move back to 22x as it was last fall when the market was not sure when the FOMC would stop nor when it would cut. Earnings continue to come lower and in a world where labor is going to benefit more than capital, this keeps wages high and hurts the growth type of names that rely on labor the most. So earnings could continue to fall.
Finally, this is all happening as we move back to the high end of the range and run into resistance on the weekly charts.
Considering other historical analogies, some have suggested that the Covid work from home boom was akin to the late 90s internet bubble. They expect the unwind of the work from home book to resemble that of the unwind of excess internet capacity. It is an interesting analogy. It really seemed to hold until this year.
Regardless of the analogue that you may choose, I still think there are headwinds to risk taking. However, I have clearly been wrong as the market looks quite strong. Mr. Risk has been calling for a bottoming of ISM and stronger stocks, certainly through the stronger April seasonal. He has been right. However, I am not sure the problems have begun to play out yet. Let me know what you think. I am interested to know if the market players are as bearish as the data seems to suggest.
Stay Vigilant








Hi Rich, thanks so much for Stay Vigilant and your LinkedIn posts. May I please request a Stay Vigilant topic for your consideration....With increasing probability of entering a recession in the next few months, there's increasing probability of Treasuries seeing a price appreciation. I can see the relatively short lived but distinct blip in NAV of TLT around 2008-2009 for example. Not so obvious is the cause or how different Treasury maturities may be affected. Which appreciate because of investor flight to safety, which appreciate by action of the FED lowering rates? A perturbation of this market cycle positioning strategy may be the debt ceiling Treasury dynamics (Jesse Felder recently wrote about Growing Potential For ‘Turbulence’ In Treasurys). And then there is the wild card of why and when foreign holders of Treasury Securities may have an interest in selling Treasurys at a more rapid pace--certainly there are monetary policy reasons for doing so in various countries, but a possibility exists for a more aggressive attempt to perturb US markets at some point. And should a transition to stagflation arise could there be 2022 part 2 erosion of the negative correlation of Treasurys to stocks and loss of their flight to safety value?
Many thanks for your consideration,
Carl
Once again a fantastic run down of everything that happened during the past week