


Uncertain times


I want to start by thanking everyone for the very kind words that you sent my way in the past week. You don’t know how much it means to me that you took the time out of your schedule to reach out, check in, and/or have a short chat. This is the kind of support that will get me through the current uncertain times but also keep me going to write more on Stay Vigilant.
The uncertain times continue both personally (though real progress is being made) and also in the financial markets. The markets are still struggling with this uncertainty as the rational way for investors to handle a wider variety of potential scenarios is to use a higher discount rate. This means lower target prices and therefore lower current prices. Another way to look at it is some weaker handed traders, perhaps those that bought after the election, are stopping themselves out. The CNN Fear and Greed Index suggests Extreme Fear and both the Investors Intelligence Sentiment Index, and the American Association of Individual Investors Sentiment Index suggest a bearishness not seen since the Great Financial Crisis. While this creates an environment of possible quick move higher, we lack the catalyst. The catalyst could simply be the lack (or official unwind) of bad news. We shall see.
For the Stay Vigilant this week, I am going to post the notes that I wrote each day. Some of the charts are a little out of date already e.g. indices are now below where they were back in August/September after Thursday’s move. However, I think the theme still holds. I followed the theme of uncertainty and suggested in uncertain times, the most important things are perspective, faith, support and hope. I think this is true both personally and professionally. I hope you enjoy.

Chart of the Day - uncertainty
If we can characterize 2025 by anything, I think it is fair to say uncertainty is the right way
What will happen with the realignment of global trade and the possible ending of US hegemony? Is this a good thing for the globe? Does it wake people out of the funk that the US will and must do anything and spur them to action?
This is one interpretation we see in markets. Of course, there are two sides to every coin. There are others, many others, decrying the change. Perhaps they are correct. Perhaps, we had a pretty good thing going since the end of the Cold War and why would we want to screw that up?
In my Stay Vigilant this week, I said the one chart to watch is global bond yields. I believe this. Sure, Germany is spending a lot on defense and infrastructure, having not done so in a long time
The stock market really loves this. However, the bond market moved up 40 bps in a week. That is potentially destabilizing
Yes, investors love Chinese tech stocks because of DeepSeek and now Baba and the potential Chinese AI dominance
However, bond yields are barely off the lows and there is doubt cast on the size and scope of the fiscal stimulus just announced. Calling a bluff?
Yes, investors like that Japan has some inflation after 35 years. Nikkei finally retook the 1990 highs last year. Yet, yields moved above 1.5% for the first time since the GFC & unions are asking for the biggest raises in decades
I bring this up to suggest that in spite of what looks like some good news, there is still uncertainty. In the US, it is measured with the economic uncertainty index. This index is back to Covid and GFC type levels. That's a lot of uncertainty
However, market measures of uncertainty, while having moved higher in the last couple of weeks, are still incredibly tame. For every AAII chart of the bears or screen shot of the CNN Fear and Greed, I would present you with the following
Yes, the VIX Index is up to about 25. However, the last time the uncertainty was this high, VIX was clearly much higher. Yet, at least the VIX at 25, above the long-term average, indicates some level of risk
Consider credit spreads. These are barely off the lows recently hit and are near 25 year lows. This doesn't suggest that credit investors are particularly worried about this economic uncertainty
Finally, while stocks have sold off some in the last month or so, the equity risk premium is still in the bottom decile. Not quite to the 2000 tech bubble lows, but certainly near the lows seen right before GFC
I bring this up to suggest merely that while there is a great deal of uncertainty in the world, it isn't entirely clear that the market is pricing this in right now. Thus, there could be more downside to risk as this reaches a crescendo
Paraphrasing Tony Robbins here, the quality of your portfolio is directly related to the amount of uncertainty it can handle


Chart of the Day - perspective
The market sell-off does not feel good. Let's face it, market sell-offs never feel good
That said, not every correction is the end of the world. I would also say that not every correction should be quick to be bought
I try to give some perspective because I think this will help us get inside other investors heads. What is the same? What is different? How big is the panic?
The first chart is the SPX daily over the last year. I have drawn the Fibonacci retracement levels from the correction in August of last year alone. Remember that one? The yen carry trade unwind (or not, depending on who you ask)
It felt pretty bad as well because it came out of nowhere. It looked like it was breaking down technically to me. I even wrote about that. However, the market did not break down. Rate cuts came & earnings carried the day
Would rate cuts help this time? I am not so sure. Right now there is a crisis of confidence among consumers & companies. Lower cost of money will help, but clarity on policy would help even more
However, what the daily chart shows us is that in spite of this correction right now, we are still well above not only the August downturn but the second wave in September. Investors who bought then are still in the money. As a result, while the correction hurts, there is no need to panic
Of course things are different from then. The US is slowing down, either by design or not, as the massive fiscal stimulus of the last several years is unwound. This brings earnings uncertainty to the fore
In addition, global investors have some new themes to chase - German industrials & Chinese tech. These countries have lagged the US for a decade. There could be much more upside in those places. This is a risk to investors wanting to buy the dip in the US
The second chart shows the chart from the Covid lows to the election highs. With this perspective, the recent move hardly registers. Even if investors got into the market half way through 2021, they are still well in the money. Again, this suggests that investors minds may still lean to buy the dip & not panic
In the midst of difficult times, it is good to get perspective. It is particularly helpful if you can really step back & focus on the longer term. Of course, that is exactly what is difficult to do in the midst of those trying times
This correction is not like August/September. Rate cuts won't be the immediate answer. There are different policies in the US and different competition for capital
That doesn't mean that all is lost. While buying the dip immediately may not be the answer, looking for the right level & the right catalyst will be

Chart of the Day - faith
Yesterday I spoke about how it is important to have perspective when going through a moment of uncertainty. I also think it is important to have faith
In financial markets, the place I look for whether investors are still showing faith is the credit markets. After all, credit investors focus entirely on the return OF capital and not the return ON capital
So, for me, if credit investors still feel confident about getting paid back, any moment of uncertainty that riskier assets are feeling, that moment of uncertainty, will eventually quell
Credit investors have shown strong faith in the market these last couple of years. After all, they have been getting paid back just fine lately
However, in Q4, we have seen some changes to this trend. The Fed reported that credit card delinquencies hit 3.08%, up significantly. VantageScore said these delinquencies hit a 5 year high
The Fed also reported auto loan delinquencies were elevated. Student loans - which had been stopped or forgiven - resumed and 4mm borrowers fell behind
CapIQ reported recently that CRE delinquencies have risen for 9 straight quarters
That said, corporate credit default rates have fallen. S&P says in December of 2025, the trailing 12 month rate was 3.5%, down from 5.1% a year ago.
In direct lending and middle markets, the default rate is about 5%
There are no red flags here. There are some yellow flags among consumers. Corporations still look fine
The chart today shows the credit spread vs. the total return performance of bonds vs. stocks. This is my default risk-on/risk-off measure. If credit spreads widen, we can see more of a risk-off phase. If credit spreads stay contained, we will be back to risk-on
Credit spreads are the way I try to determine the faith the markets have in borrowers. It is always important to have faith

Chart of the Day - support
Continuing on my theme of those things that are most important in times of uncertainty, I now turn to the notion of support
Since the Great Financial Crisis, the markets have had an almost unhealthy focus and attraction to the support from the Fed. The so-called "Fed put" had been a feature of the market before that, but was needed only when there was a meaningful risk flare
Since the GFC, any small drawdown in the market & investors are immediately asking when the Fed will cut rates to support stocks. Perhaps this is because a large pool of investors, retiring Boomers, have seen two major drawdowns in their investing timeline & can't afford a third
Perhaps it is because the Fed has truly become far more responsive to the action in the stock market. it would be naive to think the Fed doesn't watch the stock market. After all, it is one of the leading indicators of the economy
However, rate cuts on every downtick aren't a good policy algo. Yet, that seems to be the focus of the market
Since the last dot plots came out in December, when the Fed told us that the terminal Fed Funds at the end of 2025 would be just under 4%, the market has now taken that down to 3.5%
We will hear more from the FOMC next week when it updates its own dot plots, telling the market if it agrees with it and lowers the forecast or not. Whether it sees this drawdown in stocks as a reason to add more support
The chart today shows the Fed Funds future 12 months out, I call it terminal Fed Funds, vs. the earnings yield of the stock market. The earnings yield is the inverse of the P/E and is really just a measure of investor sentiment
When terminal Fed Funds falls, so does the earnings yield. Thus P/E and sentiment are rising. When the Fed Funds goes higher, sentiment goes lower, as we see the yield rising too
Stocks had gotten disconnected from this support & were too optimistic, now maybe swinging too much in the other direction
We will know soon enough if the market's sense of support from the Fed is proven correct or not
We know that in times of uncertainty, support from others is critical. This Fed meeting may be critical to the tone of markets in 2025
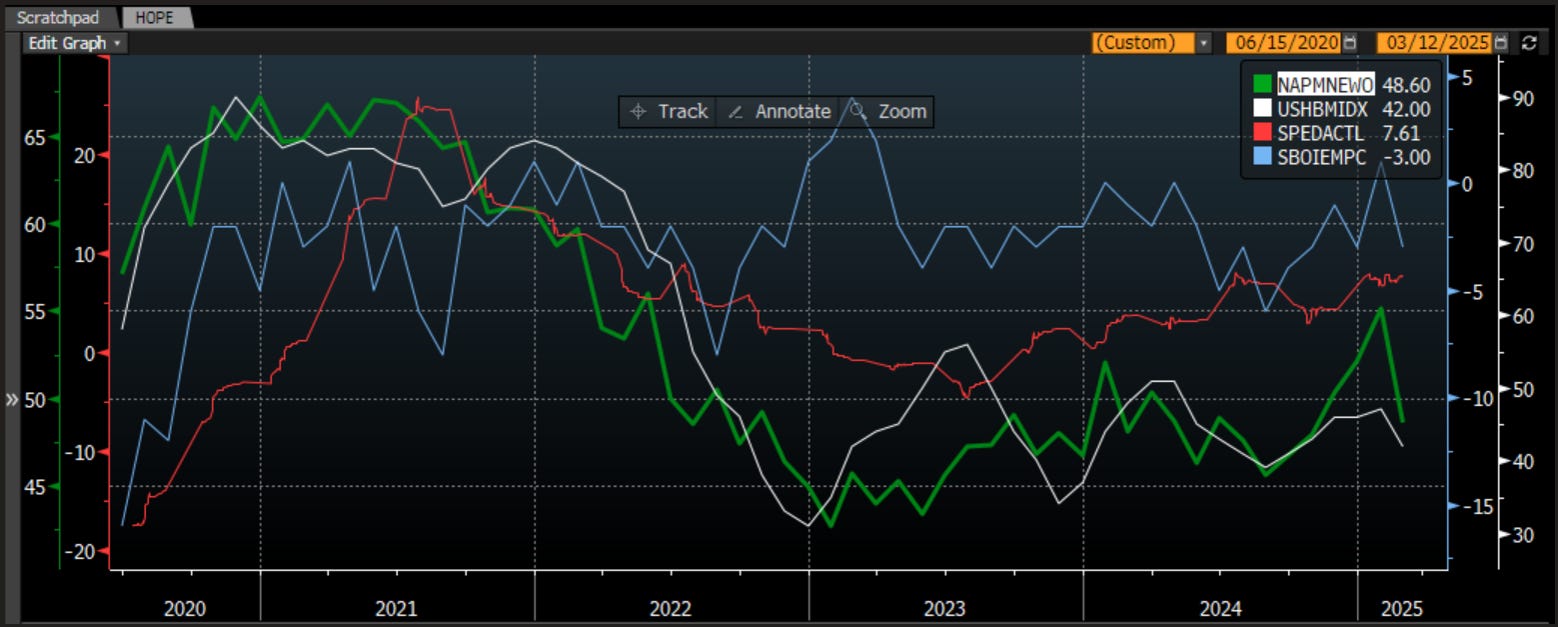
Chart of the Day - HOPE
The last chart this week in my theme of how to handle these times of uncertainty. So far I have looked at perspective, faith and support of others. Today I want to look at hope, another critical element
As my students know, I view HOPE in the fincl markets as Housing, Orders, Profits and Employment
This is the order in which money flows through the economy. We see the impacts of more liquidity first in the housing market, good or bad.
As housing intentions change, we see the new orders from business change. With orders improving, profits would improve. If orders struggle, profits struggle
Ultimately, employment is last affected. If companies are making more money, they will hire more people (eventually). If profits are struggling, employment will start to struggle
Thus, keeping an eye on HOPE is an important way to anticipate how the economy, and how the markets, will do
Housing was showing signs of optimism as we ended 2024. There was a trend from the summer of 2024 thru the end of the year which then showed new orders in the economy also ticking higher
Just recently, though, the NAHB real estate index has turned lower following a period of stalling. New orders now fell sharply in the last reading
We have yet to see the impact on profits as these indicators are faster moving and early. However, the negative impact on profits is certainly something the market is worried about right now
The last place we will see any slowdown would be employment. Within the employment landscape, small businesses will be the faster moving. We can already see falling small business optimism & small business hiring intentions
Right now, HOPE is giving us some near term pause. All may not be lost as there is volatility in these measures. However, we do want to keep a very close eye on how HOPE plays out in the important Spring housing season
Stay Vigilant!

Another good read, thanks. Takes a lot if time to write as you do - its appreciated. I enjoy how you dissect the economic state of affairs. A logical presentation of causes and effects.
I note a positive tone in your commentary today, which is a very good sign. I wish you the best outcome in handling your uncertain times. Stay vigilant, nimble and hopeful.