


This week is a combined effort. For this short of time, I have the video above. For those that do not like the video format, I have a written piece too. Something for everyone.
In the Macro Matters video above, Tony Zhang and I cover a great deal in a short time. We discuss the July FOMC meeting and how the short-term interest rate market responded to it. We consider what is priced in going forward and where investor mindsets are. From here we discuss the US dollar and what this means for asset class moves. Finally, we look at earnings that have come out and how this has impacted sector performance. From the sector performance the last 2 months, which is decidedly different than YTD, we can see that investors are changing their forecasts for what we might see over the course of the year. I encourage you to have a listen, even at 1.5x speed. I don’t want to regurgitate the information here.
Spilling over from this discussion, I had a number of LinkedIn posts this week that generated a lot of engagement. I can tell that there are some concerns on these topics and so I wanted to share them here in case you didn’t have a chance to see them.
First, I had to chime in about the Fitch downgrade of US debt. Many suggested this is not a big deal. They highlight that the S&P downgrade in 2011 has had no meaningful effect. However, we are 12 years on from that and 12 years closer to the fiscal cliff. This is what I said:
“Chart of the day - the horror ... the horror
One of my favorite movies of all time is "Apocalypse Now". It has an all-star cast including Sheen, Duvall, Ford, Fishbourne, Hopper and, of course, Brando
In the last scene with Brando he mutters the line "the horror...the horror" in reference to a speech he had given Sheen earlier in the movie about what he had seen & the right Sheen had to kill him but not judge him
This is one of those lines that many were essentially quoting as they referred Fitch judging the US in a downgrade from AAA to AA+. On one side of the aisle, the words were muttered blaming the administration. On the other side, they were muttered blaming Fitch for this reckless behavior
Fitch is meant to be objective after all. In the chart today I try to look at a couple of things referenced in the report & a couple of mkt metrics. 2 things referenced were the amount of federal debt as a % of GDP & the rising fiscal deficit
The debt to GDP is in orange. We can see that post GFC it rose above 100% (1 on this chart) as the govt took on the debt from companies & consumers. Then it spiked to 130% post Covid. It is back to 120% but starting to rise again
Projections I have seen suggest this will be 150% in the next decade & continue to rise to 200% of GDP by 2053. Reinhart & Rogoff in their study found that country crises occurred whenever this number went above 100%. Critics point out Japan is over 200%. We don't know how bad this is but it isn't good
The white line is the federal deficit to GDP that Fitch pointed out. This Bloomberg series comes in at 8.5% above where Congressional Budget Office has it at 6.5%. However, the CBO sees it rising over the next decade to 9% as Social Security & Medicare really grow. This line is going higher
Does the mkt care or notice? I have included 2 other lines. In purple is the spread between US Bonds & German Bunds. I didn't want to just use US ylds because there is noise from other factors going on. I wanted to compare to a country that is considered more fiscally prudent
The blue line is gold in USD. Again, I didn't want to compare fiat to fiat because many countries are facing the same issues. Looking at gold (or bitcoin if you prefer) is the way to see if investors are losing faith in fiat writ large
You can see that in this period where the US debt to GDP has grown, the spread of Treasury to bunds has slowly widened. You also see a gradual strength of gold here, though negative real rates in the US helped that too
The vertical lines I have drawn were the S&P rating downgrade in 2011 and the Fitch downgrade now. Since the S&P downgrade, the spread of US to Germany has widened from zero to 150 bps. Is this set to continue? Will gold peak like it did in 2011?
It is easy to suggest this is a non-event. Yet, the problems referenced are not getting better any time soon. So maybe, Col Kurtz was right. Maybe we are seeing "the horror""

Building on this, I think that other asset classes will be affected to. If US yields move higher, what does this mean for corporate credit, and for stocks. I wrote about this the next day on LinkedIn:
“Chart of the Day - caveat emptor
Caveat emptor is a Latin phrase that translates to "let the buyer beware." It means that an individual buys at their own risk. Potential buyers are warned by the phrase to do their research & ask pointed questions of the seller, who is not responsible for any problems the buyer may encounter
It is akin to buying a house or a car "as is". The price may be a little better, but simply seeing that label, you know there are problems with it, you just don't know how many & which ones
Yesterday, as yields rose on the Fitch downgrade, & stocks sold off due to higher yields & stronger economic data, I asked friends what they were seeing. People looking to buy the dip was the most common response
Too many people have been burned trying to fade this mkt that no one wants to miss out on this move lower in prices. Buy the dip ahead of the Q4 rally. Buy the dip even if the stocks are being sold 'as is'
The chart today shows 4 things: US 10 yr ylds in orange (inverted), Moody's corporate Baa ylds in purple (inverted), NDX fwd P/E in white & SPX fwd P/E in blue. I show this for the entire post GFC period when the central banks have been very active in the mkts
We can see immediately post GFC, the first moves were lower in ylds. The central bank trying to push investors out the risk curve. Short rates were lowered then QE & twist came in to lower 10yr ylds. Corp bond ylds followed most quickly as it is a spread product. Eventually stocks followed suit
Now, we have the opposite at play. Central banks are raising rates & doing QT in an attempt to bring investors back in from the risk curve. Investors don't know this game though. They only know how to add risk when the central bank pushes them to
Thus, when the think the central bank is finished with rates & QT, they immediately rush out the risk curve thinking the central bank will again lower rates in the not to distant future. Jay Powell has taken pains to tell us that won't happen any time soon
So we now have a situation where 10yr yields are moving higher, some in the Fed control, & some isn't. We have QT going on & also a large amount of Treasury issuance. Now we have a Fitch downgrade at the time when many countries are questioning whether they want so many dollar reserves
As 10yr ylds move higher, corporate bond ylds are as well since it is a spread product. Spreads are tight as even corp bond traders don't believe it
Equities are most disconnected though & the NDX is more so than anything else. AI is changing the world after all. This is fine but this relationship suggests AI will need to change earnings & not just the HOPE for earnings
For those stepping in on the first dip yesterday, I would just caution 'caveat emptor'. Ask the seller some questions. Do some homework. You know there are problems (valuation). You just want to make sure there aren't problems you aren't aware of”

Finally, this all hinges on what happens to 10 year yields. There is a large contingent of macro traders, who primarily come from fixed income backgrounds, that see the bull market in 10 year yields beginning again. Too much debt, which Fitch clearly mentions, will slow potential growth in their minds. In addition, we have a demographic shift to retiring Baby Boomers, who will no longer be spending as they have their entire lives. Finally, technology disruption like AI, will continue to increase productivity and drive down prices. The example given is how fast CPI is falling now. This very much may occur. I can see the logic. However, we are also moving more toward a tipping point in US deficits.
The US deficit is $32 trillion and 120% of GDP. Over the next 75 years, the Treasury sees the deficit growing by $80 trillion or 2.5x GDP. 95% of this growth will come from entitlement spending, with 2/3 of that from Medicare and 1/3 from Social Security (https://fiscal.treasury.gov/reports-statements/financial-report/unsustainable-fiscal-path.html#:~:text=The%2075%2Dyear%20fiscal%20gap,to%206.2%20percent%20for%202021).
Entitlement reform is absolutely necessary, however, neither party has any desire to take this on. In fact, not touching entitlements was the first thing Biden & McCarthy agreed to in the recent budget impasse. Thing is, we can’t kick this can down the road anymore, or if we try, bad things happen. This is what Fitch is telling us. Thus, shouldn’t we perhaps consider a scenario where yields head higher? I discussed this on LinkedIn this week:
“Chart of the Day - 10 year yields
Picking up where I left off on the 10 year yields, it seems as if we might want to consider a scenario where these yields go much higher & stay there for some time. Just using some simple channel & support/resistance analysis, it is not impossible to see 5.43% in the next year
I know this flies counter to the prevailing wisdom that the combination of demographics, debt and (technology) disruption are going to lead to yields heading much lower. That has been the response the last 40 yrs & so fixed income traders are pre-set to respond this way
However, consider this. The initial steady fall in yields first stopped in 2012 when the debt to gdp initially went above 100%. Both flat-lined for a few years. Then when the debt to gdp took another step higher in 2016 we got the first break out from the channel
Covid came in and took us to new lows in yields. However, the bottom in yields in 2020 coincided with the big step higher in debt to gdp from 1.05 to 1.35%. As this pulled back to 1.2%, yields again consolidated
However, with the spending in DC now (Inflation Reduction Act, student loans et al) it is moving higher again. Yields are also moving higher
This is also at a time when foreign buyers may not be as willing to step in. For the BRICS countries, perhaps there are more geopolitical reasons. For Japanese buyers, it may be because they can start to get yields at home that are more favorable on a hedged basis
This means retiring Boomers will have to step in. We have seen this at the front end of the curve where risk-free rates above 5% are enticing. Is this what they will demand further out?
Also consider the govt impulse here. How does one with to much debt get rid of it? There are three ways - restructure, default, inflate away. There is no political appetite to do either of the first two. Thus, the default position is to inflate it away. Interest costs are currently 14% of the debt but perhaps going higher
Jay Powell doesn't like to hear this. He is fighting that. However, both parties seem more than willing to spend & inflate the problem away. The response we hear from DC? Not a problem as long as wages keep up.
The Unions response? Ask for higher wages, much higher wages. The response from companies that aren't unionized, like investment banks & tech? Fire workers because they know they will cost more
The 10yr yield is the linchpin for the valuation of all assets - equities, commodity curves, corporate bonds. Higher yields will mean the M&A mkt comes grinding to a halt. Higher yields means the NPV of every project looks less appealing
I know the pushback. Demographics, debt & disruption will lead to lower yields. However, as technical analysts say, 'prices don't lie, they inform' Right now prices are informing us to consider a scenario where rates are higher for longer”

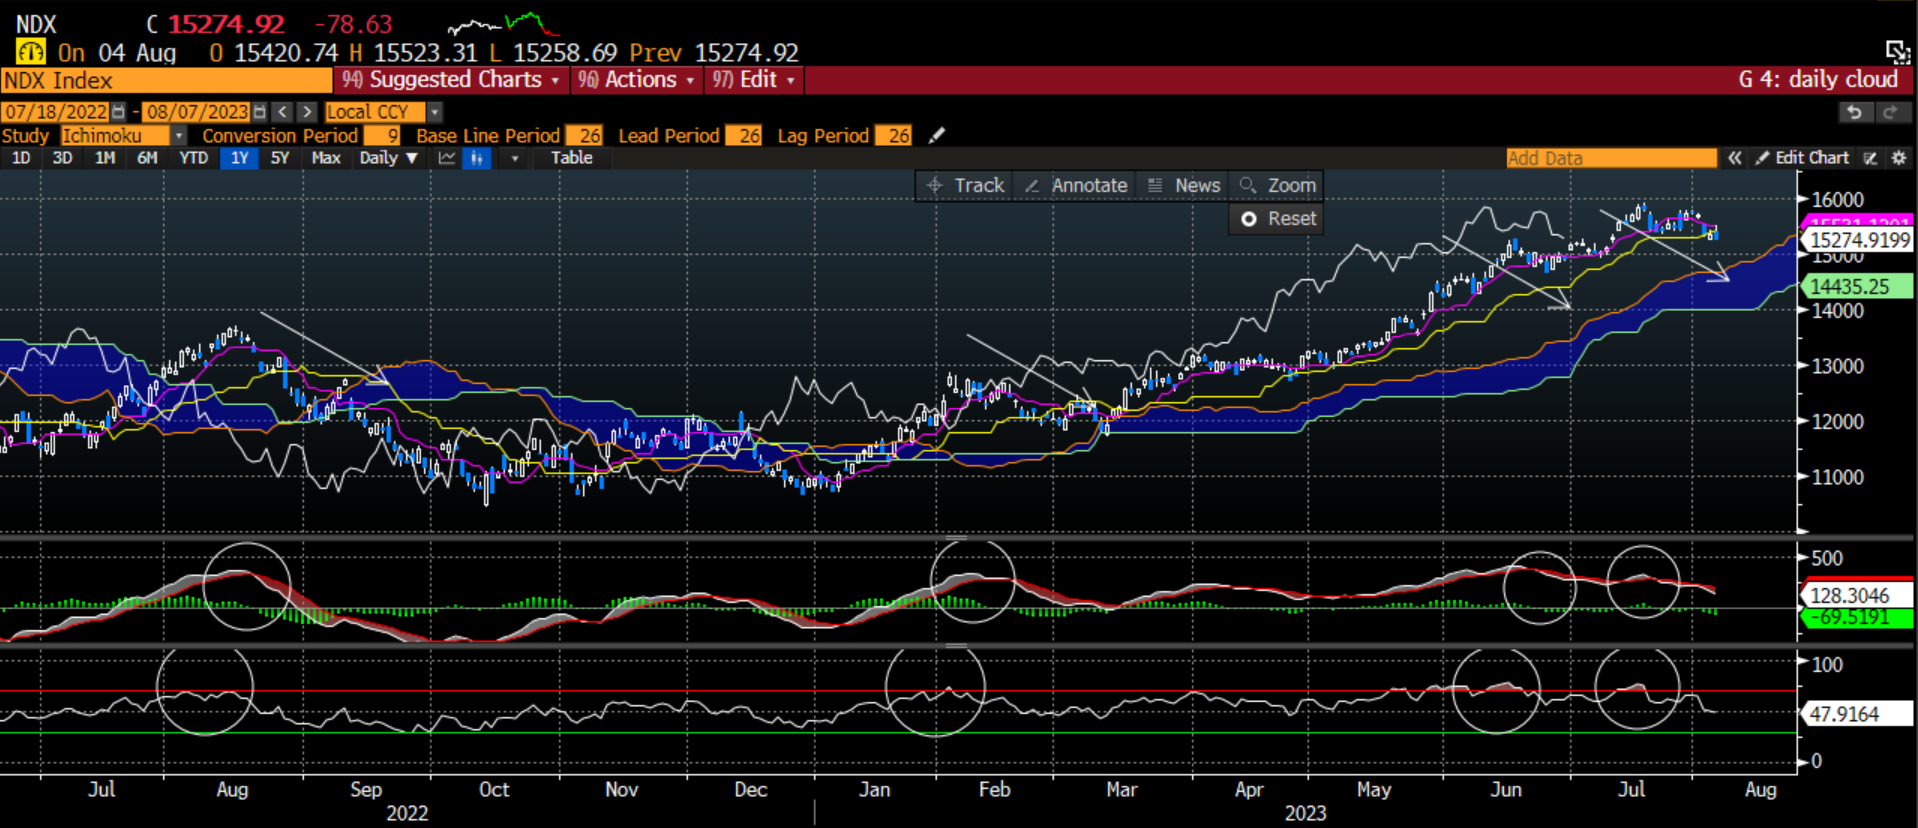
The linchpins of the market are showing signs of wobbling here. Finally we are seeing some ever-so-small pullback in risk-taking. Realistically, without further information, one would probably only expect this pullback to hit 14,500-15000 in the NDX and 4300 in the SPX. As we discussed last week, right now there is simply no new worries that will get people out of the expectation of a Q4 rally.
I have thought about the following myself and discussed it with market veterans who were around. Today, I saw it on Twitter from Michael Gayed:
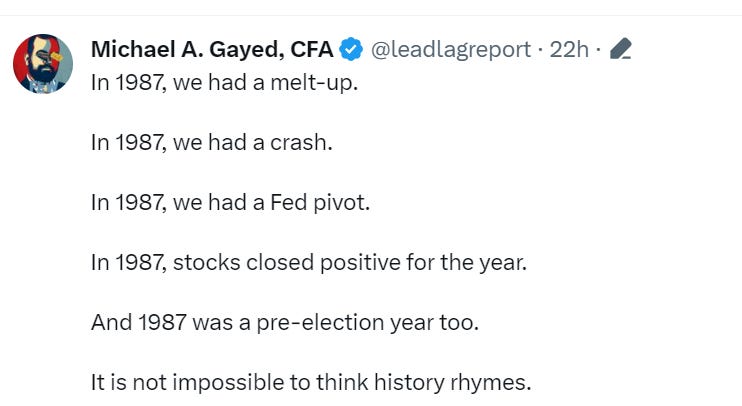
Could that happen again? Sure. It isn’t my base case, but the analog is certainly worth considering as one scenario. You can see the overlay below. I would add a couple of things to Gayed’s tweet. First, market microstructure was weakened, but we did not know it yet, from portfolio insurance and systematic hedging. In 2023, market microstructure is also weakened by 0 day to expiry options and passive funds being 50% of the US market. This means on a major sell-off, there is may not only be no bid for the market, but there may be forced selling.

There is some hope that we are seeing a bottoming of the economy. ISM manufacturing and services were both weaker than expected but are showing some signs of a bottom. We also got Chicago PMI this week, which was also weaker than expected but the pace of fall is slowing. If we look at the New Orders and New orders to Inventory, there is hope we have seen the lows in the economy.

However, I am still feeling this is more of the 2000 redux than the immaculate disinflation and no landing. Time will tell.
We all seem to be forgetting that Fed policy acts with a lag. The lag is 12-18 months. You know where we are in the hiking cycle? About 16 months. Thus, we should start seeing meaningful effects this Fall. The next couple of charts come from Nancy Lazar and I think they are beautiful in their simplicity. The first is the willingness to make loans at banks which leads actual bank loans by 6 months. It takes a while for numbers to be affected because there are loans in the approval pipeline. We are about to see this drop off a cliff.

I know many think the shadow banking market will step in. I had meetings with private credit/direct lending firms this week. I know how hot this area is. However, this capital is very transaction specific (real estate) or deal specific (private equity, roll-ups and the like). We do not see, yet, companies going to these private markets to fund their regular growth and capex. Banks are still needed for this and the money will be both more expensive and harder to come by. This is why, in 55 years of data, we see that when banks are less willing to lend out money, US domestic revenues fall. As this willingness is plummeting, and leads by 2 quarters, we should expect the same on revenues going forward.

Yet, as we look at what we are seeing versus what is expected, there is still a hockey stick in growth of sales and earnings expected, even though on yoy terms, we are seeing no growth in sales and -8% earnings growth. In the lower left you can see this is expected to change going forward.

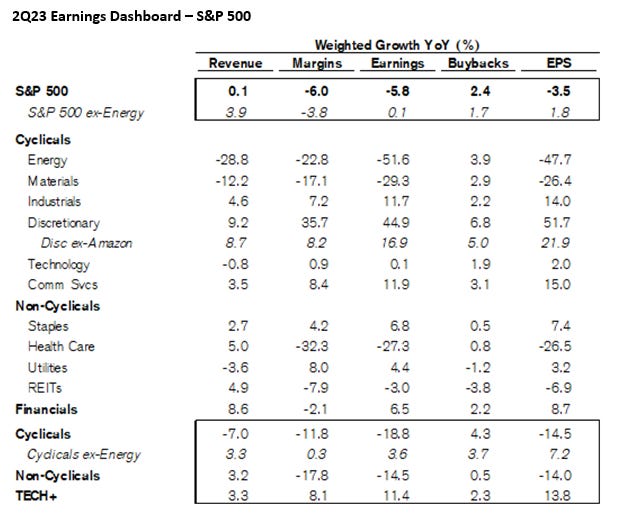
Finally, I want to give the last earnings update courtesy of Jonanthan Golub at CS.
Despite strong earnings surprises, price action following results have been relatively muted. More specifically, companies beating on both revenues and EPS are outperforming the market by 1.0% vs. an average of 1.7%, while ones missing on both are underperforming by -2.8% vs. -3.1%.

84.0% of the S&P 500's market cap has reported. 2Q expectations are for revenues to grow +0.1% and EPS to decline -3.5%. EPS is forecasted to grow 13.8% and 8.7% in TECH+ and Financials, but fall -14.5% and -14.0% in Cyclicals and Non-Cyclicals.
Earnings are beating estimates by 7.2%, with 75% of companies topping projections. EPS is on pace for -2.3%, assuming the current beat rate of 7.2% for the rest of this season.
Value is delivering stronger revenue and EPS growth (+2.2% and +4.3%) vs. Growth (-3.2% and -14.0%). Value results are beating expectations by 8.7% vs. 5.5% for Growth.
While the U.S. is projected to deliver higher revenue growth vs. EAFE (+0.1% vs. -1.0%), EAFE is forecasted to outpace U.S. on EPS growth (+2.6% vs. -3.5%). Additionally, EAFE results are topping consensus by 11.9% vs. 7.2% for the U.S.
More globally-oriented S&P 500 companies are experiencing a greater decline in EPS growth than their more domestically-oriented peers: -9.8% vs. -3.2%.
Next week, 33 companies representing 3.0% of S&P 500’s market cap will report results, including Eli Lilly, Disney, UPS, Zoetis, and Ilumina.
Whether it is the Fed, the economy or earnings, there is still a good deal of hope that things will improve very shortly. There are a number of data points that suggest otherwise. However, at this point, bears have been thoroughly debunked and so no one is paying attention. This is very similar to 1987. I am not saying that will be the case. As I say above, if anything this pullback looks like it will be very modest.
However, we should consider scenarios where yields move higher, the Fed is not finished, the economy and earnings are worse than expected. If in those scenarios you still can find a margin of safety in your investment, then make it. If not, you might want to consider how you implement your ideas.
Stay Vigilant


Share this post