USA! USA?
With the start of the Olympics, are eyes looking at the US or the rest of the world?


It is that time in the cycle when we have Olympic Games to watch. For those of us in colder climates, the winter Olympics can help break the monotony of the cold weather and lack of sunlight. Given the groundhog just told us we have 6 more weeks of winter, it is a welcome respite.
I think we are a long way, at least in the US, from where we were in 1980 when the US men’s Olympic hockey team had the “Miracle on Ice”, starting the chants of USA! USA! These chants still come out at some events, notably the Ryder Cup which I like to attend. However, the Olympics don’t seem to garner the same patriotic enthusiasm.
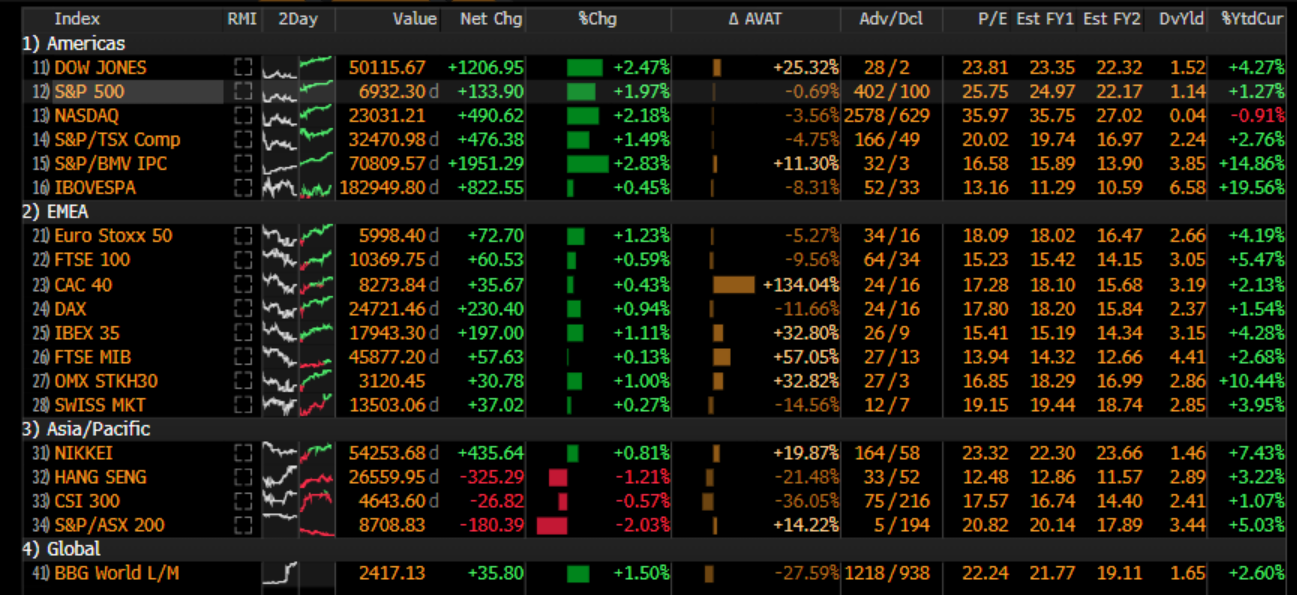
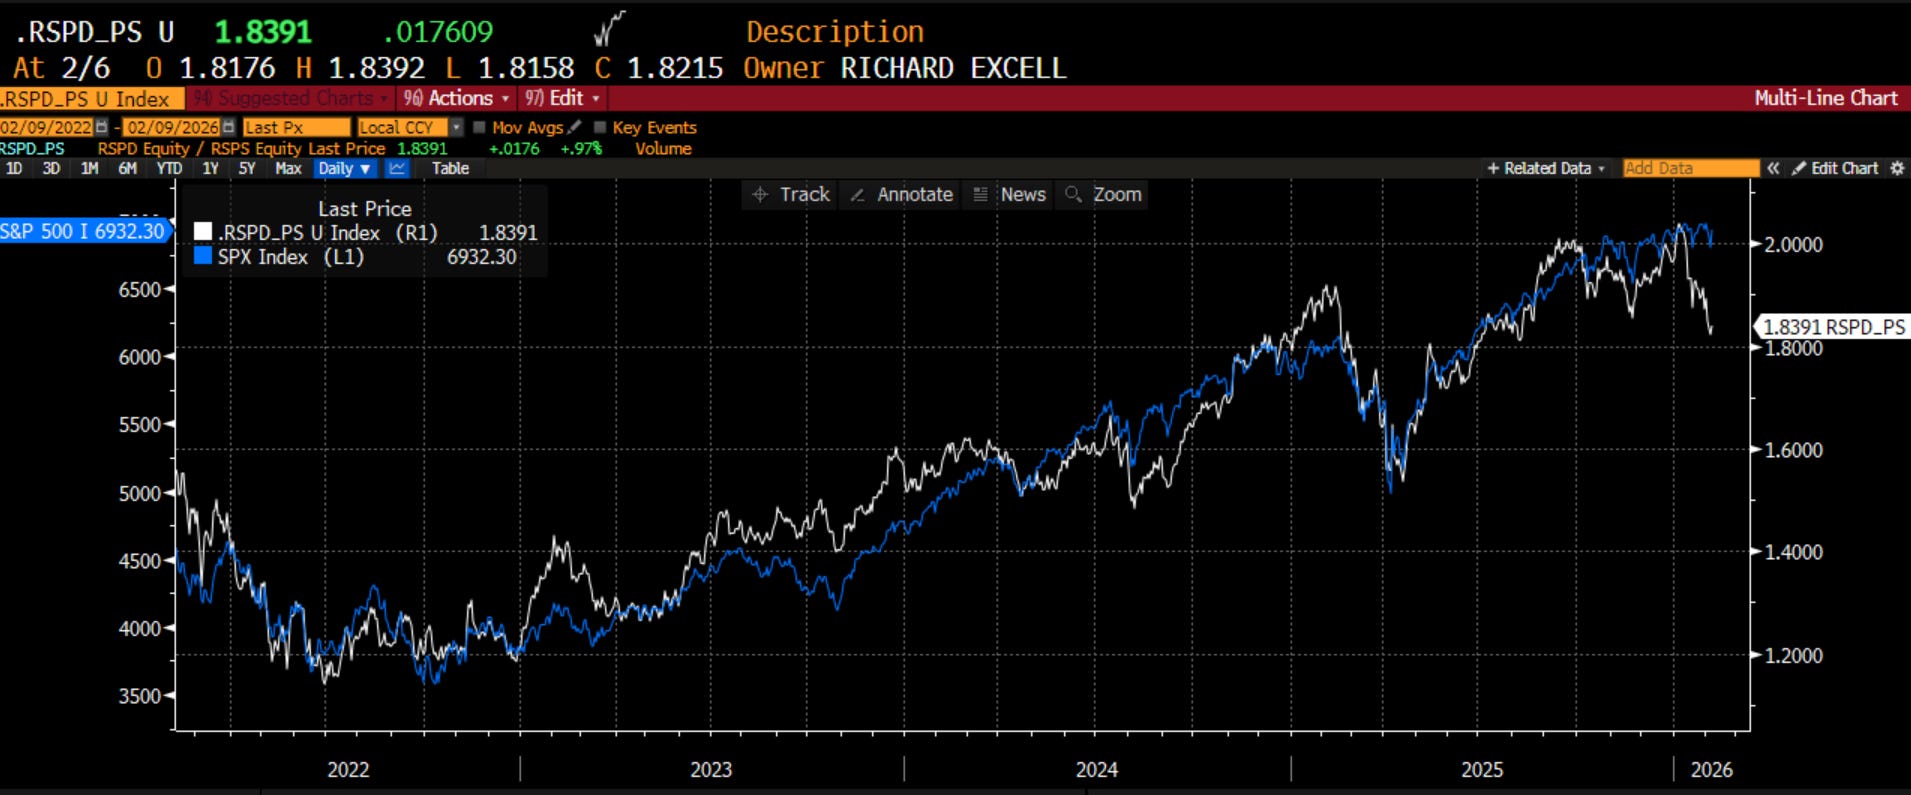
That lack of excitement for the USA appears to be making its way into the financial market too. You likely know that I have been favoring stocks outside the US since the middle of last year, and the trend certainly is growing. After lagging the rest of the world in common currency terms by at least 1000 basis points (and in some case 2000 basis points), the broad US stock market is off to another tough start on a relative basis, particularly if you are overweight the Nasdaq:
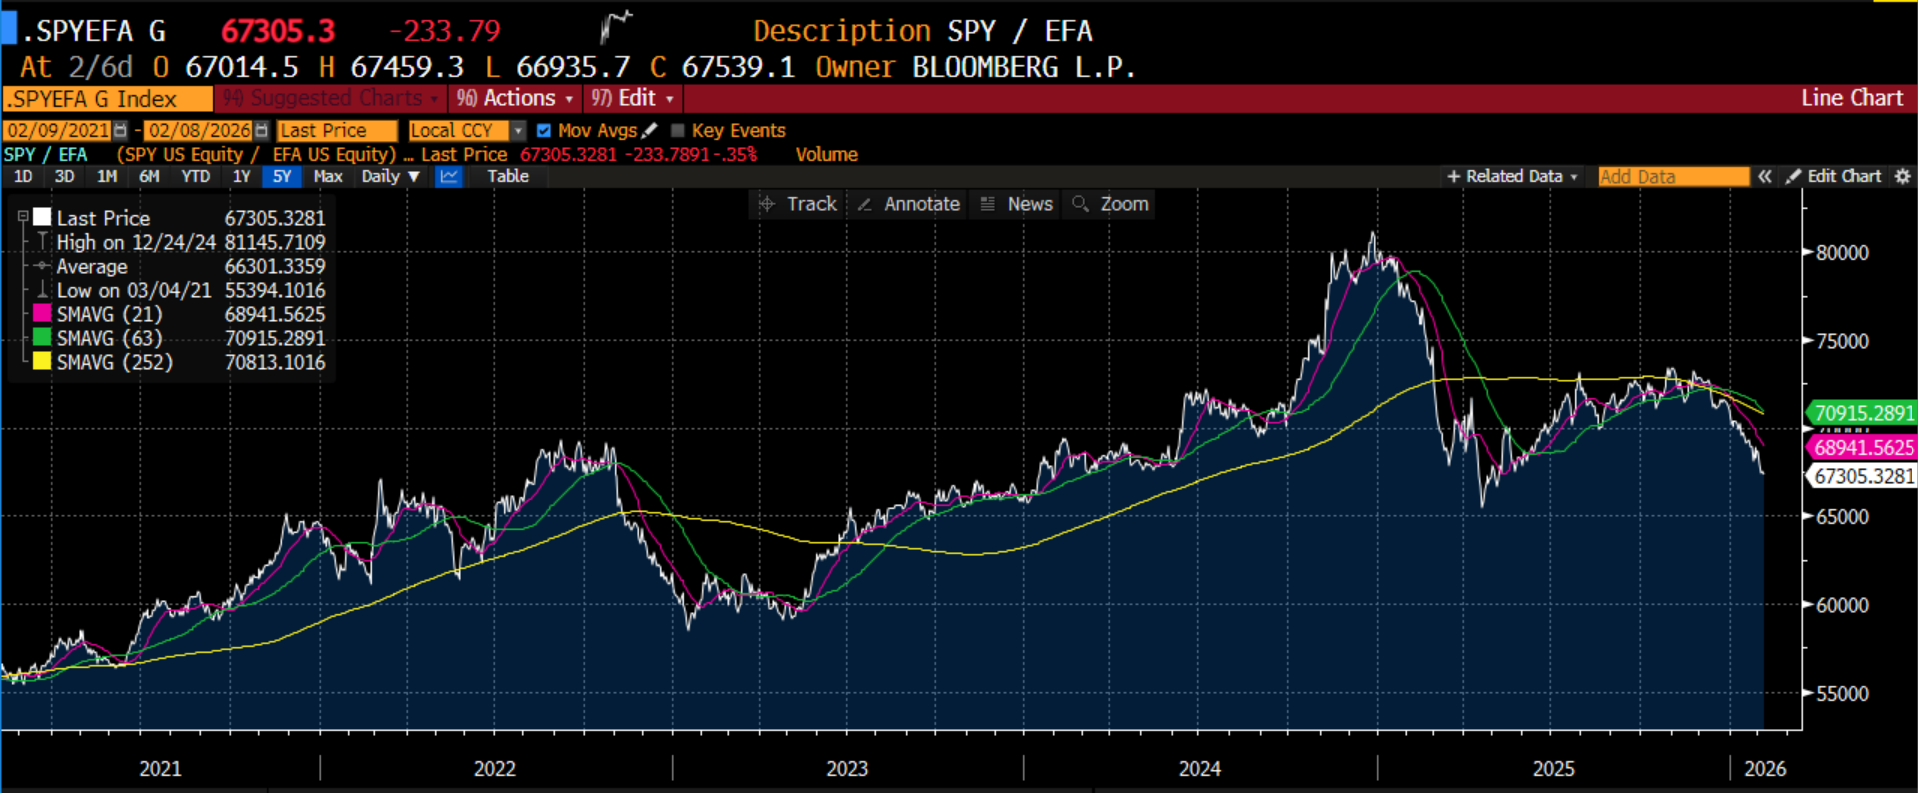
In fact, if we look at the relative price of SPY vs. EFA, which is the rest of the developed world, we see price action that we would likely sell if it was an individual stock. During the Liberation Day meltdown in Q1 of 2025, SPY broke below the 200 day moving average. It then bounced back over the summer but has tried several times to break through that moving average resistance and has now failed, giving way to a relative move to the downside. Not drawn, but if you prefer trendlines, the line from the 2023 relative low through the 2025 relative low has also given way targeting a return to that 2023 low in simple terms.
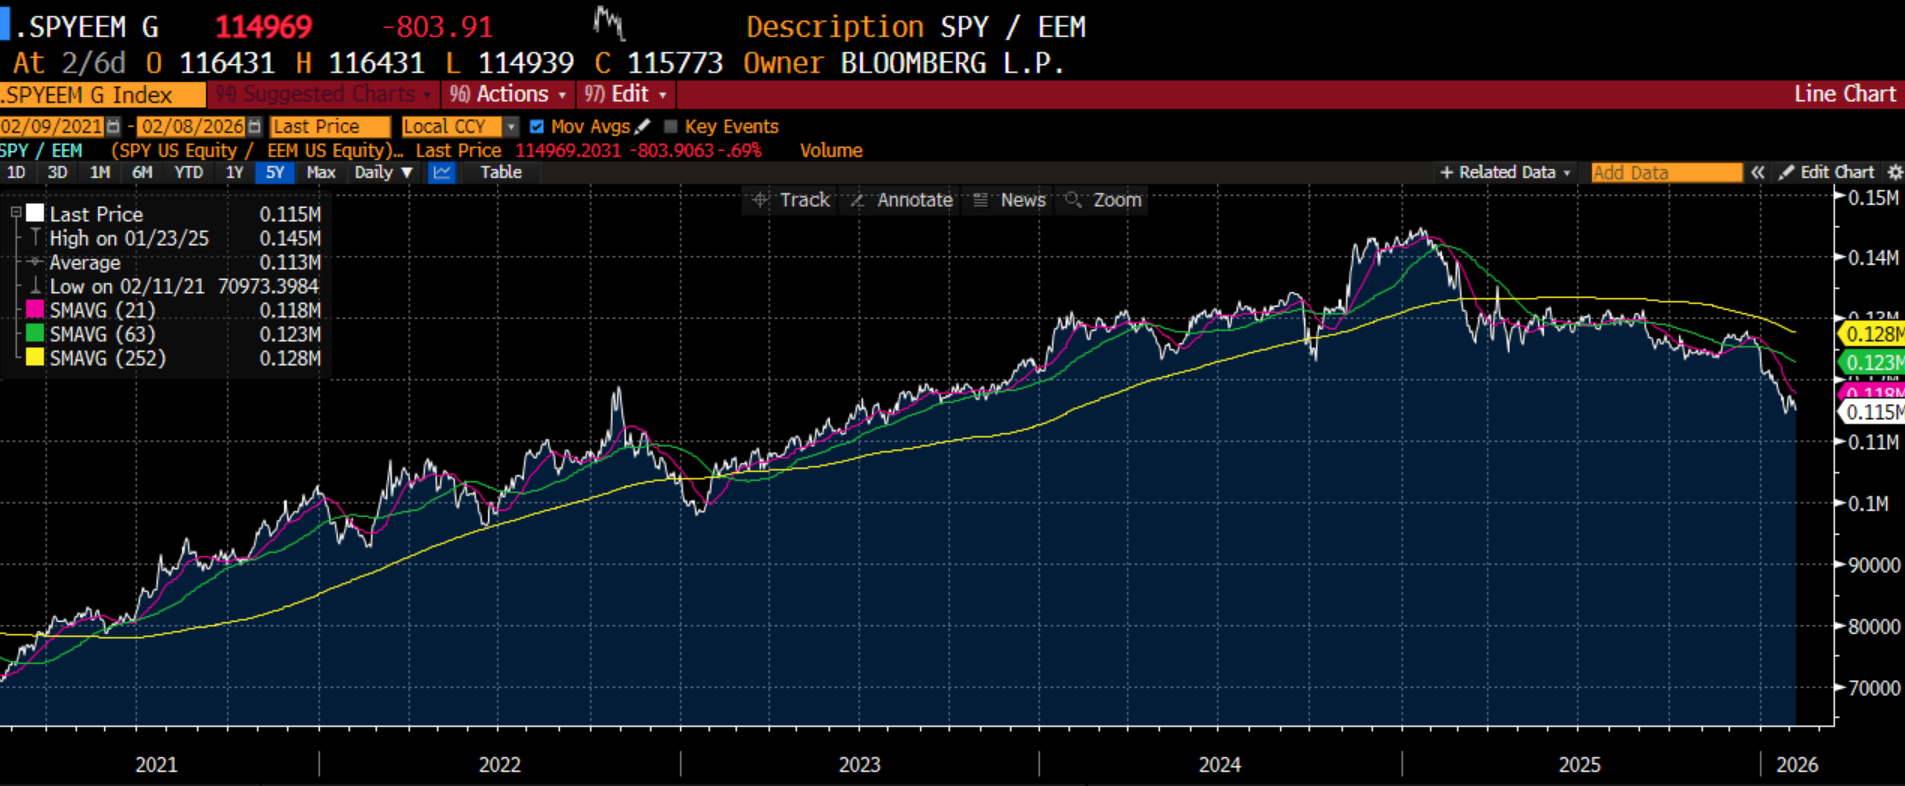
The picture may be even more clear for the SPY vs. EEM, the MSCI emerging markets index. Relative prices never even got back to the 1 year moving average after breaking last Spring. It appears we may be in a period of relative decline for the US vs. the rest of the world, developed or emerging.
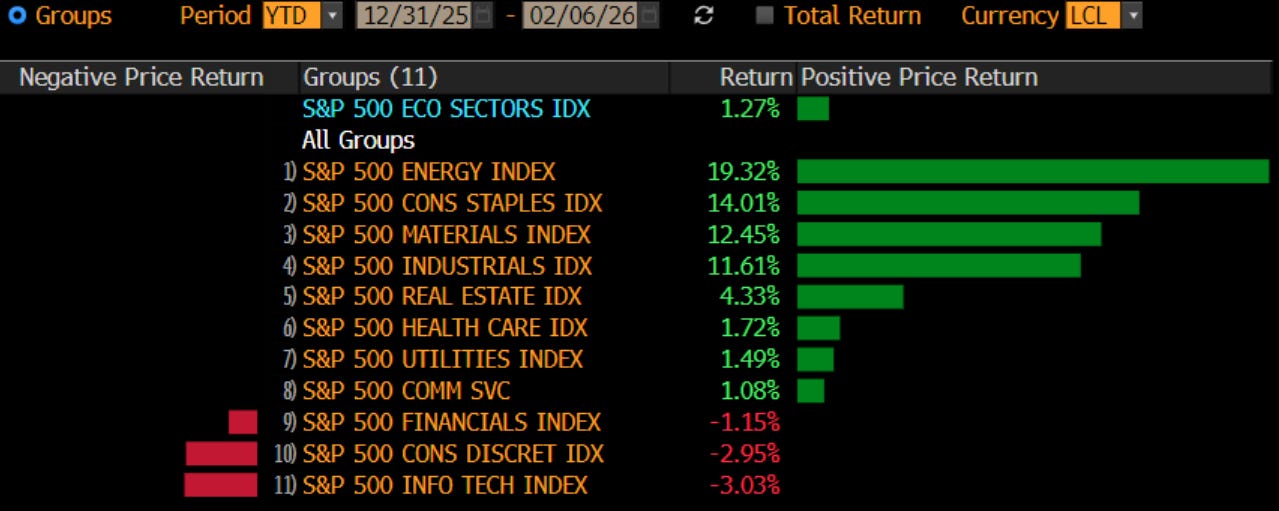
As always, the real action in markets happens beneath the surface and not in the headline indexes. In another clear sign of changing investor preference and rotation of assets, investors have materially shifted focus out of Technology and into Energy, Materials and Industrials. With the news from Alphabet and Amazon about hundreds of billions in data center capex, investors are showing a preference for the picks-and-shovels vs. those that have to pay the bills.
You may also see massive outperformance of Consumer Staples vs. Consumer Discretionary. While AMZN is a very big part of the Discretionary lag, there also appears to be a growing view that the consumer is going to bunker down with Expedia, Booking.com, Las Vegas Sands and DoorDash the big losers and Bunge, Lamb Weston, Hershey and Colgate the big winners. Eating at home and not spending frivolously is that theme. I was tipped to a good short-term indicator of the market (hat tip MN) which comes from Walter Murphy via David Rosenberg. It is the equal-weight Discretionary vs. Staples that leads the market with an 85% correlation. It is pointing to more near term downside risk for what it is worth:
However, while that is some near-term tactical risk, I think the bigger idea here is that the market is focusing on the bigger picture of what the next several years and the AI theme really mean. All of the focus has been on NVDA as the potential gating mechanism, but with other companies and other countries working on their own approach via different chips and different processes, the real gating mechanism may well be the power to run these energy hogs. The “All-In” podcast this past week discussed this and said there are a few approaches being taken. The first is Elon Musk deciding that space is the place to get the cheapest energy and solve this problem via data centers in space. There are many naysayers but if anyone can do this, it is Elon Musk and the merger between SpaceX and XAi being the signal. He says in 30 months it will happen. The rest are choosing an approach that includes behind the meter, self-powering (SMRs?) and energy efficiency. The quote when I logged into Bloomberg today says it all. Standard of living has always been about cheap power and in an electrified world, this is even more the case:

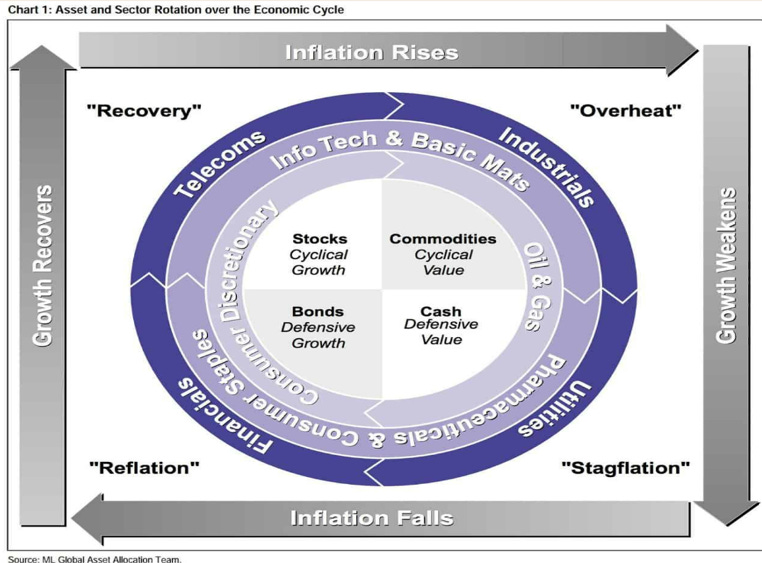
The business cycle investing approach would also look at the price action we have seen in the US this year and suggest the market is of the opinion we are in the “Overheat” phase of the cycle, where growth is heading higher and inflation is also still rising. Commodites and cyclical value are the clear winners in 2026. This view on both growth and inflation will get some catalysts this week with both the non-farm payroll and CPI reports being released:
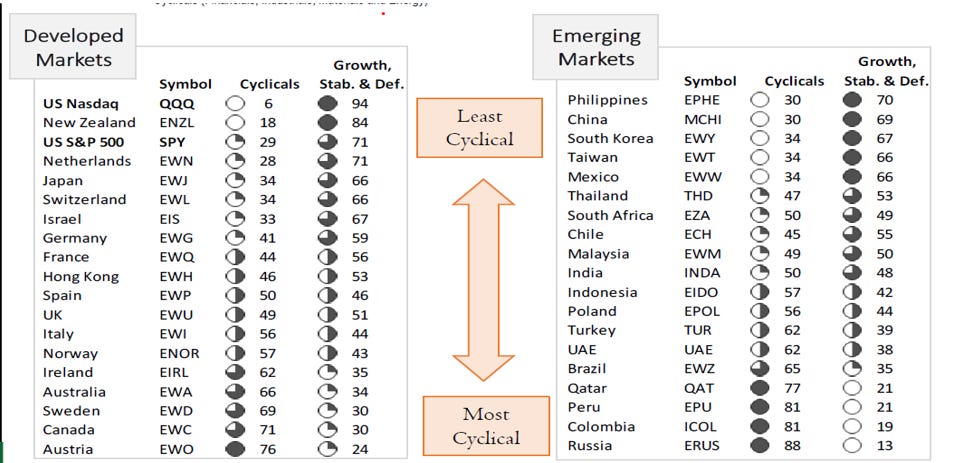
Believe it or not, the US is considered “defensive” versus the rest of the world. This may be hard to believe with US stocks prices hitting all-time highs but the cyclicality of the US markets is among the lowest in the world. This is particularly the case with the Nasdaq, the US market doing the worst. The most cyclical markets? Emerging markets which are clearly besting the US. These indexes are heavily composed of names in the basic resources sector and so it makes sense. So not only do we see a rotation within sectors in the US that suggests “Overheat” and higher growth, but the move from the US into other countries is screaming the same thing. This chart comes courtesy of PiperSandler:
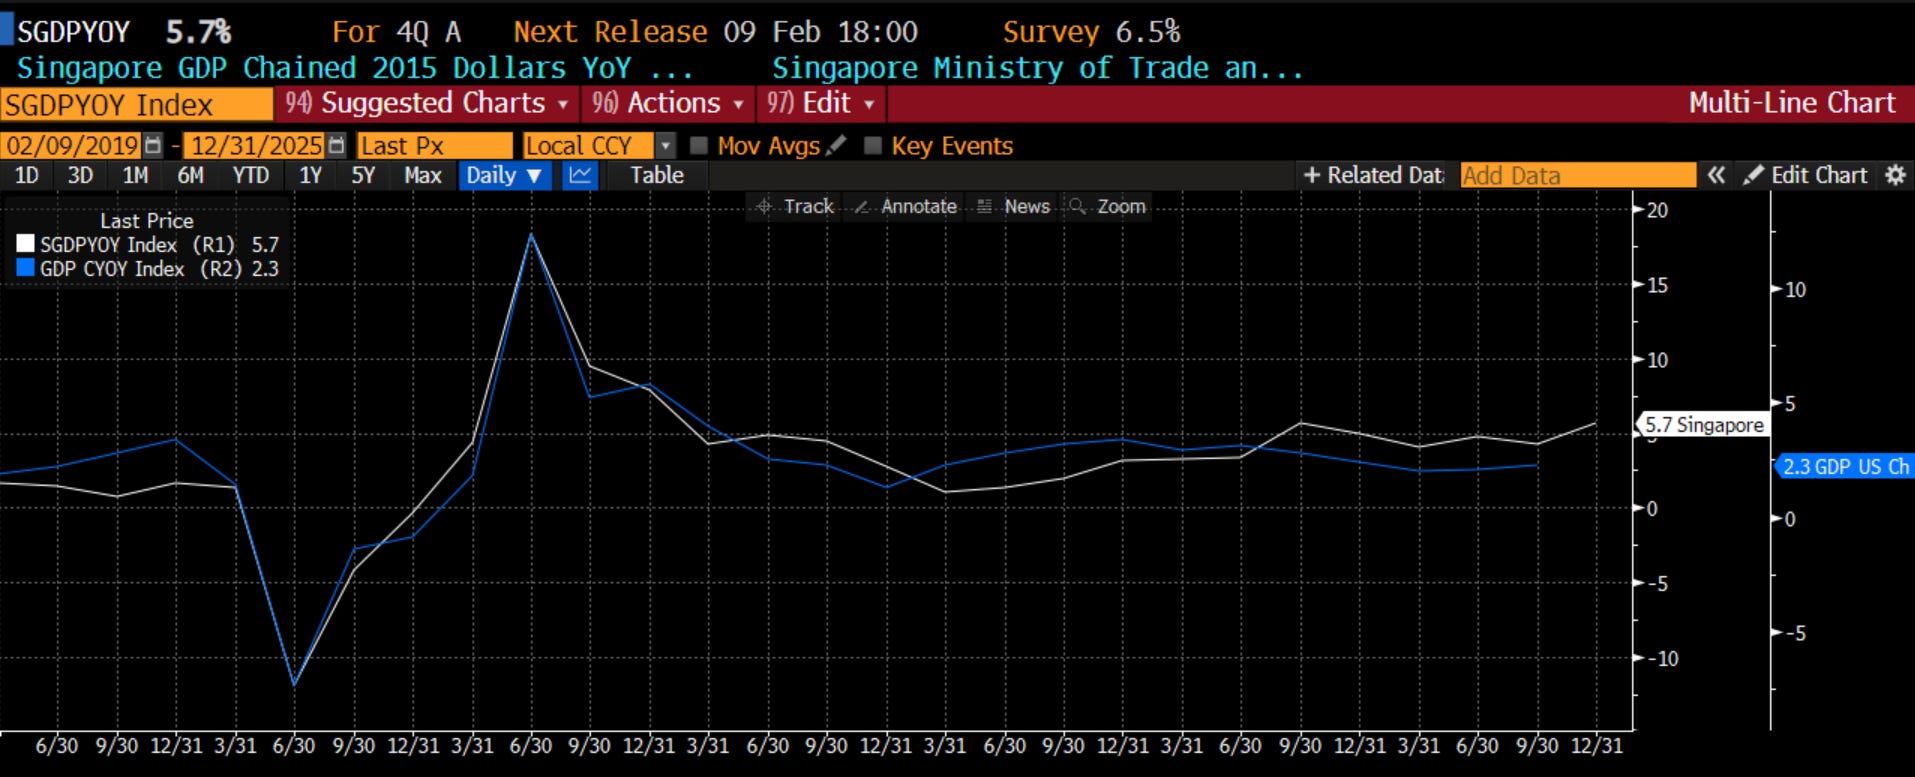
Is global growth really that good? One place I like to look is Singapore as a leading indicator. I had the good fortune of living in Singapore for 7 years, and besides the fact I loved it there, I learned very quickly that Singapore is heavily influenced by global growth. Shipping, energy, technology, finance are all major industries in the country as the nexus for all global activity. The Singapore GDP leads the US GDP as we see below. We will get an update on the Singapore GDP this week and I will be watching intently. Right now, it is signaling full steam ahead for global growth:
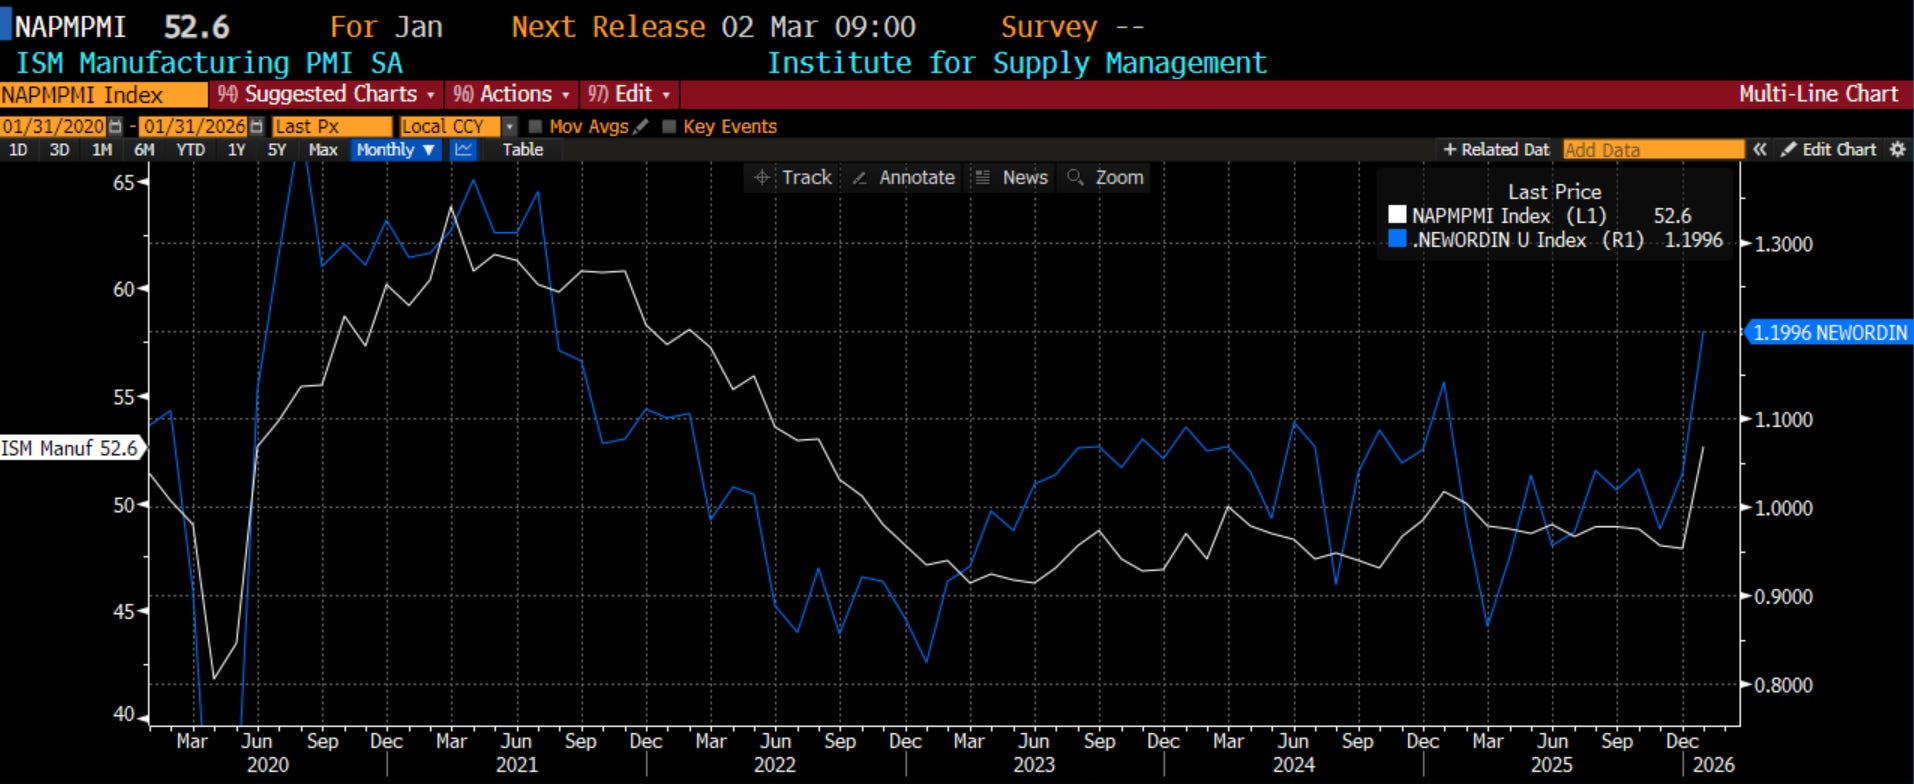
Turning back to the US, we got very positive news on US growth prospects this past week as well. The ISM report came out much better than expected on Monday, moving above 50 and telling PM’s it is time to move into growth sectors. Even more importantly in my mind, the ratio of New Orders to Inventories within the report (the real action always takes place in the internals not the headlines), which leads the headline, suggests we should continue to see strong US growth going forward:
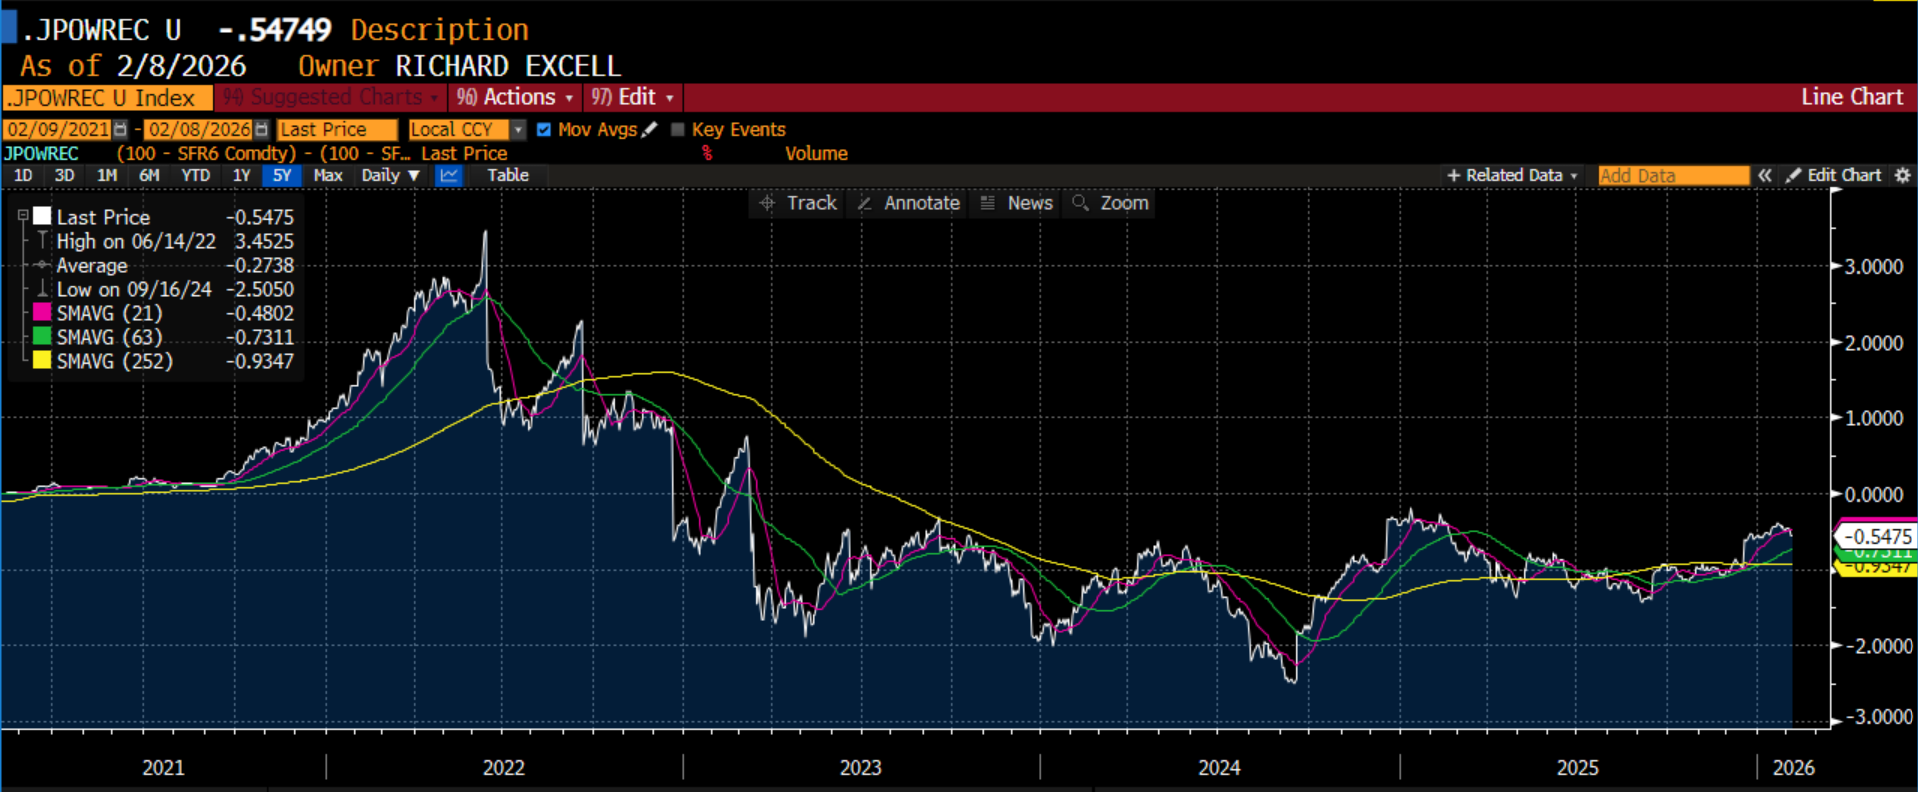
Does the Fed know this? I think a lot of what we are seeing is the lagged effect of rate cuts over the past 18 months. This is likely why the FOMC stayed put, not for political reasons as many suggest. In fact, if we look at the Jay Powell recession indicator which he told us about a few years ago, it is still not back to positive territory but it is trending in the right direction:
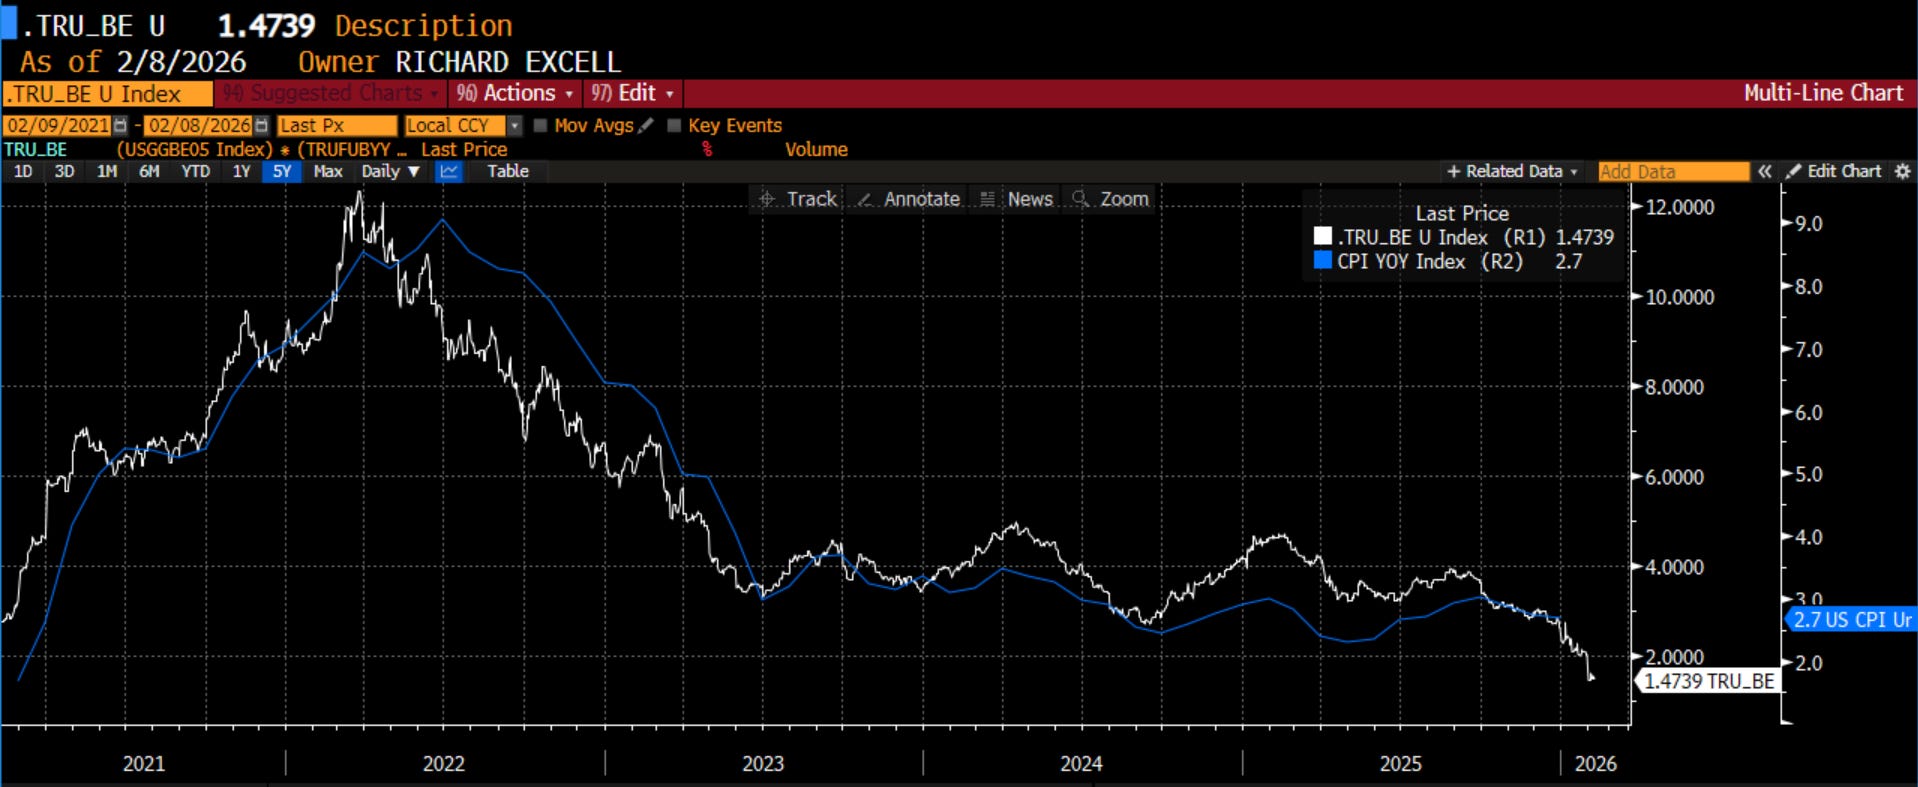
The market is focused more on falling inflation as the rationale for more rate cuts. I have seen more mentions of TruFlation in the past 2 weeks than I ever have. I showed before the US inflation breakeven market (perhaps more focused on commodities) is giving a different sign. This week, I decided to combine both TruFlation and 5-year Breakevens into a single indicator and it does lead CPI. The US market is focused on this falling CPI narrative which is important from an investment clock perspective. If we move back to the upper left from the upper right, where we have growth but no inflation, technology will be back in favor especially in regard to Industrials. This week, the rubber hits the road on inflation:
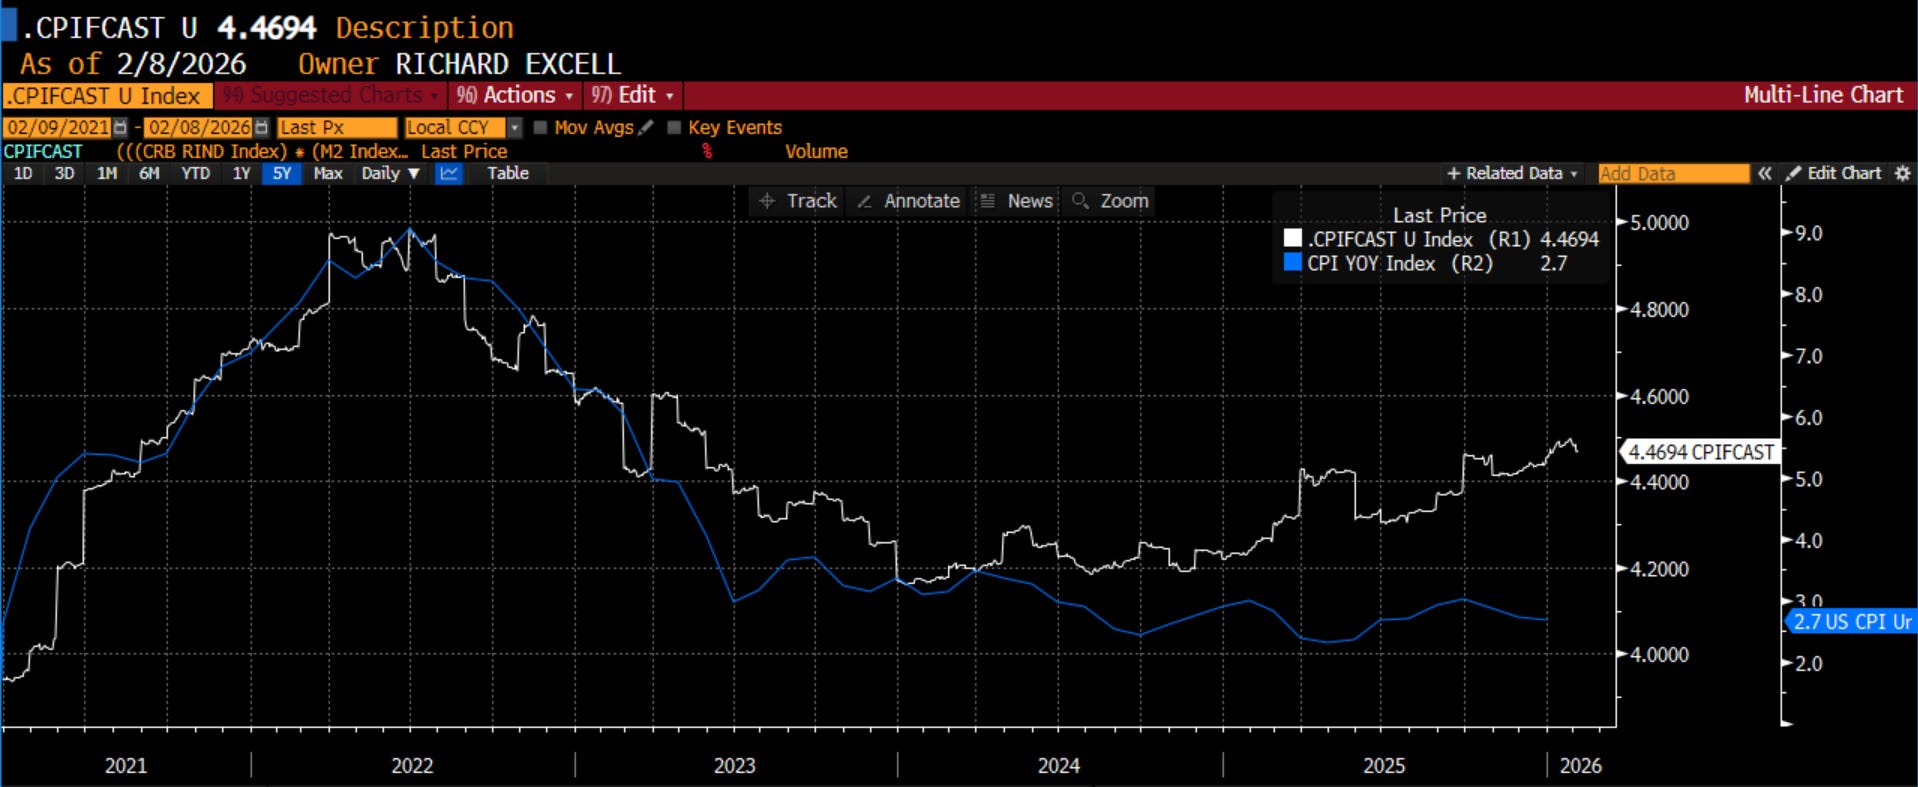
My other inflation forecast index, which combines commodity prices, money supply, breakevens and PPI, is still saying CPI is higher. While I am coming around to the notion of the disinflationary aspects of AI, I still fear a 1960s/70s repeat where we falsely feel inflation is controlled, cut rates too quickly, and then see a massive re-acceleration. Both narratives can happen; it is just an issue of timing. So, we need to be able to hold these potentially competing narratives in our heads at the same time.
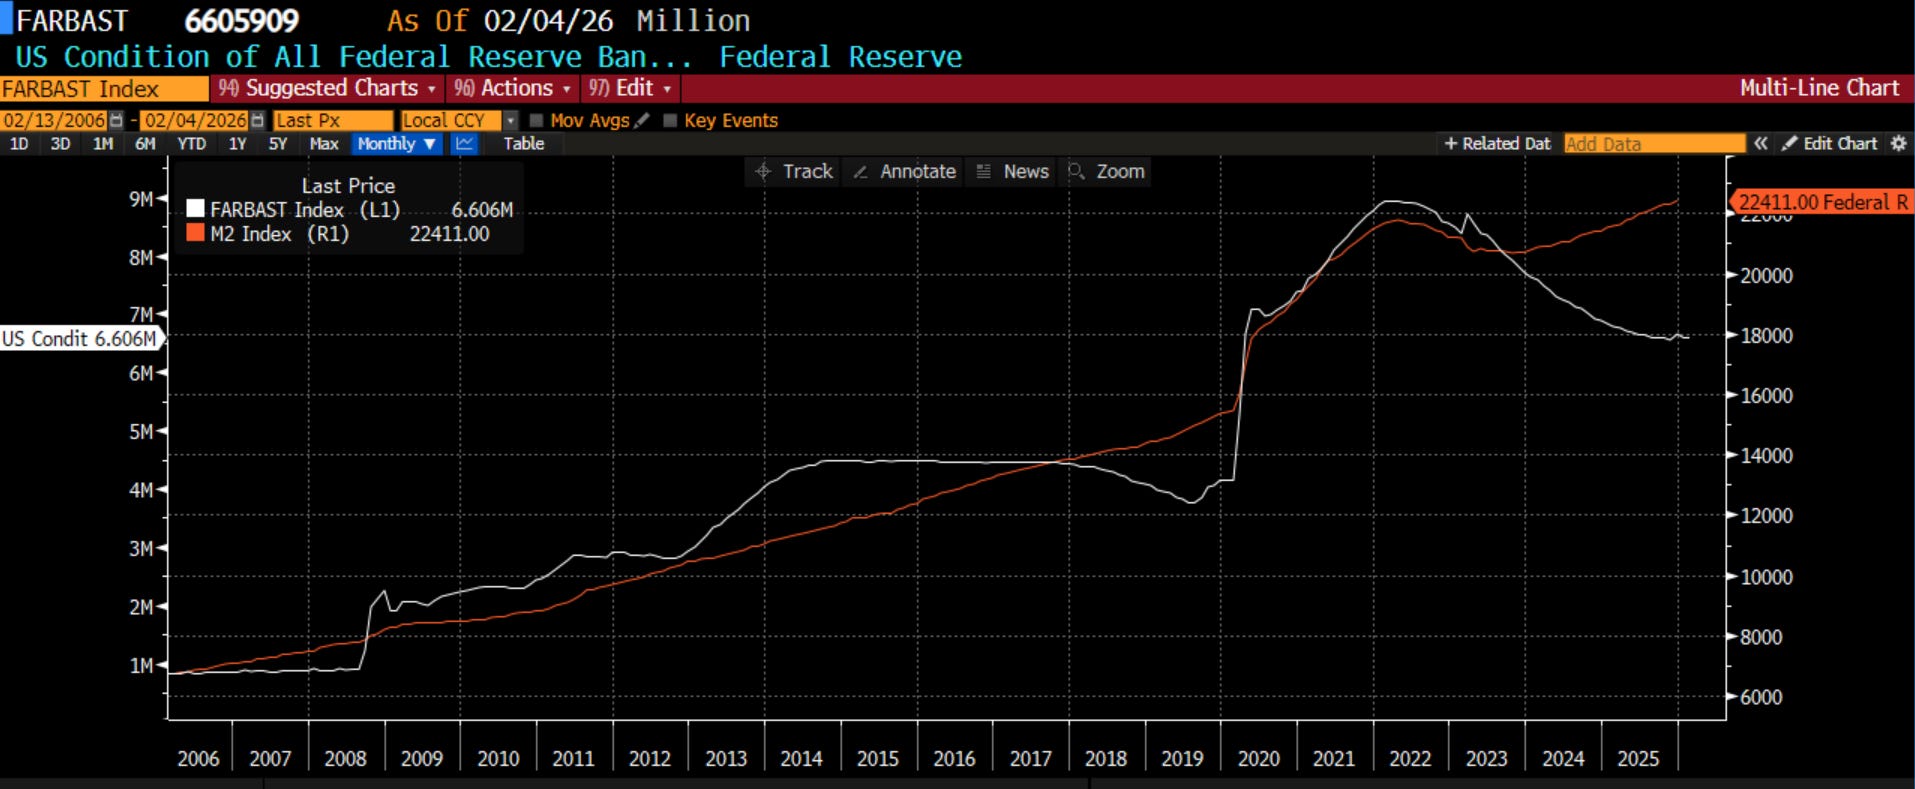
With the nomination of Kevin Warsh as Chair of the FOMC, another market narrative which matters in this debate is his hawkishness. I think more are coming around to the ideas of Barry Knapp, who we referenced last week. If Warsh is a hawk on anything, it is the Fed Balance Sheet and quantitative easing. Is reducing the Fed balance sheet a disaster for markets? I don’t think so at all. In fact, I think it is healthy longer term. While I have been a hawk on rates for a year now, I can actually get behind rate cuts if they are done in conjunction with quantitative tightening. At $6.6 trillion, the balance sheet is still double the pre-Covid level and 6x that of pre-GFC. At the time QE was first announced, Ben Bernanke drew the equivalence of $600 billion in QE was roughly the same as 75 basis points of rate cuts when asked if he would take rates below 0. I don’t believe this has been updated but if the FOMC were to reduce the balance sheet by $3 trillion to get to pre-Covid levels, would it need to take rates to zero to offset the effects? This seems a little too egregious, but one can see that several more rate cuts in conjunction with balance sheet reduction likely would not be stimulative. As we SHOULD know but don’t seem to know based on the conversation I see, it is not the FOMC and Fed balance sheet that leads to money supply growth and debasement. Money supply growth is driven by the extension of credit by the commercial banks. Yes, QE adds bank reserves, but as we saw after the GFC, banks don’t have to lend that out. We have see M2 money growth in the past in periods of QT and are again right now:
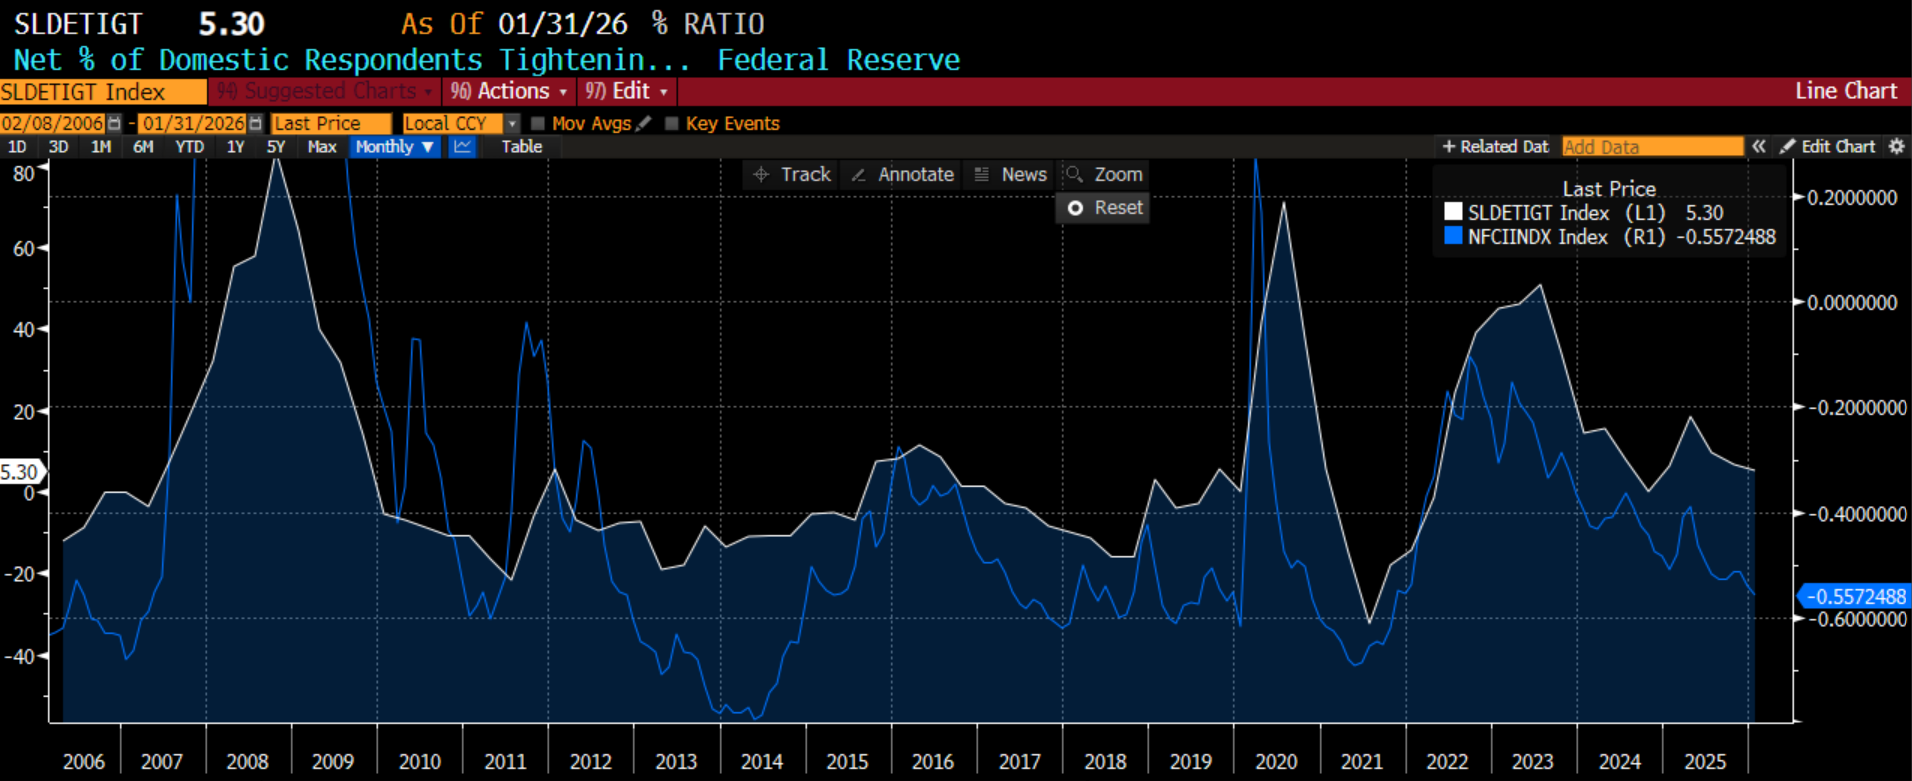
The banks have been willing to lend. This is why the Chicago Fed Financial Conditions Index is still saying financial conditions are quite easy. This is another driver of the improving growth numbers we see. It is important because even with the tax incentives for capex in OBBA, if the banks were willing to make those loans, they wouldn’t happen. However, demand and supply of loans for capex appear supportive:
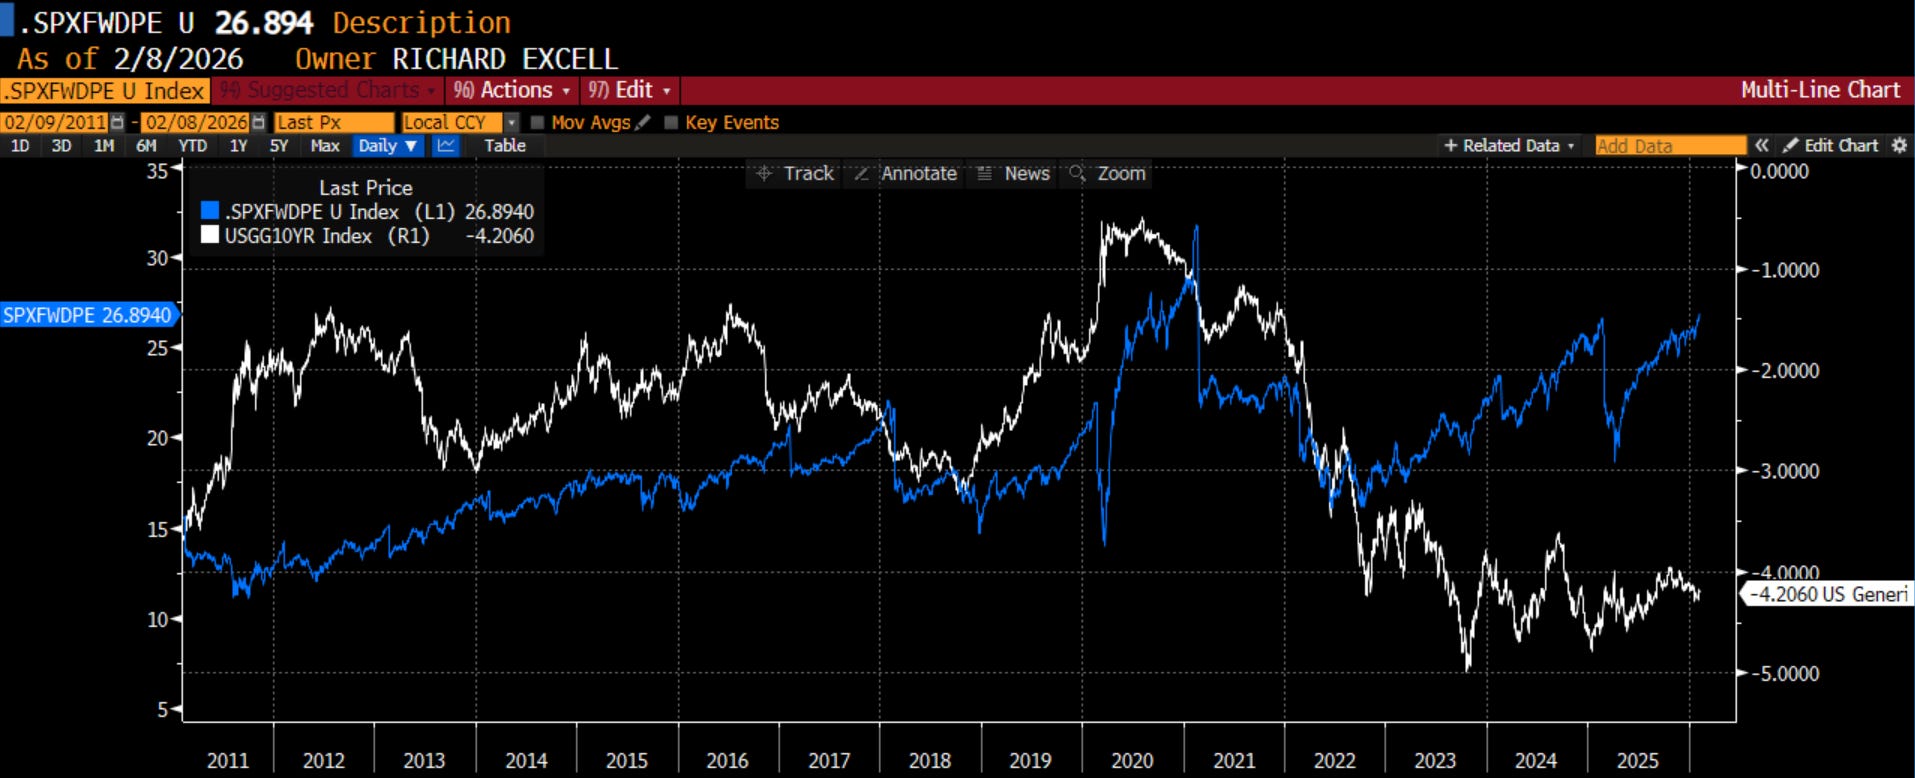
Supportive growth and the potential for inflation likely mean the US 10-year yield will have trouble to fall. This is important for equity markets because it means that earnings multiples probably only have one direction from here. You all know how disconnected multiples have been, and this is contributing to the rotation out of technology as the bar has been set perhaps too high. Falling multiples are a headwind for stocks, mostly in the US, mostly in tech:
Yet stock markets can still go higher even if multiples fall. That would have to come from earnings growth. So far, a little more than halfway through earnings season, earnings are surprising on the upside in every sector of the market. This is leading to positive price action on earnings days in most sectors (lower right). The level of surprise is better than the last few quarters (lower left). Can earnings carry the market?
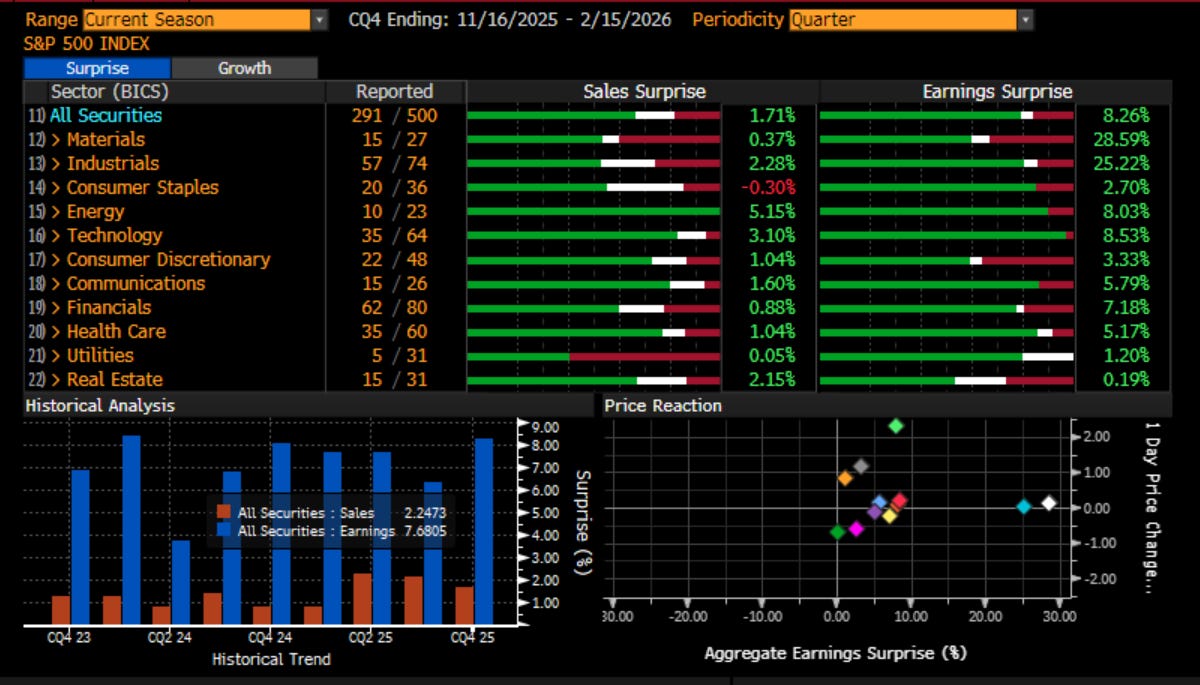
This is a more detailed summary of earnings via FactSet:
“According to FactSet's latest Earnings Insight report, the blended earnings growth rate for Q4 S&P 500 EPS currently stands at 13.0%. This is above the 8.3% expected at the end of the quarter. The blended revenue growth rate is 8.8%. Of the 59% of S&P 500 companies that have reported for Q4, 76% have beaten consensus EPS expectations, below the 79% one-year average and the five-year average of 78%. In addition, 73% have surpassed consensus sales expectations, above the 71% one-year average and the five-year average of 70%. In aggregate, companies are reporting earnings that are 7.6% above expectations, better than the 7.4% one-year average positive surprise rate but below the five-year average of 7.7%. In aggregate, companies are reporting sales that are 1.4% above expectations, above the 1.3% one-year positive surprise rate but below the five-year average of 2.0%”
Good news in the US, but maybe not as good as hoped. Better news for the rest of the world. If that continues, expect the rotation out of Tech and into Energy, Materials & Industrials to accelerate. If that continues, expect the rotation out of the US and into the rest of the world to accelerate.
From an American perspective, I hope this doesn’t happen to the Olympic team the same way it is happening to Mag 7.
Stay Vigilant