


What I talked about this week


Back to Mad-Eye Moody this week. I tell you, all week I felt like we are chasing the Dark Arts. My theme on LinkedIn this week was inflation given the CPI report on Wednesday. I felt that given the market surveys suggested that high inflation was the biggest tail risk, and given I thought we would get higher inflation, I thought we could be in for a potential turning point.
I will tell you when I saw the headlines about an Iranian attack on Israel on Saturday night US time, I was pretty nervous. While this attack appears unsuccessful now, I don’t think we have seen the last of it. My sense is this is only going to add to risk premia, move volatility higher, spreads wider and multiples lower until there is some resolution. However, more on that next week when we have more clarity.
For now, I wanted to send you my thoughts on inflation as it evolved this week.
Monday
Chart of the Day - equity risk premia
A quick note today as I try to get back into work mode after a fun golf trip. Thanks again PD for your hospitality
Looking through a few charts this morning, I still think this one stands out. There is nothing that says it has to mean revert any time soon, but it is one that says that maybe we need to be wary
The chart compares the earnings yield on the SPX to the 10-year Treasury yield. One can think of it as a sort of equity risk premium that holders of the riskier equities would pay vs. the risk-free rate
You can see now that it is basically zero. Of course, it was negative for a few years in the late 90s, so things can get more stretched and stay that way. Like I said, nothing says it has to mean revert soon
However, consider a few other drivers potentially:
1. Kashkari comments from last week that if inflation stays here, perhaps there will be no rate cuts this year. I think that is the first salvo of Fed-speak preparing the market
2. I have shown several times why I think inflation is here to stay and therefore the Fed won't be cutting as much as the market thinks
3. Consider as well that 10 year yields could be heading higher not only because of higher for longer FOMC, but also the amount of Treasury issuance we will see
4. Consider on that Treasury issuance that the currencies of the largest foreign holders of US Treasuries - Japan, China and UK - are all weakening. This might suggest that they will demand a higher yield to compensate for weak currencies
5. Consider that in 2024, Americans are retiring at the fastest rate in history. 11,000 American a day are turning 65 in 2024. The required minimum withdrawal kicks in at 72 so over the next year, we are going to be close to 20% of the population that needs to do so
6. Finally consider that Americans have already shown that a 10-year yield near 5% is interesting to them and they will sell stocks to buy bonds at that level
There are a lot of dominoes to fall for sure. However, we at least want to know where they are lined up so when it starts to happen we are ready
Stay Vigilant

Tuesday
Chart of the Day - higher for longer risk
This weekend I looked at a variety of measures of risk premia - equity, credit, volatility - in my Stay Vigilant. You can find it at stayvigilant.substack.com
One of the measures that really stood out was credit spreads. Now we know that the absolute cost of credit has gone higher as Treasury yields have gone higher. In a higher for longer Fed scenario, this is certainly a risk
However, credit spreads or the spread of a credit index (investment grade or high yield) to Treasuries are at the lows of the 21st century, below the pre-GFC period and even the tight credit period that preceded the Enron, Wolrdcom & Tyco fiascos
This tells me that the public credit markets are open for business & welcome to fund companies and projects that have access to the public markets. Typically this is large & mid sized companies
Banks willingness to lend has improved somewhat but, while off of levels that have historically suggested a recession, they are still quite poor. This impacts small and local businesses more
However, while spreads are tight, like I mentioned, absolute measures of risk are almost double what they were in 2020-2021 though are still at average levels (about 6%) that we have seen since 2000
The reason that being double 2020-21 levels seems to worry me is that many commercial loans are 3-5 years which means we are largely in the sweet spot for refinancing. However, costs to refinance are about double what costs were when the loans were initially made
Many are familiar with this risk as it relates to commercial real estate. This has been a much talked about concern. However, even private credit/direct lending firms have discussed it
Not that it impacts these funds as much as their portfolio companies who are paying floating rates and will be burdened by the higher costs.
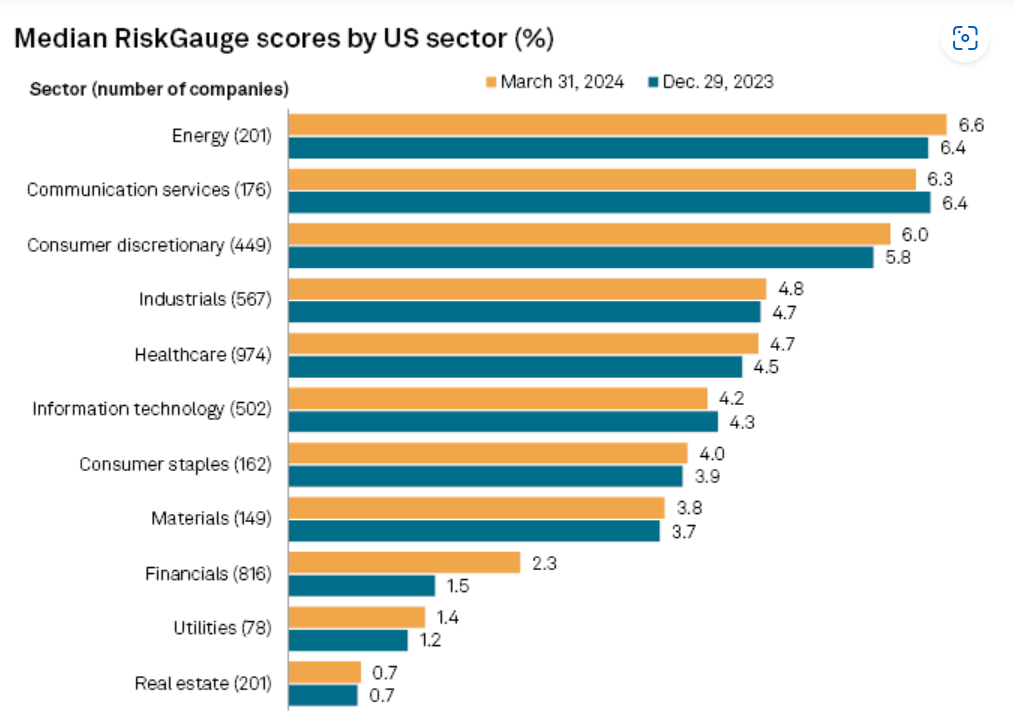
Today we see the Median RiskGauge score on default risk that S&P Cap IQ put out. We can see that across the board it has ticked higher. From S&P "The scores represent the median odds of default on debt within a year and are based on financial reports and the volatility of share prices for public companies on major US exchanges, accounting for country- and industry-related risks and other macroeconomic factors."
More from S&P "interest burdens should remain high throughout most of 2024, according to S&P Global Ratings, which forecast an uptick in the share of speculative-grade rated companies to default by December to 4.75%, up from 4.5% in December 2023"
Higher for longer could well happen if inflation does not look to continue to fall, something I have discussed for some time. The BAML Global Fund Mgr Survey highlights inflation as the biggest tail risk
Higher for longer means interest burdens won't alleviate. I will look at the Zombie companies that are most affected on Thursday. Inflation & Fed policy are going to be a big driver for risk in the coming weeks
Stay Vigilant
Wednesday
Chart of the Day - CPI Day is here!
Today we get the CPI. This is much more long-awaited data and given the comments from Fed central bankers regarding the future path of rates, it is taking on even more significance
It is already a big focus for the markets. The most recent BAML Global Fund Mgr Survey highlights higher inflation as the biggest tail risk for the markets. This is not surprising given 85% of the market is seeing either a soft landing or no landing this year
The bond market has priced out a number of rate cuts, coming down from 6.7 for 2024 in January to 2.5 for 2024 as of now. Will this change even more after today? In which direction?
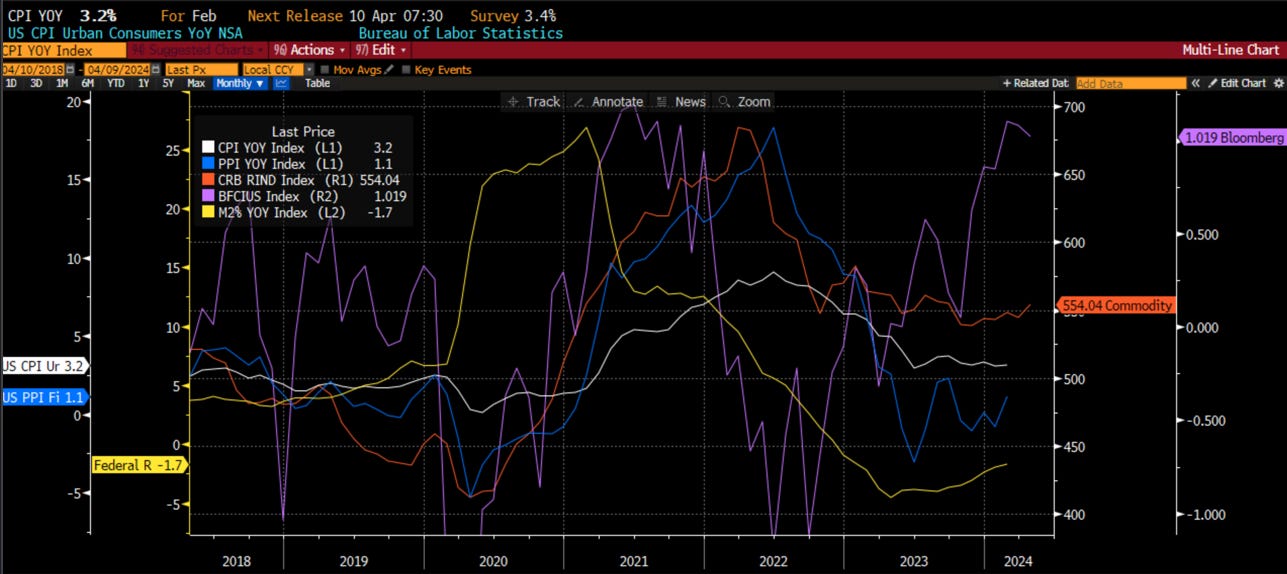
Today's chart is busy but I tried to put on here a few other bits of data that will impact the CPI that we see. You can see from the chart, to varying degrees, all of this data is pointing higher. CPI is the only thing that is flat-lining. Recall, market players think it will still continue to fall
First - PPI. Producers prices have been in an uptrend since June of last year. There was a long time that producers could not pass price on to consumers, largely due to the Amazon effect. Covid changed that a bit & we see the impact
Second - CRB commodity index. I have shown the correlation between the raw industrial commodities shown here (those not traded & affected by speculation but only by real world activity). This is also pointing up and is higher on a year over year basis
Third - M2 money supply. This one is controversial because we have seen extreme moves since Covid. In the immediate response, M2 grew the fastest in US history, up over 25% yoy. Last year it fell to negative for the first time ever, coming off those highs
However, the monetary base, the amount of money sloshing around, was still up 10% so there was plenty of money. In addition, the negative growth rates have turned the corner & are also pointing up
This leads into the 4th - fincl conditions. Jay Powell spoke about how fincl conditions look tight as a reason for rate cuts. The ONLY measure of fincl conditions that I can find is tight is the Chicago Fed conditions
This measure is the Bloomberg measure & it captures a number of market variables. All-time high stock prices, credit spreads at 30 year tight levels, & a strong dollar vis a vis other countries are all reasons fincl conditions are a good deal easier by these measures
You can see that all of these measures would seem to suggest CPI is higher and not lower. I think the market would be worried if it just continues flat-lining
What would the Fed-speak be if CPI started going the wrong way? Jay Powell told us last year that they really don't know what drives inflation. Perhaps we should consider this when reading his more dovish comments from the March FOMC. Let's see what they say after today
Stay Vigilant
Thursday
Chart of the Day - inflation follow-up
So CPI inflation was higher yesterday across the board - month over month, year over year and even year over year excluding the 'volatile' food and energy that most Americans spend their money on
It should be no surprise for you to read that because I have been harping on inflation being persistent for months. What is the most obvious repercussion though?
The market is not prepared for it. The market has been pricing in a soft-landing. Earnings multiples on stocks have been rising even though earnings are largely flat. This is what has driven equity prices
Longer duration assets were priced for 3 rate cuts that are now very likely not going to happen. If you have been listening to my Macro Matters podcast, I have said no rate cuts this year for two months. I still stand by it
Where are we perhaps seeing the biggest changes? Treasury markets. These were priced for 6.7 rate cuts in January. They were still 3 rate cuts after the last FOMC. It is now down to 1.6 rate cuts with all of it after the summer, closer to the election. Not seeing it.
Look at the chart today. We are at a massive inflection point in the 10 year US Treasury yield. Any student in any of my classes will know that everything hinges on the 10 year US Treasury yield. Every asset is priced off of it
It is at a critical technical level at the top end of its range and at the 61.8% retracement of the move from the 5% highs last summer to the 3.8% lows in December
You remember the move, the one that was the catalyst to the massive rally in risky assets. Well that move is in the process of being unwound. Of course, it could hold here and not move higher, back to 5%. It hasn't technically broken out yet
Why do I think it will?
The CPI today has taken June rate cuts off the table and I think July will be off soon enough. Higher Fed Funds means higher 2 year and higher 10 year
The Treasury issuance of notes and bonds relative to bills will be increasing in Q1 and Q2 vs. the previous two quarters. More supply, further out the curve
The largest foreign holder of Treasuries, who we would hope would step up and buy, is seeing their buying power fall as USD/JPY breaks out to the upside. The JPY above 152 is above the level the BOJ intervened at before. Has the BOJ lost control by saying policy remains accommodative?
What gets impacted the most? I think long duration equities - tech stocks with little earnings and money losing small caps - as well as cryptocurrencies
Of course this has been the most favored part of the market. Where people are long, expecting a soft landing and gently falling inflation
What happens when everyone is on one side of the boat and many start to move? It gets a little rocky
Stay Vigilant

Friday
Chart of the Day - are oil prices high enough?
Continuing on my inflation-week theme, I can't take my eyes off of commodities. In my Futures & Options class, oil and copper have become the two most popular commodities to look at given the newsflow we have gotten the past few weeks
When we looked at oil in class yesterday, we looked at the technical charts (trend looking healthy but maybe overbought on the near-term stochastics), the fundamentals (supply & demand still favor oil) and catalysts (geopolitics are far from stable/able to fade)
This morning, I was inspired to consider something else. You see another topic has been the debasement of fiat. On the one hand, the dollar is strong against all major trading partners - Yen, Yuan, Pound, Euro - except the Peso. On the other, Bitcoin & Gold are both telling us this may be a fiat problem
When I want to take the fiat currency out of the equation, I look at commodities priced in gold. This then becomes more of a 'pure' measure of the price of the commodity because it doesn't consider whether the dollar is in a strengthening or weakening position
So I looked at oil in terms of gold and the pattern was quite different. Oil prices were closer to their lows of the last year not in an upward trend. Maybe all we have seen in higher oil in terms of dollar is another example of debasement. Is it not reflecting the fundamentals?
I then overlaid the international crude oil consumption as reported by the EIA. This historically has a very tight fit to oil in terms of gold. What the world consumes impacts the price of oil ex the currency effects
That is the chart below. You can see global demand is still at all-time highs, above pre-Covid levels etc. However, oil in terms of gold is lagging badly and has for more than a year
Perhaps this is the oil market telling us that consumption is about to fall. I am open to that suggestion but the amount consumption would have to fall would be a recession similar to what we were going into in 2019 even before Covid hit. Very few will tell you they see a recession as the outlook
Another interpretation is that oil prices are just not high enough. Why could this be? I can think of a few reasons:
1. Traders got burned buying on geopolitics last October. No matter how bad it looks, they are prone to fade the headlines. Gaza peace accord resonates more than potential Iranian retaliatory strike
2. There is an expectation the Biden Administration will do everything it can to collapse oil before November the way it did in 2020. However, with the SPR at 40 year lows, it is not clear there are as many tools in their toolkit
3. There is not enough appreciation for how strong oil demand is. Perhaps it is China skepticism, perhaps it is embedded US soft-landing biases, perhaps it is Euro-negativity. Many probably don't realize oil demand is at all-time highs
Whatever the reason, consider oil may not be high enough
Stay Vigilant

Stay Vigilant indeed