
What is the common thread?
Is there one thing that is impacting all markets right now?


Given my trip to Japan and time with family for my co-host, it had been a month since we got together for the CFA Chicago ‘Macro Matters’ podcast. As a result, we thought it would make sense to take a look at all of the major asset classes to get a sense of what was happening. Each one has had quite the month even though I know most of the headlines go to the moves in the stock market.
As we ended the podcast, I asked the question, “is there a common thread driving all of them?”
You can listen to the podcast on any podcast app or get it here: Macro Matters
Bonds
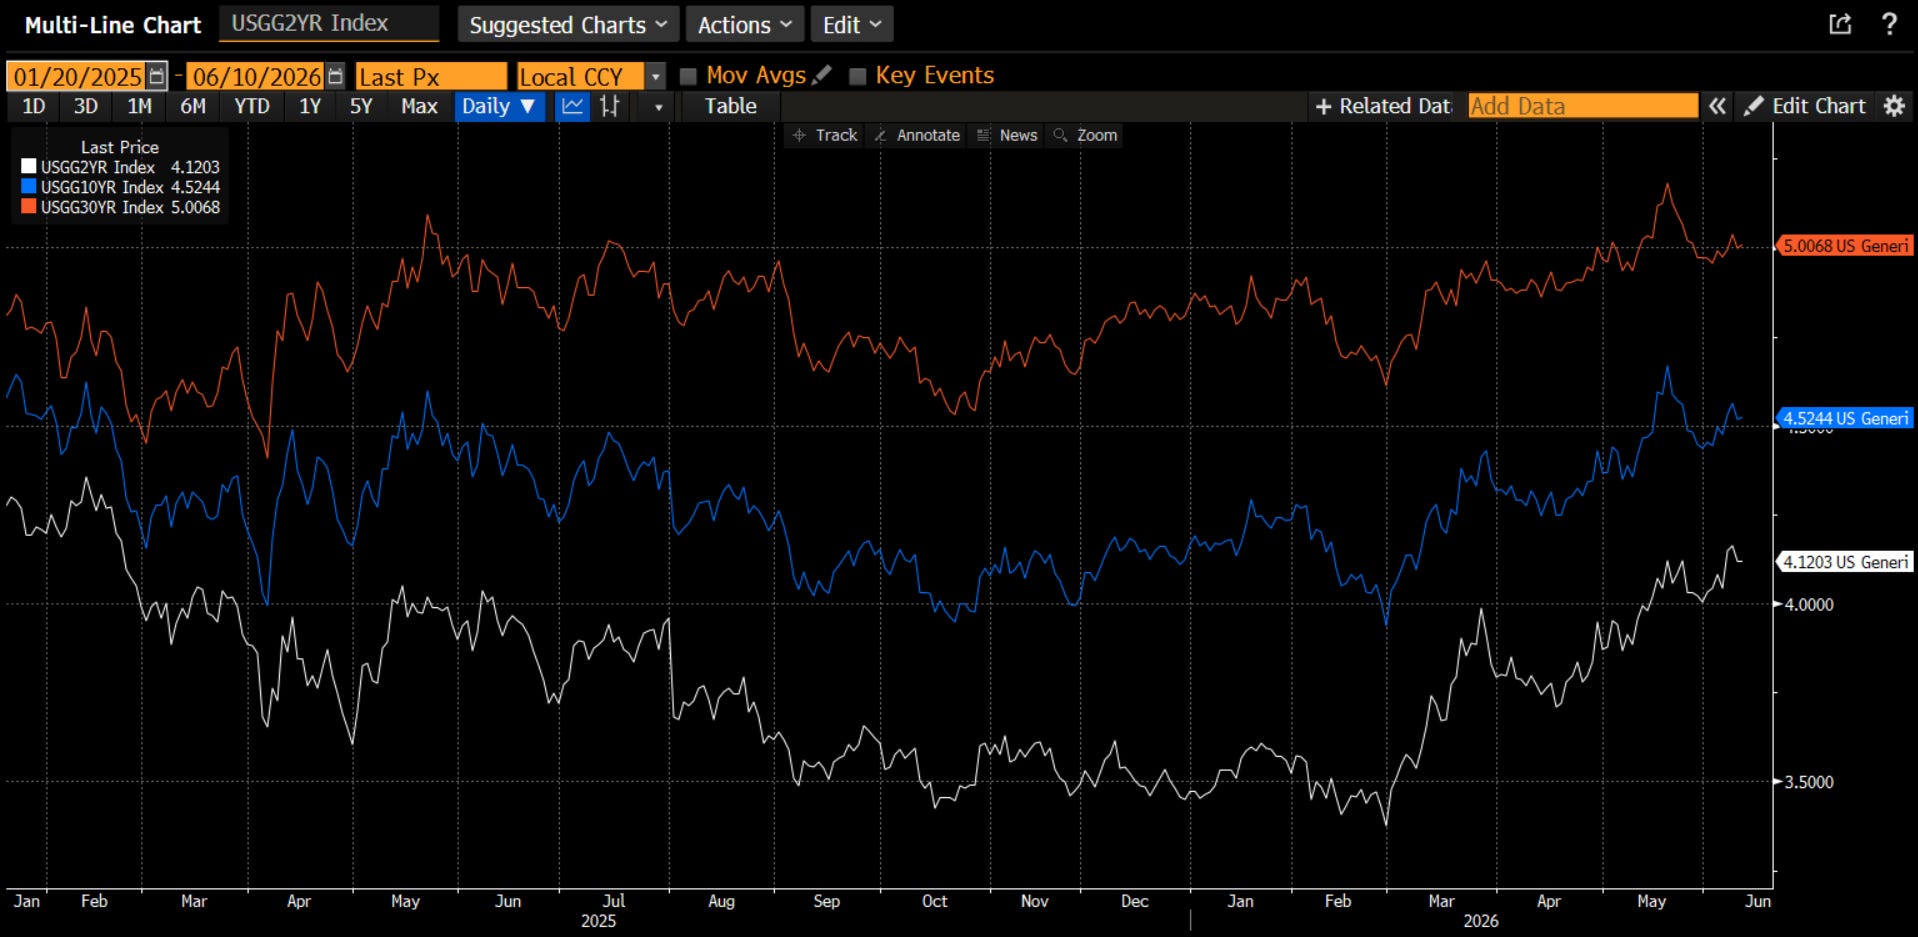
As I have discussed before, there may be a ‘line in the sand’ for the Treasury market. The US needs to fund $39 trillion of debt this year and the typical buyers are either more hostile to the idea (China) or less able to find the money (Japan) or not interested in the yields (Boomers). I have thought this line in the sand is around 4.5% in the 10-year yield, which is where yields were when the President and his Administration came into office in early 2025.
That seemed to work for all of 2025 and even into early 2026. However, since the start of the conflict in the Middle East, you can see, almost to the day, an abrupt turn. Every Treasury yield - 2-years out to 30-years - has moved higher since the beginning of March. The 2-year is 75 bps higher, 10-yr 55 bps higher and 30-yr 35 bps higher. These are big moves over the 3-month horizon.
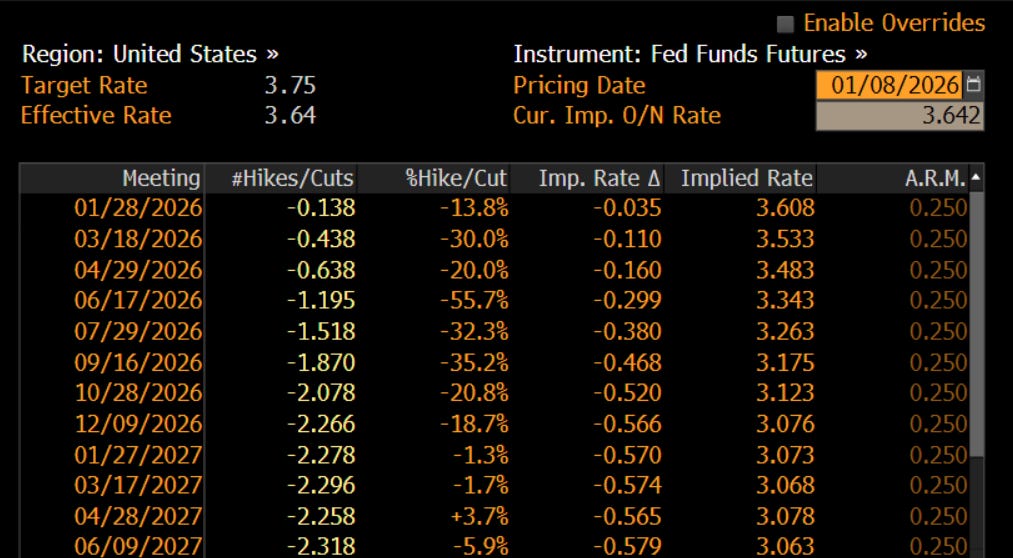
Flashing back to the start of the year (it seems so far away), we may recall that the market was pricing in more than 2 rate cuts (56 bps) by the end of the year. They were expected to start at the June FOMC, when the presumed new Fed Chair Kevin Warsh would take over and bring his dovishness to the FOMC. Remember?
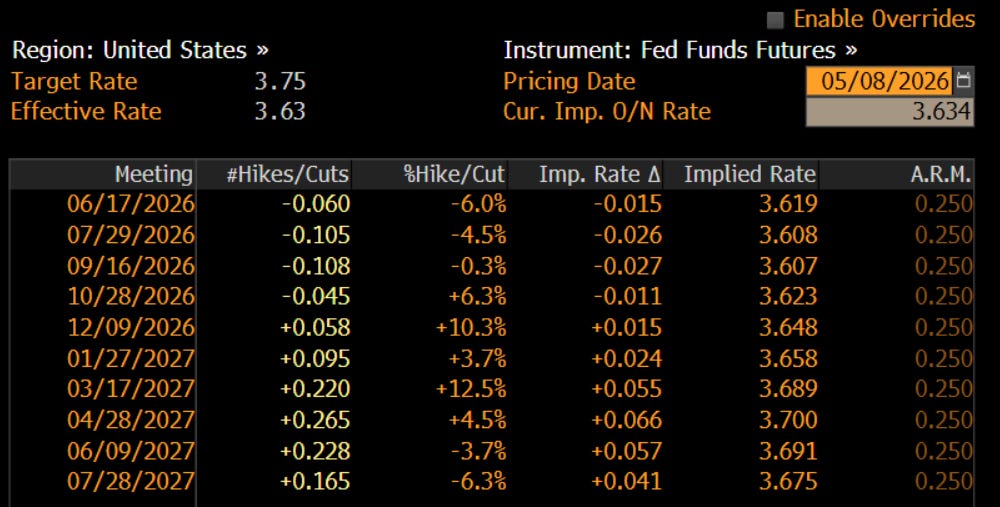
By early May, with the conflict in the Middle East now two months old, the market had given up on rate cuts. In fact, there were really no expectations of any moves for the next 18 months. The Fed was expected to be on hold for an extended period of time.
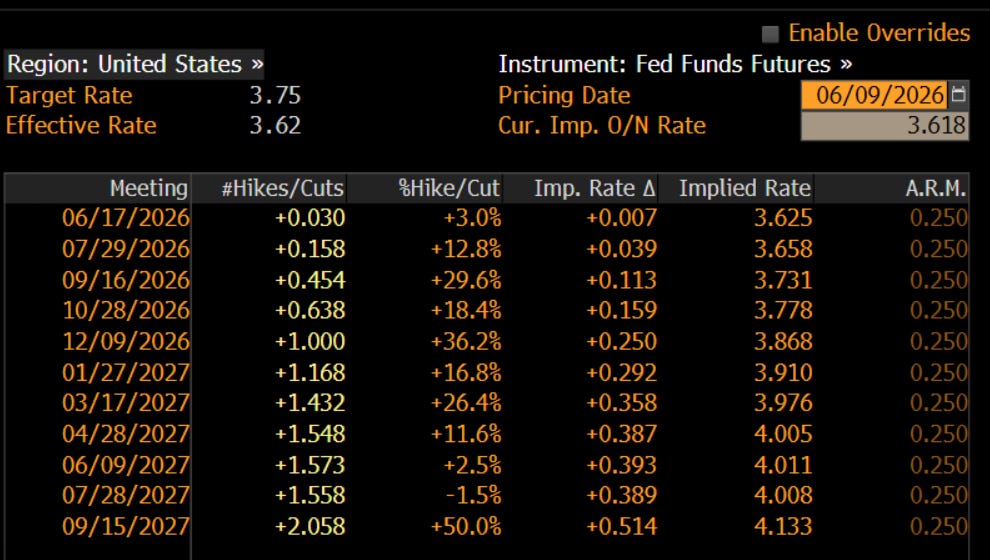
Move to today and the Fed Funds futures & options market is now pricing in a full rate hike (25 bps) by the end of the year and 1.5 rate hikes over the next 12 months. This 75 bps+ of expected rate change increase (from over 50 bps of hikes to more than 25 bps of hikes) explains the entire move in the 2-year yield, which in turn is driving the rest of the curve. What is driving this move in the rates?
Commodities
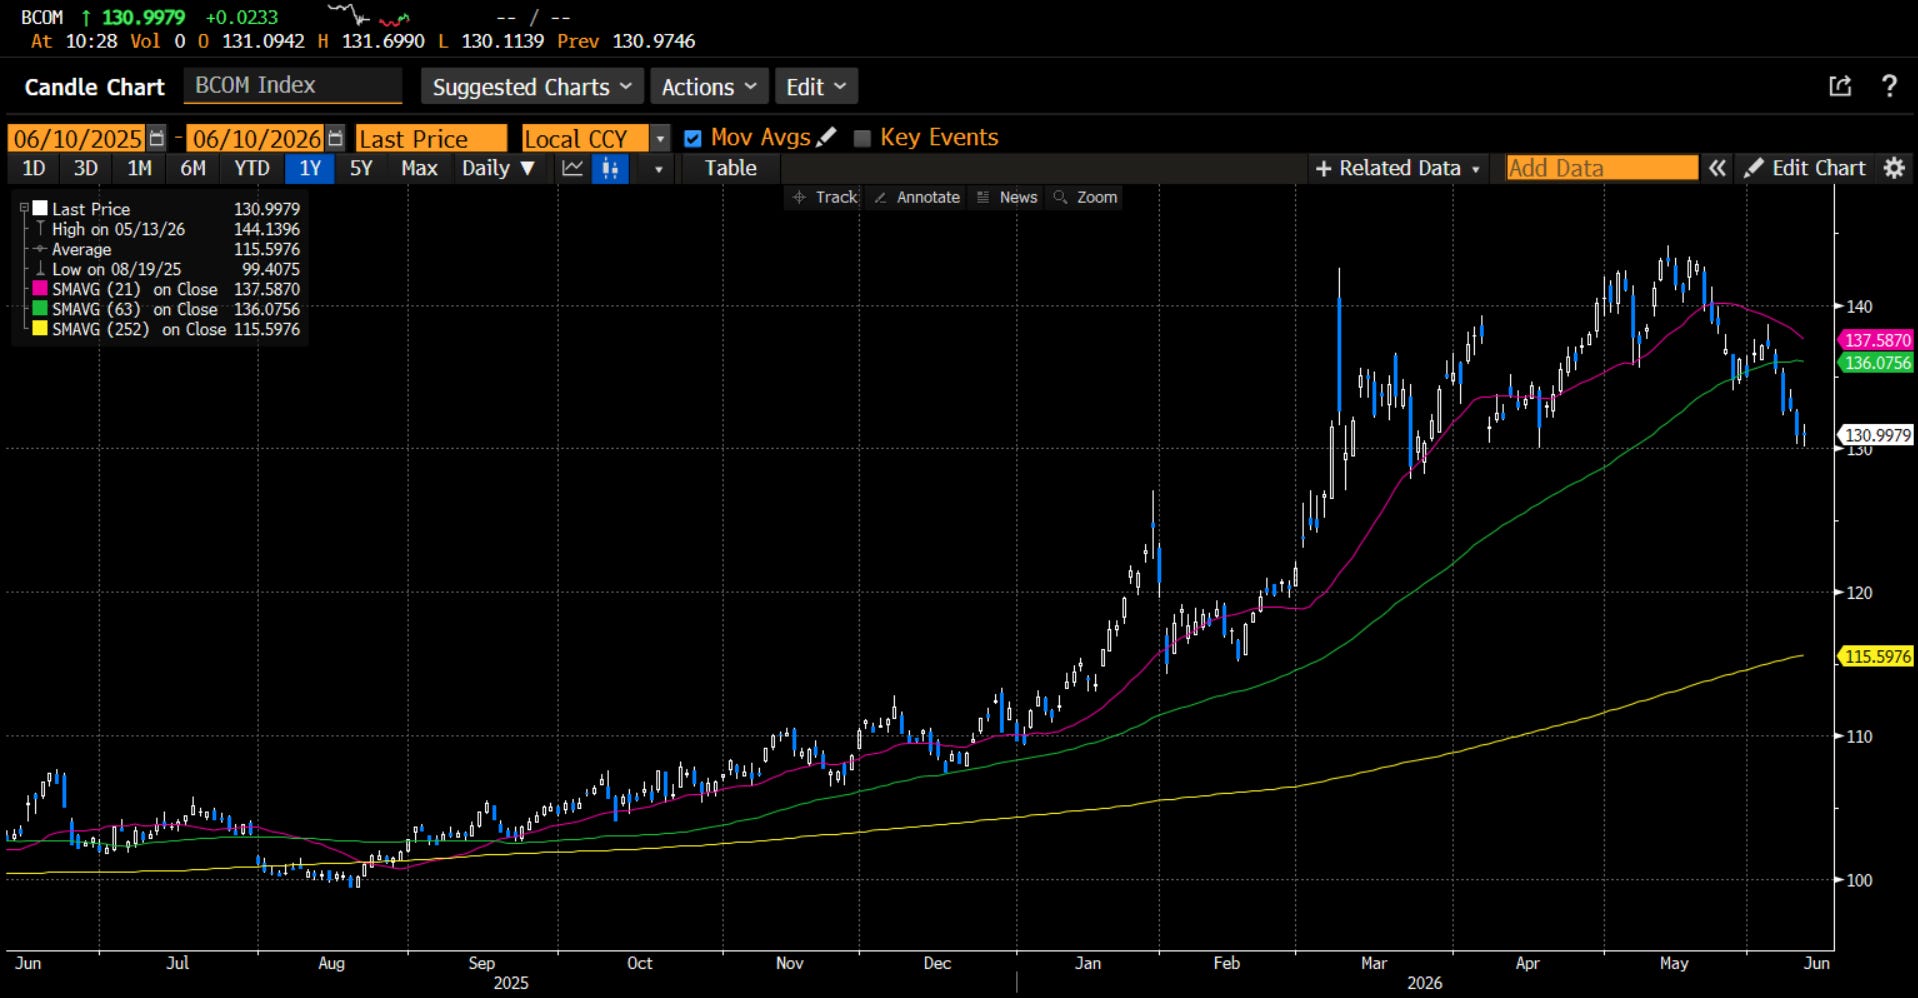
You would have to be living under a rock to not know about the conflict in the Middle East. The knee-jerk is that oil prices are affected; however, it is really a variety of commodities, many of which use petroleum as an input. In addition, transportation costs take all other commodities and products higher. The move from the end of February to mid-May was about 20% in the broader commodity market. It has turned in the last month, but still is 10% higher from the start of the conflict.
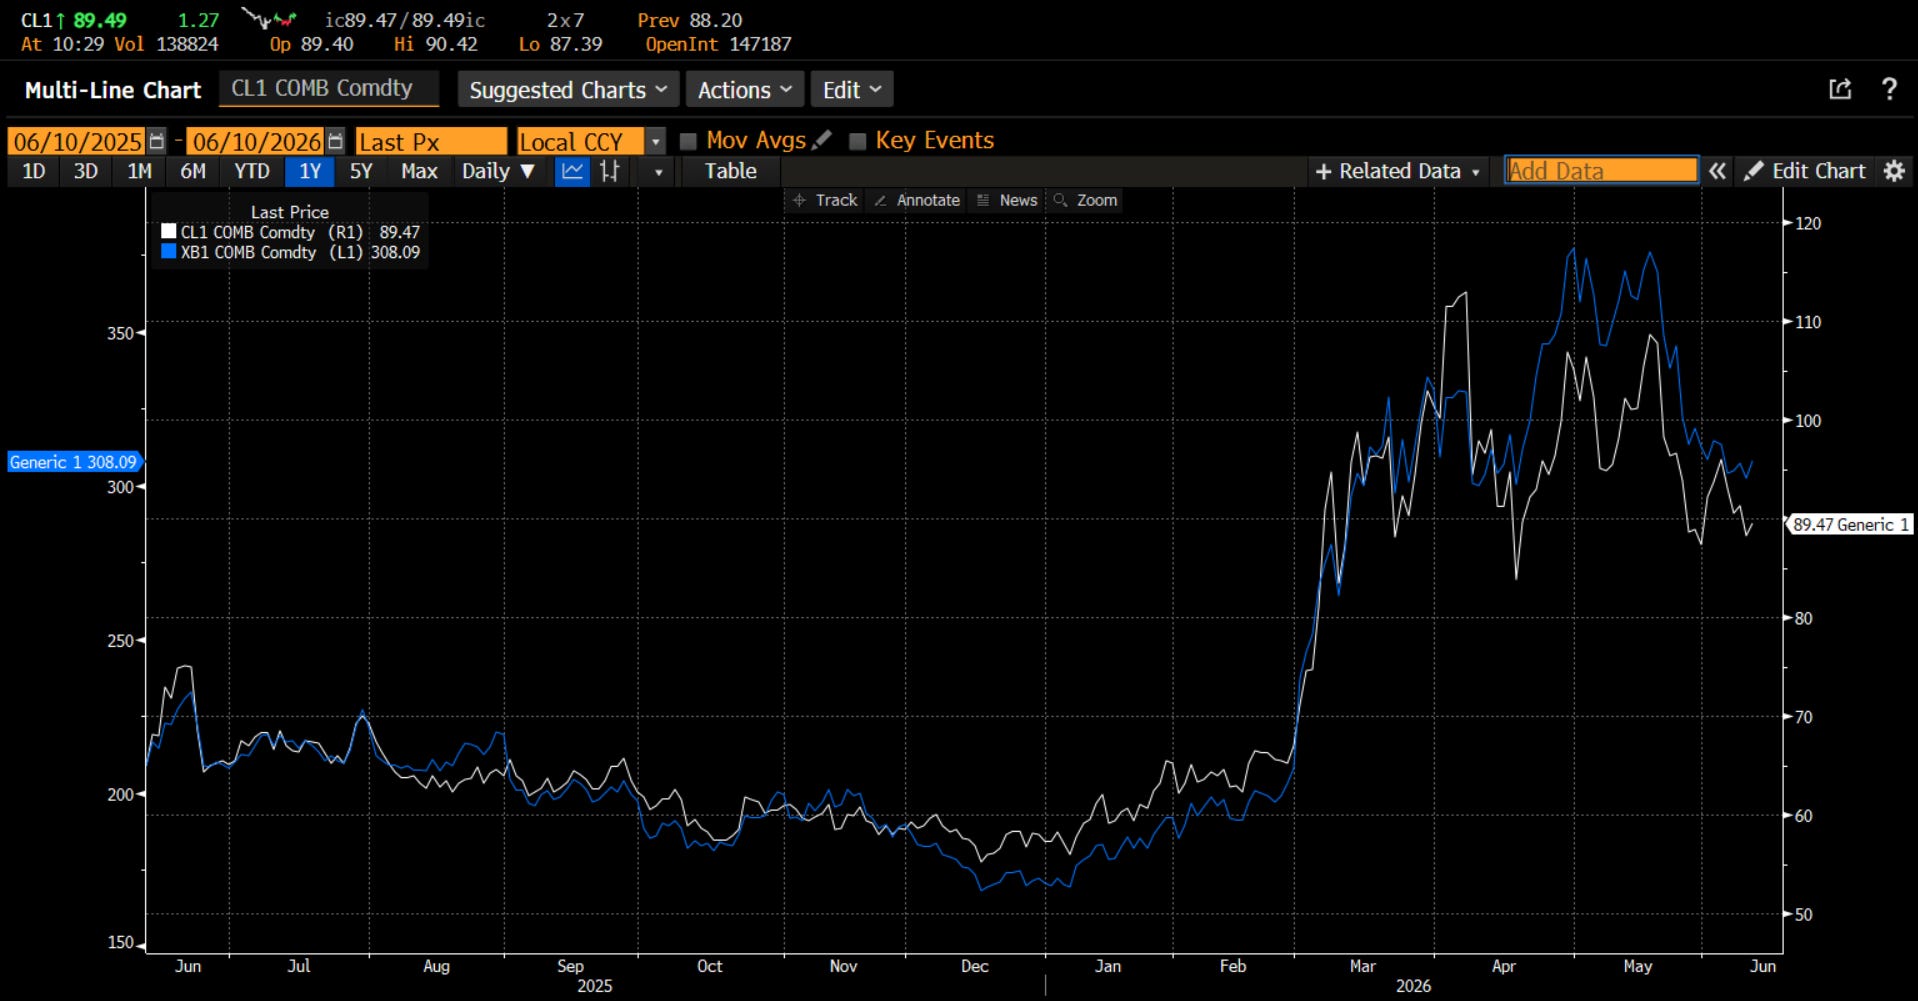
Oil is the thing that most focus on because it impacts their day to day more directly. The chart above shows the front month crude oil futures price as compared to the front month gasoline price. Not surprisingly there is a direct connection. Gas prices in the US have moved from $2 a gallon to a high of $3.50 a gallon and have since corrected to about $3 a gallon. Is this impacting consumer behavior? Most governments fear this.
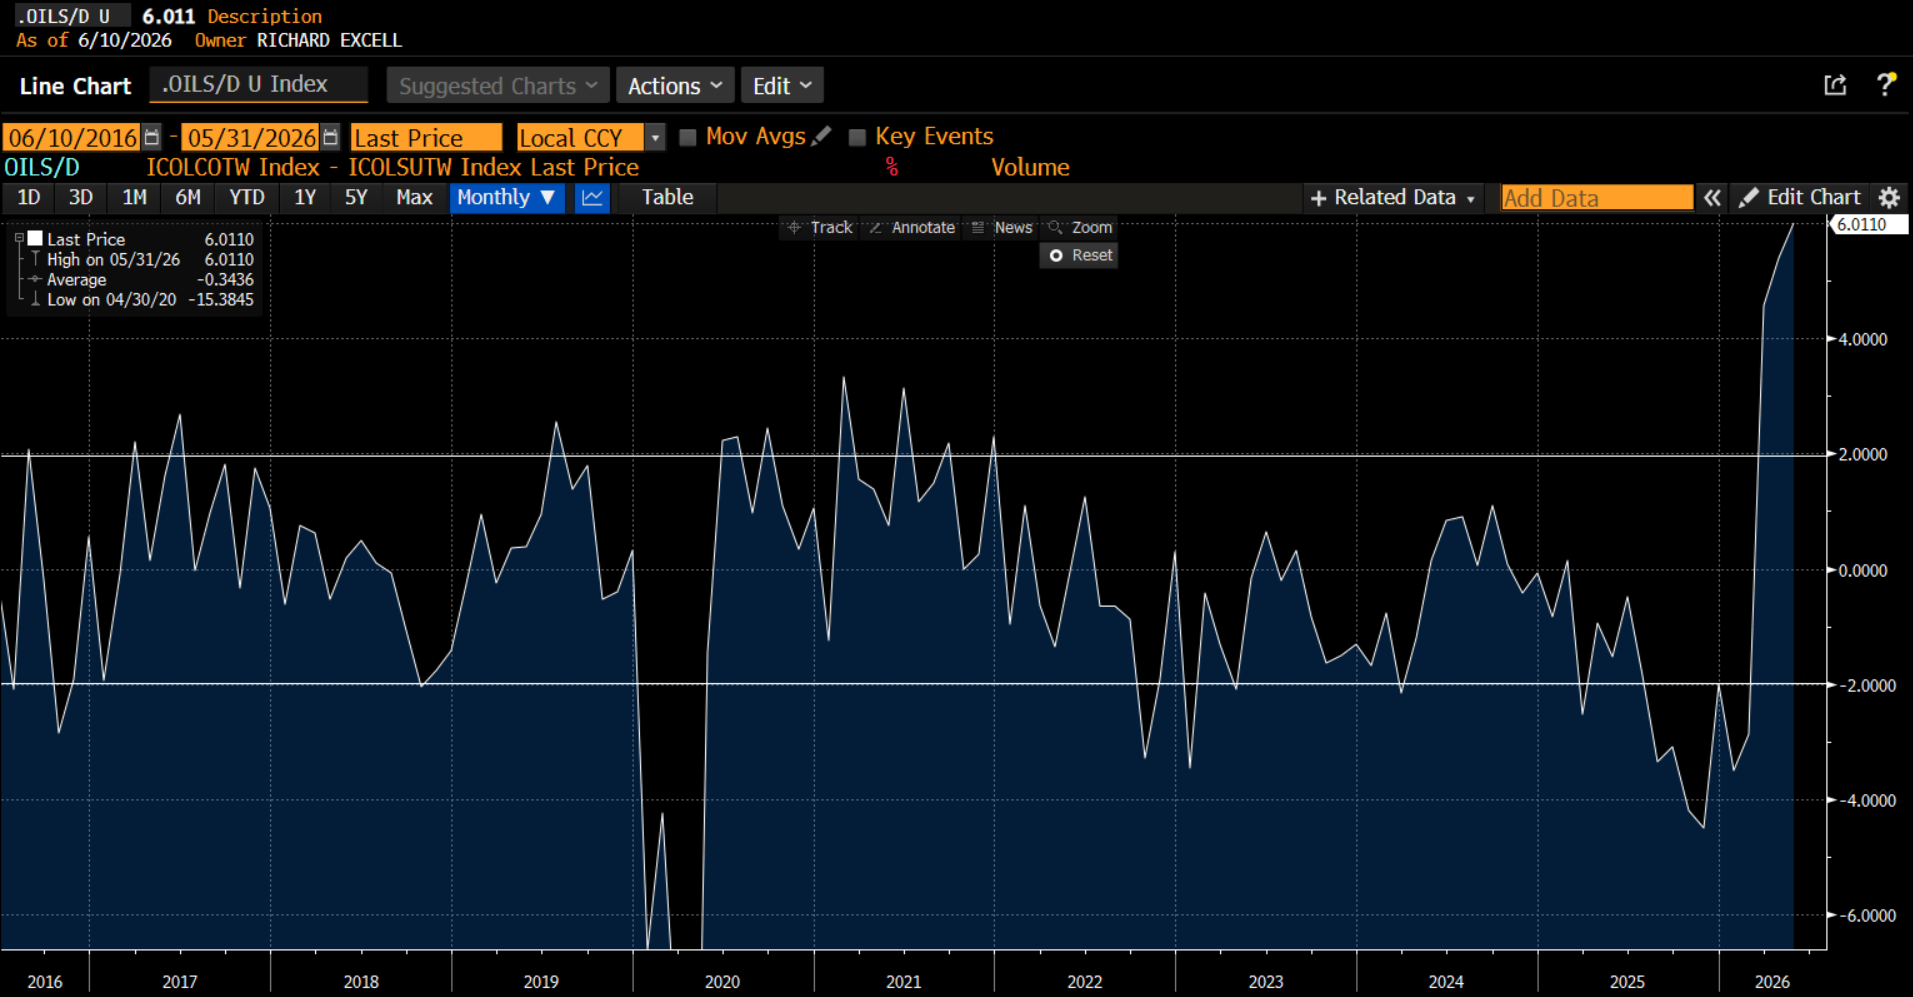
The supply disruption is real. The oil market, based on EIA data, has moved from extremely over-supplied at the end of 2025, which was weighing on prices, to meaningfully undersupplied. This is the 10 million barrels shortfall through the Strait of Hormuz you hear about. Most in the energy market are quite surprised oil prices (and by extension gasoline prices) are not much higher than they are currently.
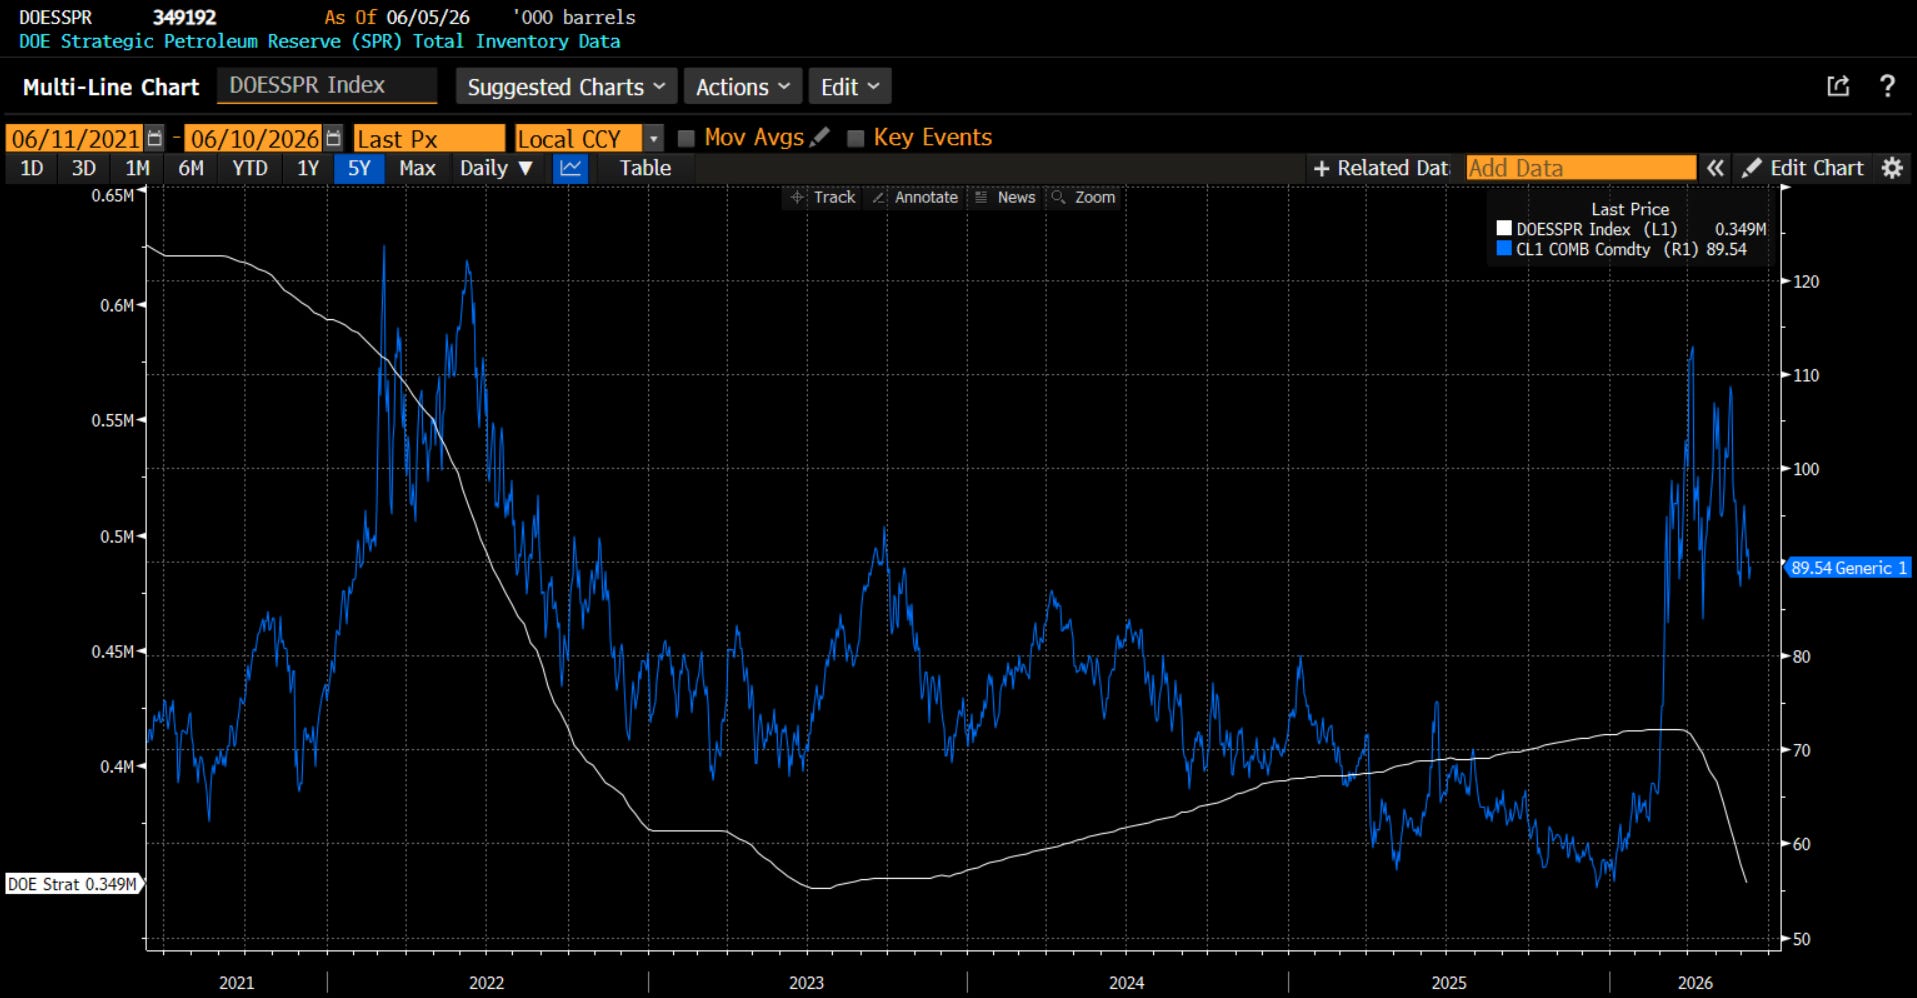
Perhaps the reason they are not higher is that governments, worried about the impact on the consumer, are taking actions. In the US, the Strategic Petroleum Reserve has been drawn down from 415mm barrels to 349 mm barrels. We should not be surprised. The Biden Administration drew down the SPR from 600mm barrels to 347 mm barrels before the 2022 mid-term elections. While many were cynical about this, it worked. The Dems did well in the mid-term. Do you think the Trump Administration isn’t aware? The question becomes: how much can they draw down? Also, is this only temporary until the Middle East is solved and oil starts flowing? Can the Iran problem be solved? All of this impacts oil, gas and consumer expectations.
Gold
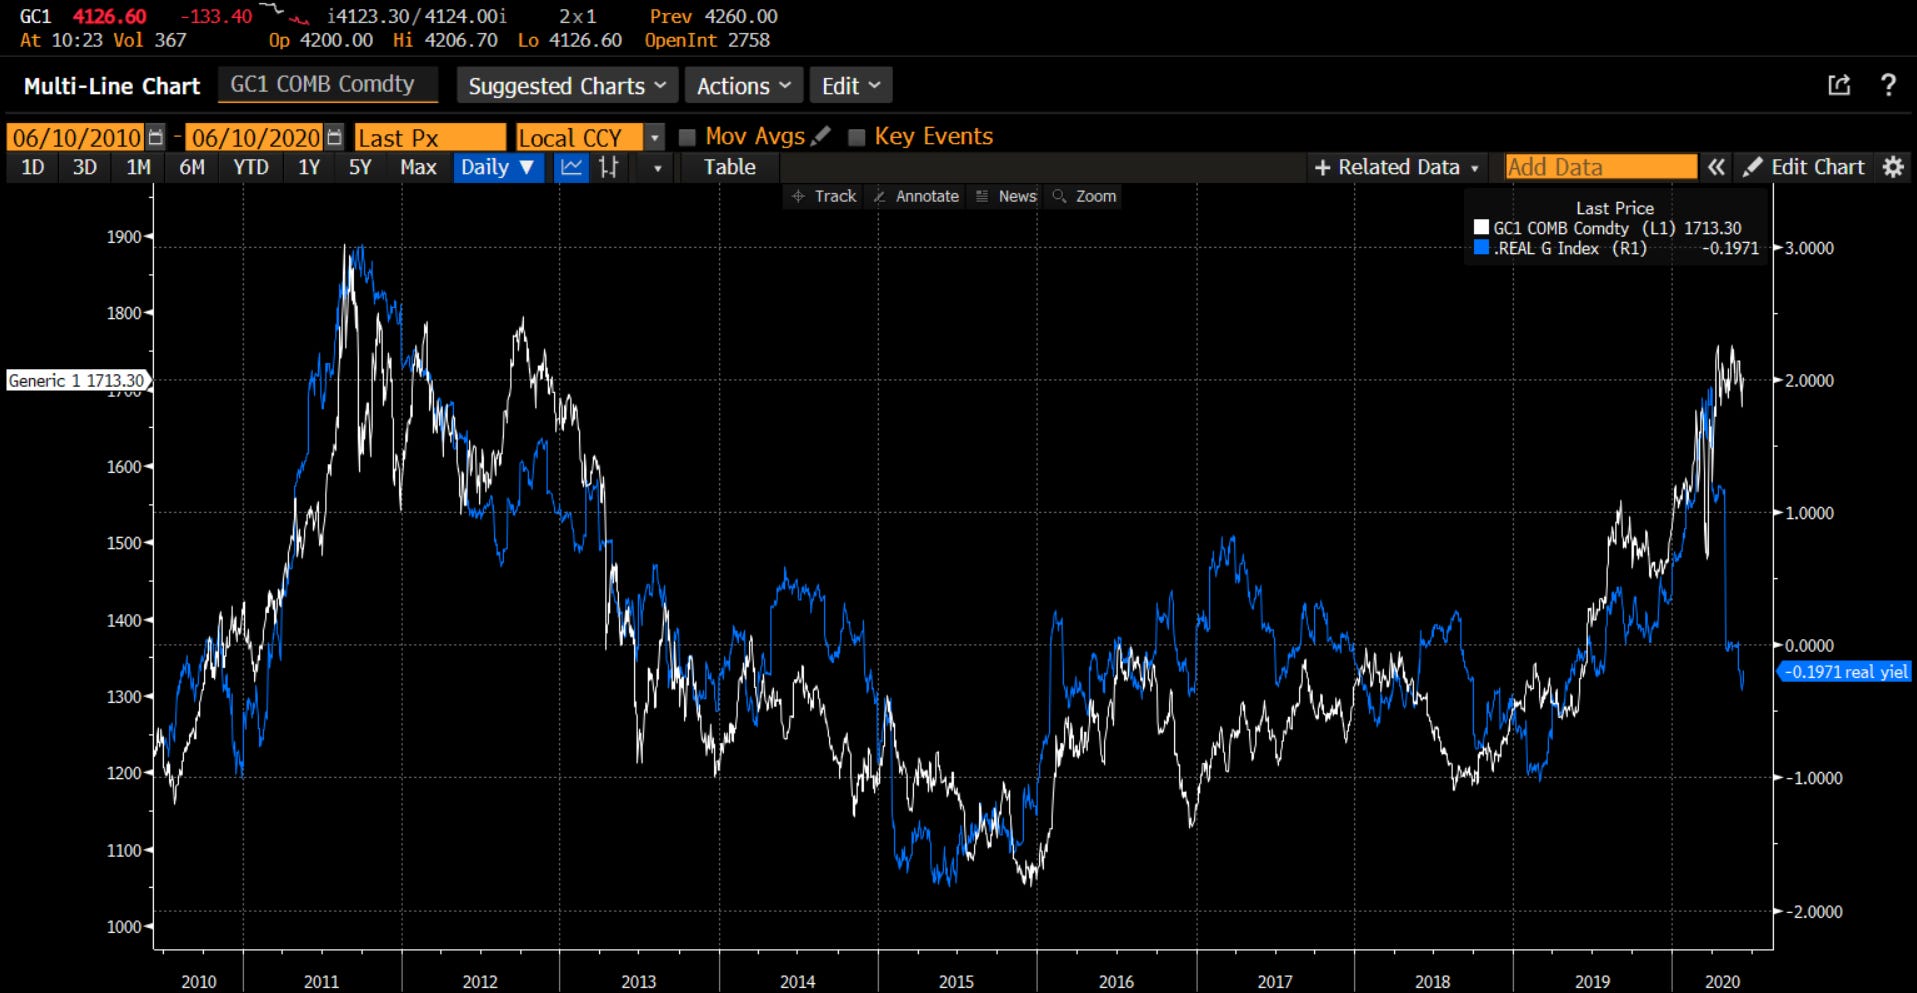
Having spent my early, formative years in FX and precious metals, I am well aware of the connection between gold and real rates. In fact, there was a clear negative relationship between real rates and the price of gold. I show this in the chart above where I invert real rates and compare to gold. The connection: higher real rates mean higher carrying costs which means lower gold prices and vice versa. However, at the far right of the chart, you can see Covid changed that relationship.
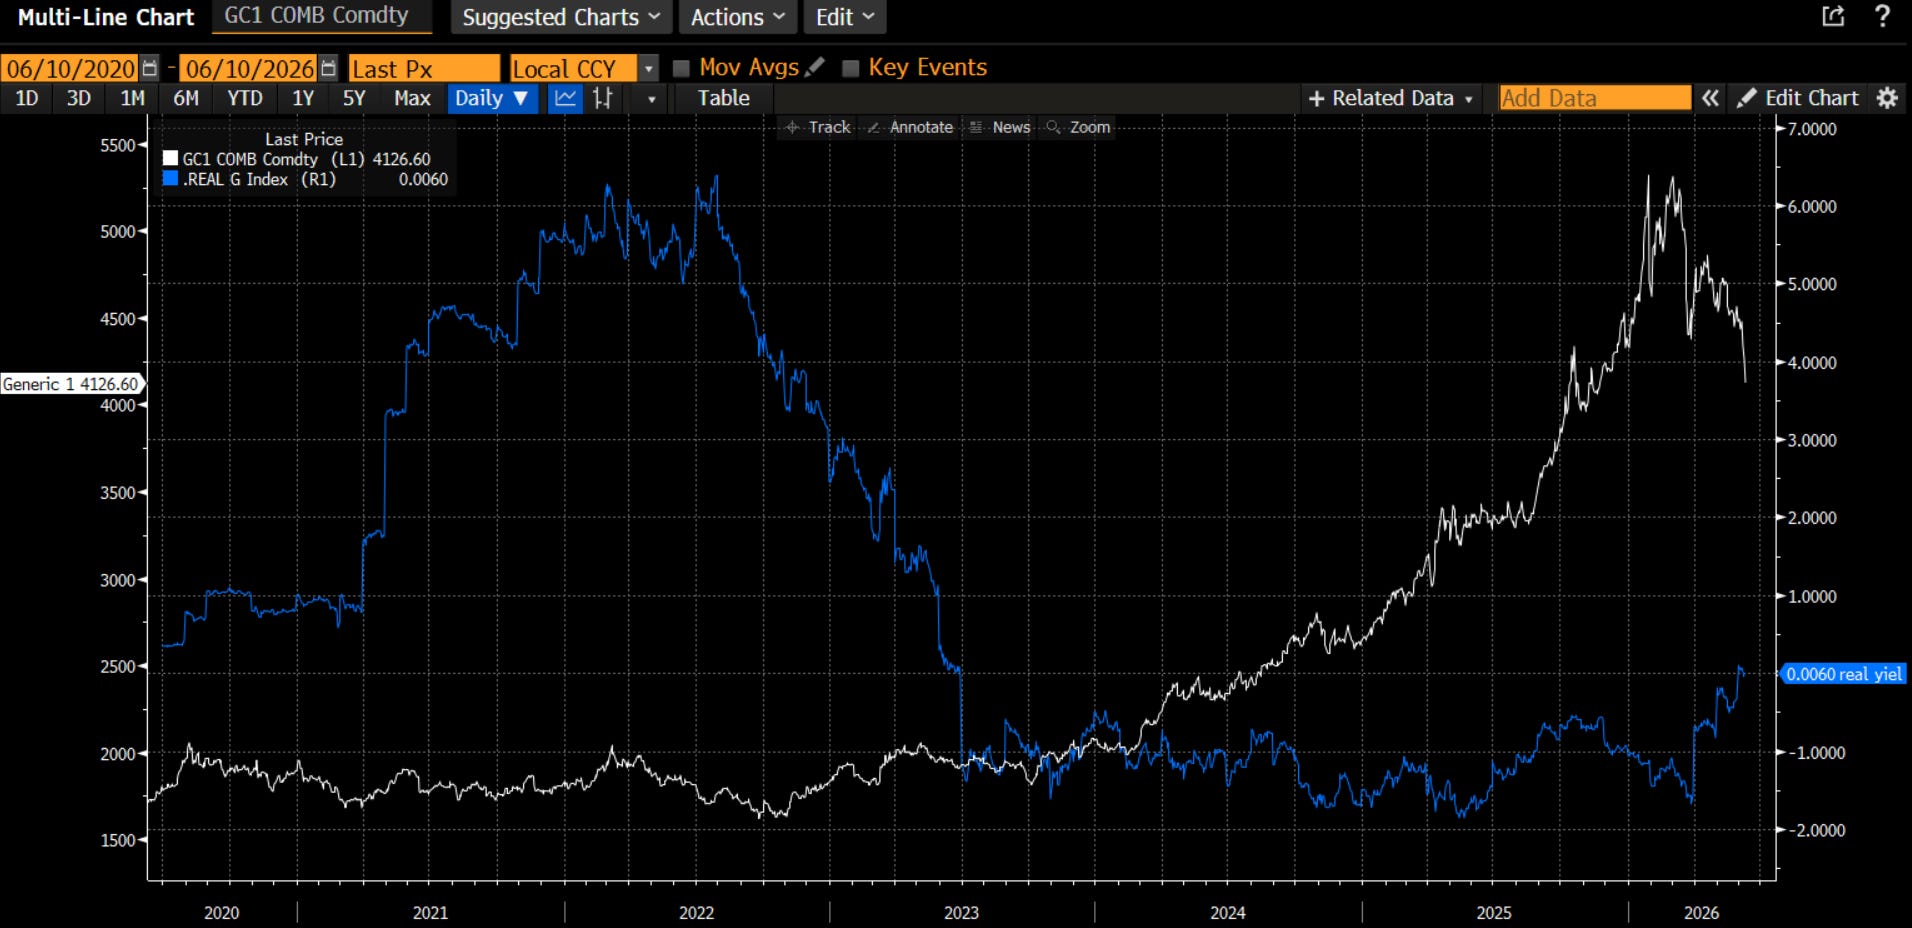
Since Covid, the relationship has completely broken down. Instead, the market has not been worried about carrying costs but more worried about the debasement of the Dollar because of overly aggressive fiscal spending and the lack of restraint from the FOMC. In fact, most might tell you the Fed has been complicit in helping government monetize this debt that was taken on.
However, there are a couple of things going on. The new Fed Chair may not be as dovish as first thought. He has brought in a couple of advisors who are seen as being hawkish. In addition, the commentary on Warsh of late has focused more on his desire to reduce the Fed balance sheet and less on rates. This, along with the data, is likely leading to the repricing of Fed Funds futures. In addition, the fiscal stimulus has fallen considerably. Is the gold market re-thinking the debasement trade and starting to focus on real rates and carrying costs again?
Stocks
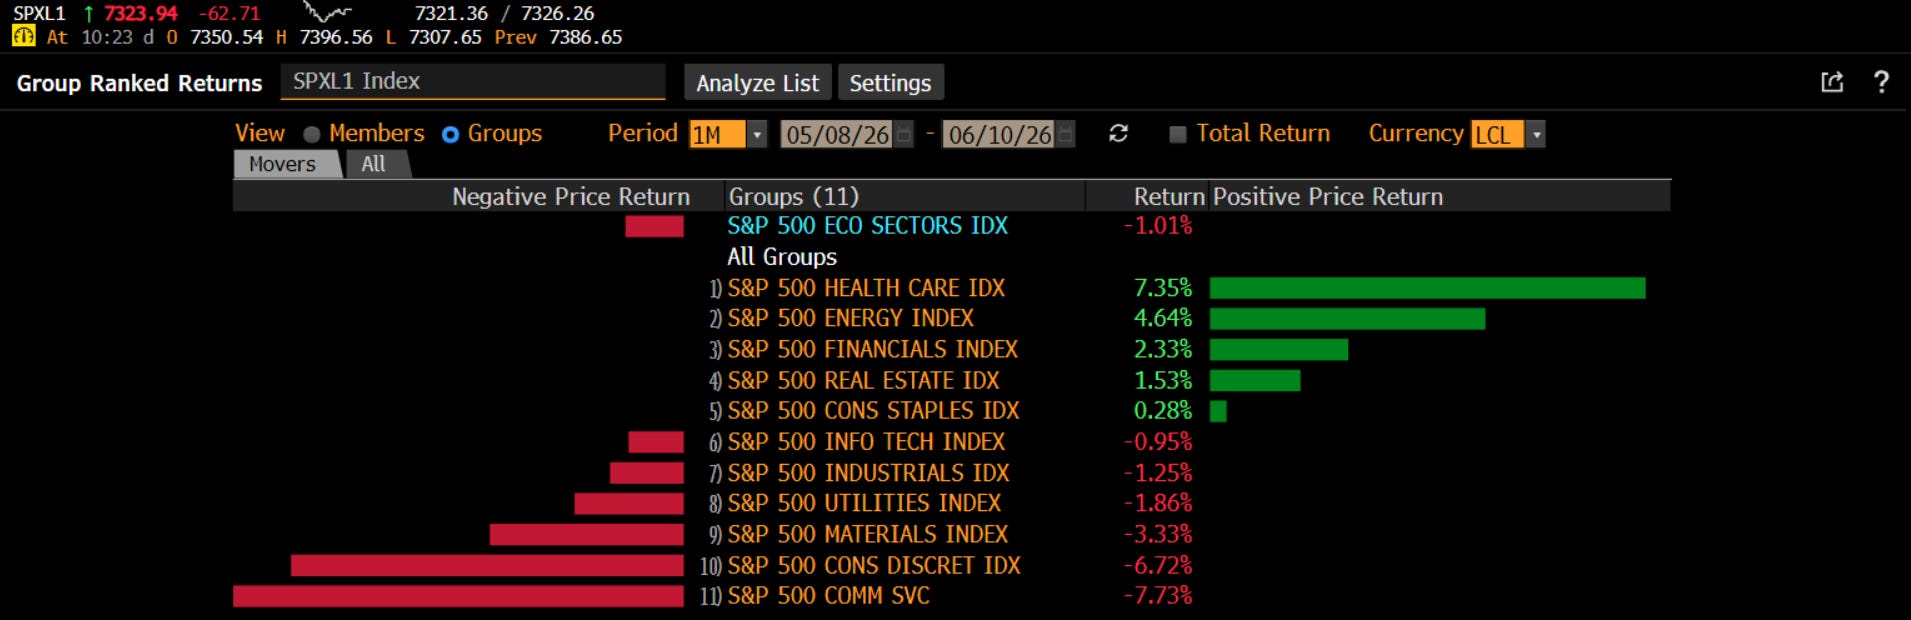
Over the past month, the commentary has been about the continuation of the move in semiconductor stocks, which went on a historic 100% move from the end of March until early June. I have to think any equity portfolio manager is either happy or sad based entirely on their exposure to semis. However, in aggregate, over the past month, the market is down about 1%. In addition, over this period, the broader move in sectors has a lot less to do about tech and AI. Leading the pack are health care, energy and financials. Bringing up the rear are consumer discretionary and communication services. What is this saying about the market’s view of the economy.
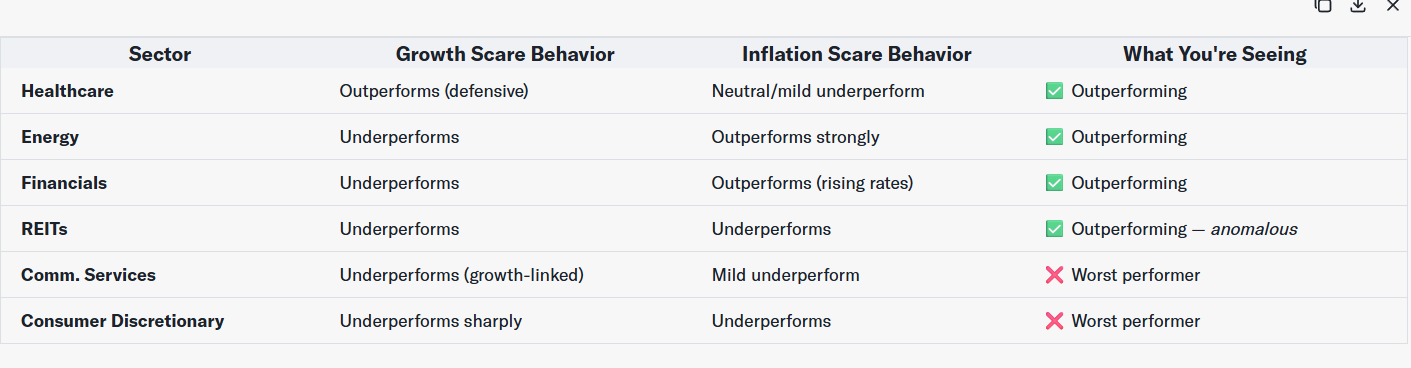
I turned to Yahoo Scout embedded in Alphaspace on Yahoo Finance. I asked the question about this sector performance and inquired how each of these sectors does when the market is having a growth scare or an inflation scare to gather a sense of where the market is concerned. You can see in the table above what Scout says about this sector performance but then I asked for the summary and this is how AI sees this sector performance:
The Macro Quadrant This Maps To
Using the framework from your earlier session:
This is the Stagflation quadrant, leaning toward its growth-scare boundary.
Not pure Reflation (which would have Discretionary and Tech holding up better)
Not pure Recession/Deflation (Energy would be the worst performer, not a leader)
Not Goldilocks (obvious)
Stagflation or late-cycle growth scare fits best: inflation pressures perceived as sticky (Energy, Financials holding), while growth expectations are being marked down (Discretionary, Comm Services sold off, Healthcare bid)
The market is essentially saying: “We don’t think inflation is going away, but we’re also starting to doubt growth can hold up against it.” That is a particularly uncomfortable combination for equity investors because it limits the Fed’s ability to ride to the rescue — cutting rates risks re-accelerating inflation, but holding rates risks choking growth further.
I would concur that a market led by Health care and Energy, with Consumer names lagging, is a market that is worried about Stagflation. This is what I talk about and teach in my Applied Portfolio Management class.
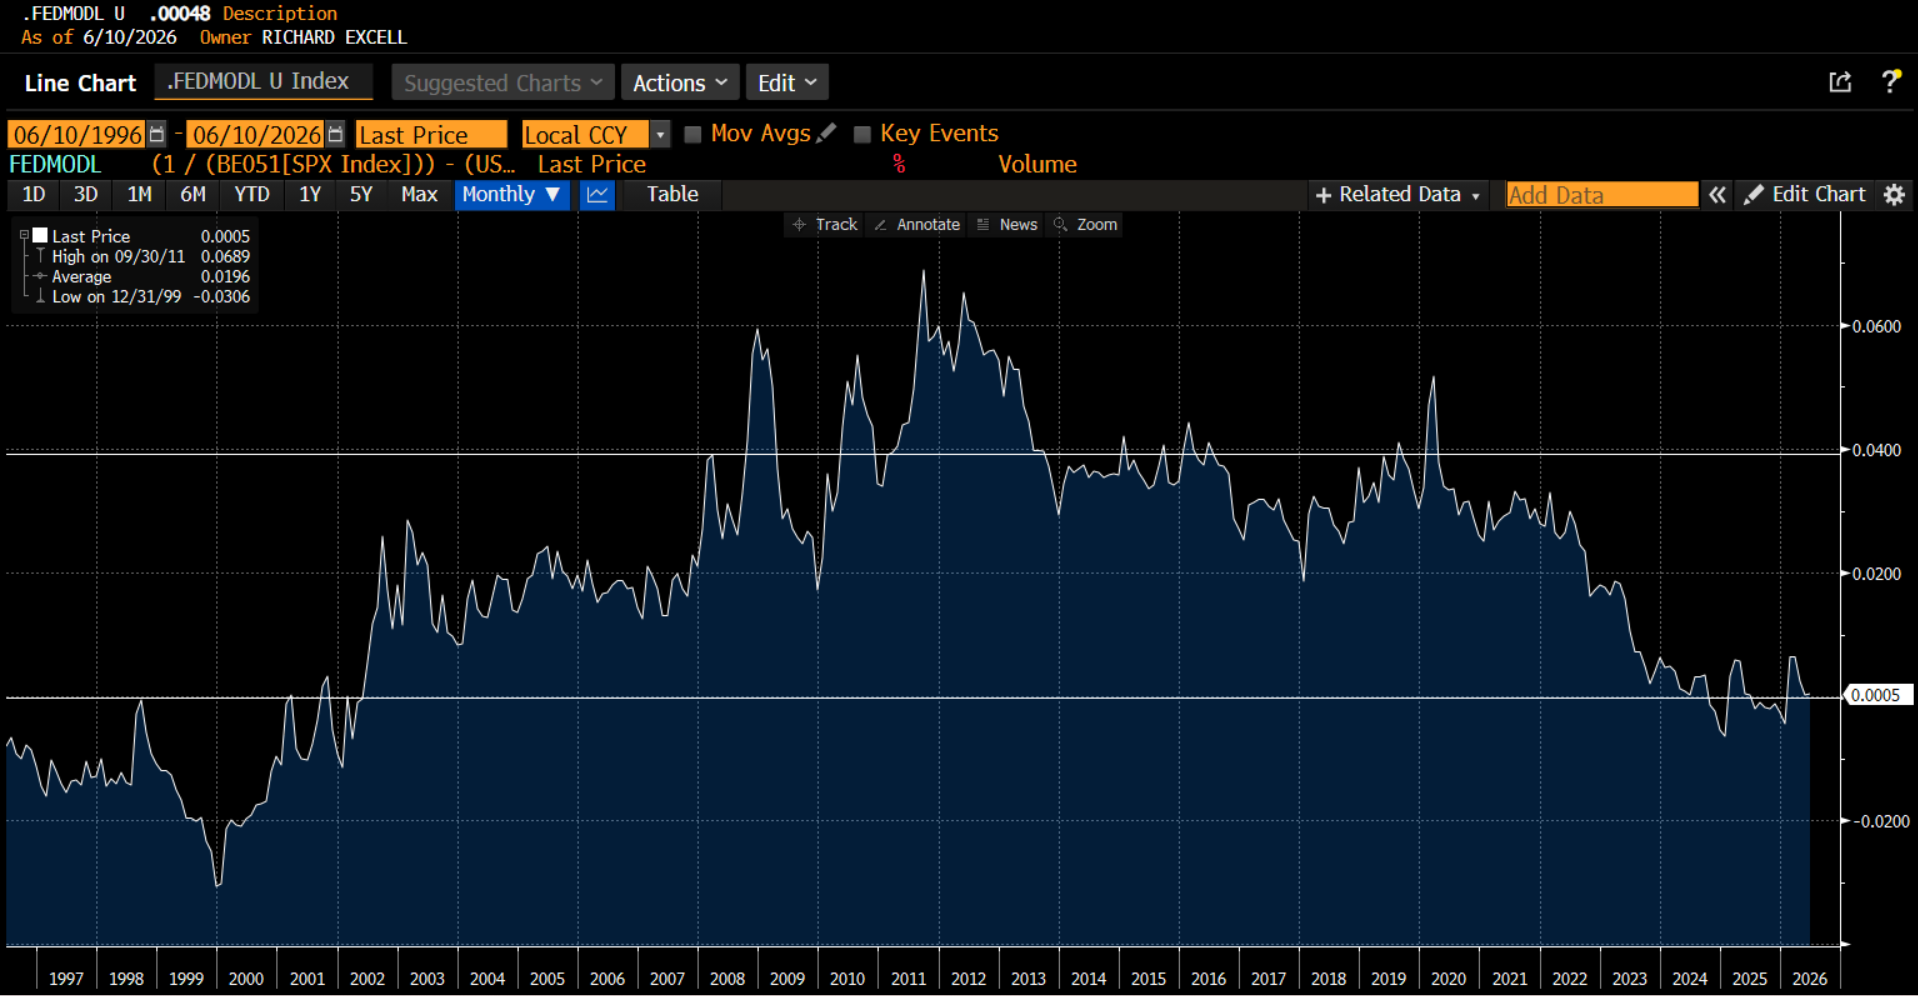
A market focused on Stagflation will be intensely focused on earnings growth for sure. I have shown in the past that this has been a critical driver of stock prices. The assumption was that multiples, having already corrected, would stay relatively flat. The incremental focus on inflation, however, potentially puts more pressure on multiples. If we use a basic Fed model approach - comparing the earnings yield on stocks to the 10-year Treasury yield, we see that stocks are still very overvalued. They can get more so, as they did in the late 90s. However, the equity risk premium has tended to average 3-4% over the last 30 years. If the multiple begins to move back toward that, driven by a move above 4.5% in the 10-year yield, and stocks could start to suffer. 4.7% 10-year + 2% equity risk premium implies a multiple of 15x vs. the current 22x. If that adjustment happened over the next 6 months, even if we got the expected earnings of about $375, the SPX would be 5625 vs. today’s level. Inflation and yields will play a big part in the equity market.
Crypto
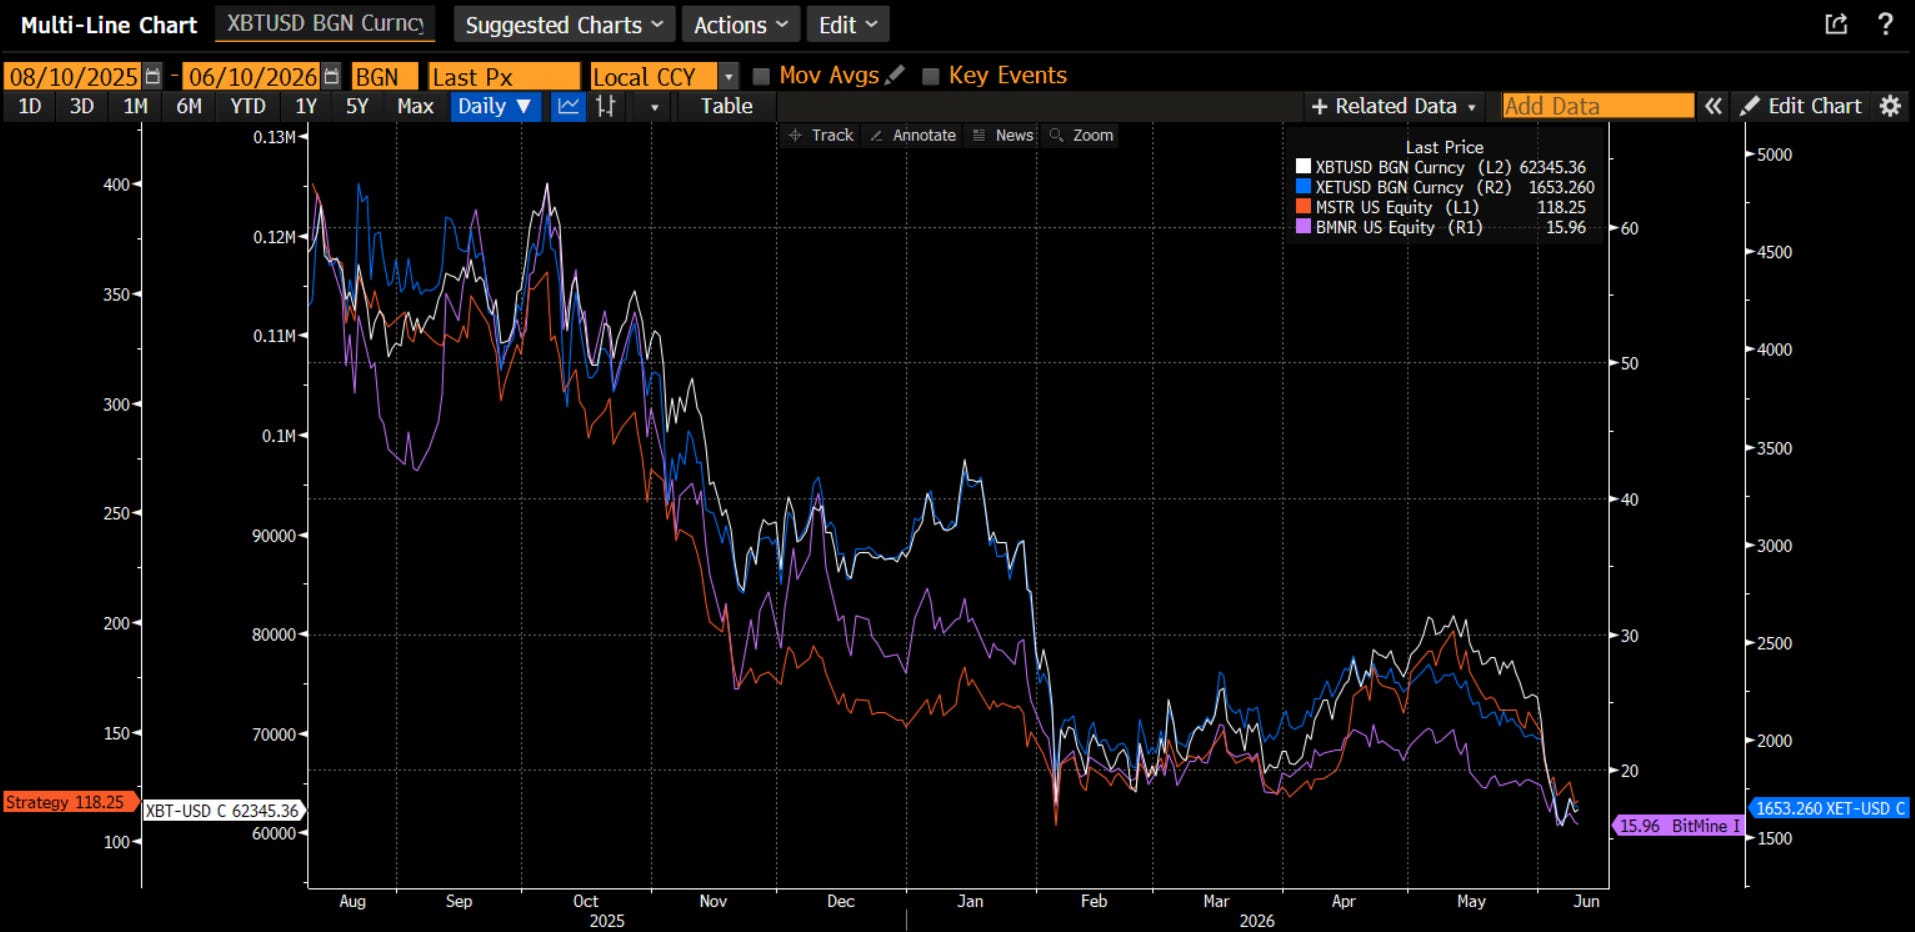
Another beneficiary of the debasement trade was crypto - Bitcoin and Ethereum. The rally in these two markets led to the creation of the Digital Asset Treasury companies. The unwind of the debasement trade is now putting pressure on the DATS (Strategy led by Michael Saylor and BitMine Immersion Technologies led by Tom Lee) which creates a negative feedback loop. Crypto winter looks set to continue with the market no longer focused on Dollar debasement. While I still believe there are medium and long-term drivers such as stablecoins and asset tokenization, I am not naive enough to think this negative sentiment can’t continue as faster money is flushed out of the ETFs. Fed dovishness around Covid drove crypto higher in 2021. Fed rate hikes in 2022 coincided with a crypto winter. Fed dovishness again in 2024/25 drove crypto higher. Rate hikes and Fed hawkishness are clearly not helping crypto.
Inflation
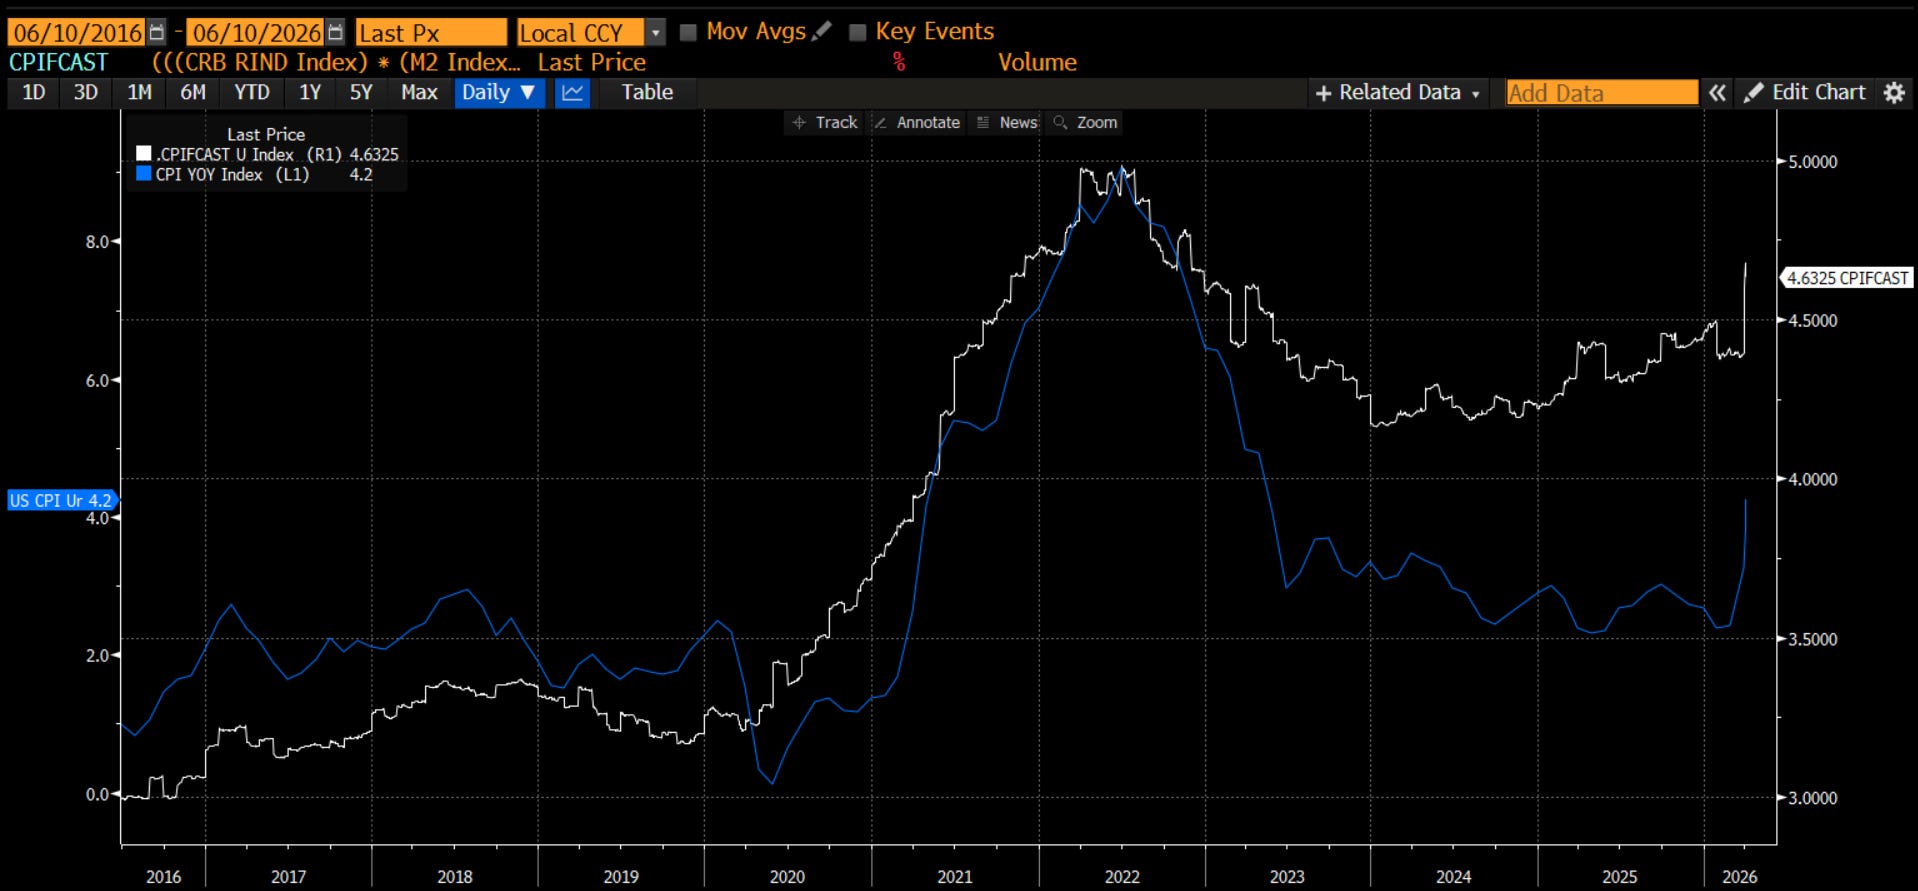
Every market, therefore, seems to hinge on inflation and the Fed’s reaction to it. I have shown before my simple CPI forecast measure, which looks at M2 growth, inflation expectations, commodity price changes and PPI. While it disconnected in 2024/early 25, it has been pointing to higher inflation and we are seeing that.
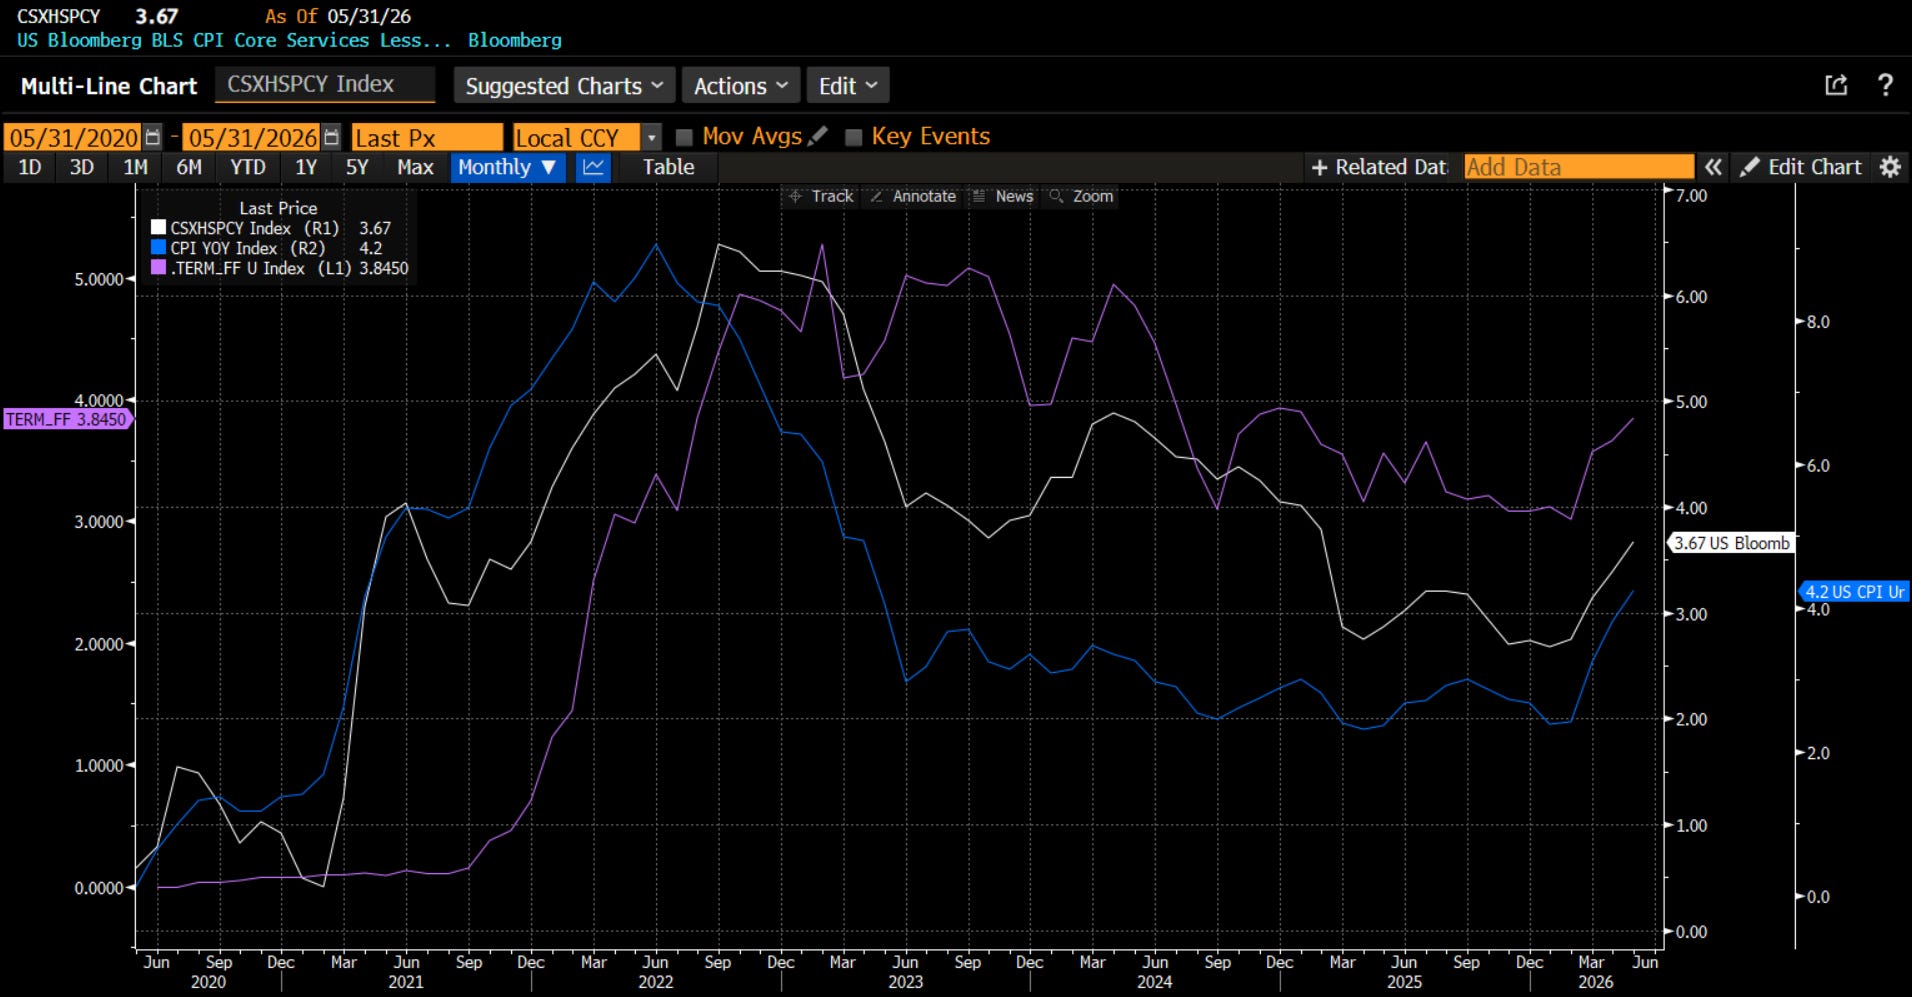
It doesn’t matter what I think, what does the Fed think? Jay Powell introduced the idea of a ‘Supercore’ which is core, ex-housing, services inflation. He was trying to capture the critical driver of inflation from a consumer perspective. This Supercore has been stickier than headline CPI, but now both are again moving higher. I overlay this versus the terminal Fed Funds interest rate. Not surprisingly, it follows both with a lag. All are pointing higher right now.
Not everyone is a hawk on inflation and Fed Funds, however. Nancy Lazar at PiperSandler is an economist that many hold in high esteem. She thinks inflation continues to move lower as she lays out in her note today. While I agree with Nancy on growth (we are both more bullish than consensus), I do not agree with her on inflation. She sees the economy in positive growth and declining inflation, the sweet spot for stocks. I see strong growth but higher inflation, a mid-cycle market. The market is worried about late-cycle stagflation. There is a trade out there for someone.

Kevin Warsh in now the new Fed Chair and has his first meeting next week. Inflation and growth are clearly going to be the focus, as they always are. The market will be intently focused not on what the FOMC will do (there is no move expected), but more importantly on the commentary toward how the FOMC now sees the jobs and inflation backdrop. Concern on inflation will be negative for rates, stocks, gold and crypto. Concern on growth could be negative for stocks and commodities but positive for rates and may give a relief to gold and crypto. Are Kevin Warsh and the Fed now the common thread that is weaving through the markets? I think so.
Stay Vigilant

Thanks for an insightful post.
I agree that we are moving toward ( perhaps already in) a late-cycle stagflationary phase. But I think there are real limits to the Fed’s hawkishness here.
ISM is barely above 50, wage growth is still below 4%, and the economy does not look like a classic demand-overheating story. If the next inflation impulse comes mainly from commodities and supply shocks, it is not obvious that the Fed can remain sustainably hawkish without doing real damage to growth.