


Dazed and confused
If you aren't sure if there is a hard landing or no landing, rate cuts or rate hikes forthcoming, or whether AI stocks are in a bubble or not, stand in line. A lot of people feel the same way


We had a debate in my Applied Portfolio Management class on Thursday. I had ten different student teams build models to forecast the economy. They build models to forecast both growth and inflation. As I tabulated the results to begin the debate, they fell into three categories: growth rising and inflation falling, both growth and inflation rising, growth falling but inflation rising.
Basically, we were all over the place with the exception that no one saw a hard landing where both growth and inflation were falling. This is interesting because if we go back to when the FOMC first started hiking, and we forget this, Jay Powell told us they likely would have to slow the economy and cause job loss in order to slow inflation. However, few people are considering that as a possibility right now.
The class did a great job of making their points, listening to their peers views and debating respectfully. I said many times during the debate, if you are confused, you are feeling like many people in the market right now. In fact, I might argue that anyone who is very confident in their views is not watching the right movie, or at least not all of it. As I wrote two weeks ago, there is good news, bad news and ugly news. As I wrote last week, there are potential catalysts that the market is not pricing in. That is not to say there is an imminent decline in the market or slowdown in the economy. It just means that all signs are NOT pointing in the same direction.
When I find myself feeling this way, I go back to the basics and organize my thoughts into three buckets: Fundamentals (of the economy, which drives stocks), Behavioral (flows, sentiment, valuation, options data) and Catalysts (what will happen that gets people to change their mind). It is in that spirit that I put together the Stay Vigilant this week. Let’s get started.
Fundamental
One of the core indicators I like to look at is the Fundamental Stock Indicator. I think it has its roots in the work of noted strategist Ed Yardeni. At least that is who I learned about it from. It has a terrific long-run relationship even though it has dislocated a bit of late. That said, a lot of data has problems with distortions as a result of Covid and the response to Covid.

The intuition for why it should work has logic. The FSI is a geometric index of jobless claims, consumer confidence and the CRB raw industrials commodity index. If people are employed, it should be a good sign for stocks and vice versa. If consumers feel good, they will be spending and vice versa. The raw industrials is probably one you may not be familiar with. It tracks a basket of commodity prices that are NOT publicly traded. The logic is these are commodities that only companies who produce them or use them have a say in. There are no investors in these products to distort price. Thus we get a cleaner picture of supply and demand.
You can see above that the FSI gave us a picture of a gently slowing economy in 2022 when the market was predicting much worse. We can see that since the summer of last year, it has been gently rising while the market is now over-reacting on the upside. While the FSI is showing some modest upside, the market is showing a much more aggressive response.

Another of my favorite indicators is the ISM for many reasons I have shown before. The last reading came in at 49.1 which is below 50 and rising, the single best time to own stocks. If we look at the ratio of new orders to inventories, which does a good job of leading the ISM itself, it is still pointing higher, giving bulls even more reason for optimism. Another measure that can lead the ISM, on a much shorter lead time, is the collection of all regional Federal Reserve surveys - NY, Philadelphia, Chicago, Dallas etc. This one is not so sanguine. We will know more this week as we get the ISM on Friday.
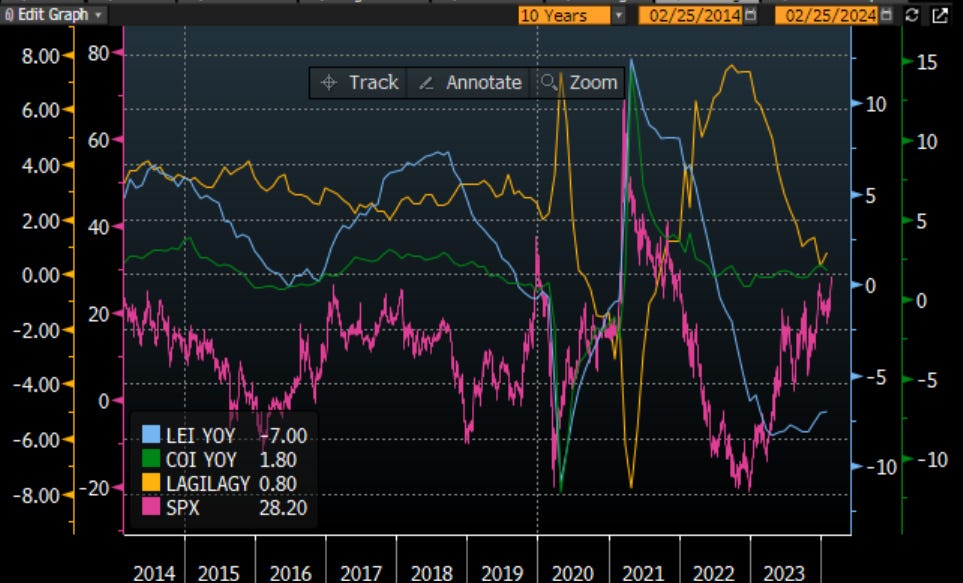
Other data to look at is the Leading Economic Indicators. On this graph I show LEI as well as the Coincident and Lagging indicators. I hope you can see why LEI are the only data to look at if we care about anticipating the stock market. I hope you can also see that the stock market has dislocated from the LEI of late. The data that goes into the LEI are: SPX Index itself, Conference Board leading credit index, Yield curve (10 year vs. Fed Funds), Consumer expectations, ISM new orders, Building permits, average weekly hours, Manufacturers new orders and jobless claims. The Conference Board itself said that while 6 months ago the LEI were forecasting a recession, they are no longer forecasting as such.
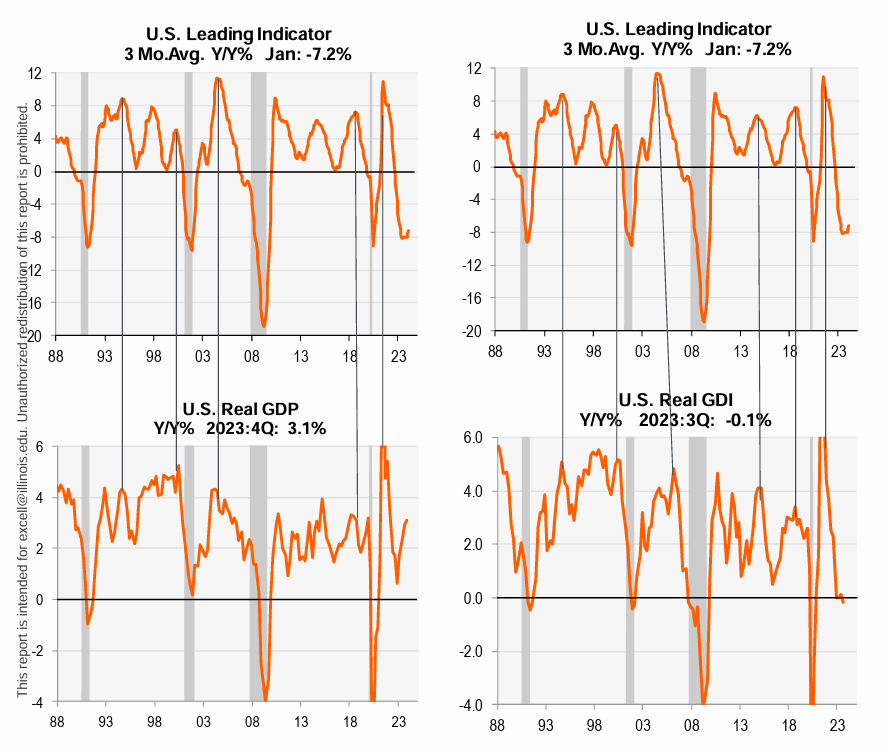
Nancy Lazar, who I reference last week, is also looking at LEI. She is looking at them in relation to GDP and GDI which we mentioned last week. On this front, she is still sticking with a recession call, based on what LEI is telling us about GDI. She isn’t totally along on Recession Island right now, but it is getting lonelier every day.
We will get a good look at the data in the first week of March. For now, there is some good news and some bad news. As much as I can find some macro data suggesting a recession is forthcoming, my own personal anecdotal evidence corroborates the good side of this story. The suburbs of Chicago are booming right now. Showing no signs that higher rates matter. Admittedly, Chicago is not impacted by the layoffs in investment banking or software engineering to the extent that NY and SF/LA are. However, Chicago is in the sweet spot for the transport of goods and people around the country. Right now it feels pretty good.
Behavioral
The next category I go through I call the Behavioral category. It tries to assess the supply & demand of the market. While the Fundamentals try to ascertain the WHY of the market, this category is trying to ascertain the WHAT, WHERE and HOW. The last category will look at the WHEN.

The first stop is the CNN Fear and Greed Index. It is a collection of market variables itself and is a good stop to quickly gauge how investors are feeling. They are feeling pretty darn good, maybe too good. You can see that over the last month, we have moved from Greed to Extreme Greed. Five of the seven variables it tracks are in the Extreme Greed zone. This is a time when investors should be a little more cautious than normal.

I also look to the daily technical charts. The chart for the SPY is solidly in an uptrend. However, there is one thing I notice that gives me some pause. You can see that as the market is making new highs this week, the relative strength index (lower panel) is diverging. This negative divergence is a bad sign and indicates we could well see a correction from here. Again, this would suggest some pause.

Looking at the EFA, or the rest of the developed world outside of the US, we see another set of stocks making new highs. However, we do not see negative divergence here and the MACD is turning up. This is surprising to see given that the UK, Germany and Japan are all in recession now. However, these countries also focus a fair bit on exports, so while their domestic economies struggle, this does not mean their stocks need to. I think the most interesting story of these is the Japanese stock market, which made a new high this week after 35 years. I wrote about it on Linked In (if you haven’t connected with me there, please do so).

Chart of the Day - land of the rising sun ... & stocks
The headlines today are about Nvidia. Heck, those were impressive numbers in a stock where the expectations were quite high. The stock is up 14% adding about a quarter of a billion of mkt cap. Nasdaq is up 2% just in sympathy
However, I think the more interesting story of the day is the Nikkei reclaiming its all-time high 35 years after the last peak. Think about that. A LOT has changed in the world since 1989, the last time the Nikkei was here
At that time, the Nikkei represented 37% of all mkt cap of stocks in the world vs. the US at 29%. Hopefully that gives some people perspective that when we speak of the bubble in Japan, we were just talking about some secondary mkt somewhere. It was THE mkt
US companies were changing business models to be more like Japan. As I was completing a minor in Japanese studies & studying in Japan in 1989, the thesis that I wrote was all about Japan Inc & how US companies sought to become more 'Japanese'
W. Edwards Deming was an American statistician in post war Japan who helped with the Japanese recovery & instituted 14 principles toward total quality management & just in time inventory. Jack Welch from GE was a disciple & the American industrial complex shifted. We may even suggest globalization had its roots in this
Taggart Murphy was an investment banker at Goldman in Japan who witnessed the greatest transfer of credit in history & wrote about it. Between 1981-88, America turned itself from the greatest creditor nation into the greatest debtor. Japan gained these surpluses. America suffered from too much fiscal stimulus. Sound familiar?
What was the catalyst after decades of decline driven by massive demographic headwinds? I think most would say it was the 3 Arrows policy of the late Prime Minister Abe
Massive monetary easing, fiscal stimulus related to infrastructure & an aging population, & corporate reform. The former has led to inflation in the country which is finally getting companies to invest & not just cut spending. The latter may be the biggest driver though
Gone are the cross-shareholdings, golden parachutes & old boys network linking companies to companies & government to companies. In is a focus on improving shareholder value, getting more women in the workplace, being more open to foreign workers & pushing Japanese culture (food, clothes, culture) around the world
When the rest of the world was doing everything it could to halt inflation, Japan said 'send it our way'. This has worked like a charm as Japan has outperformed the SPX by over 30% since the start of 2022
The question is always - can this continue? Is this all ephemeral? Is it really structural change or just manipulated price action as the BOJ owns most of the stock & bond mkt?
These are the right questions to ask, but for me, I think it is the story of the day, maybe the story of the year
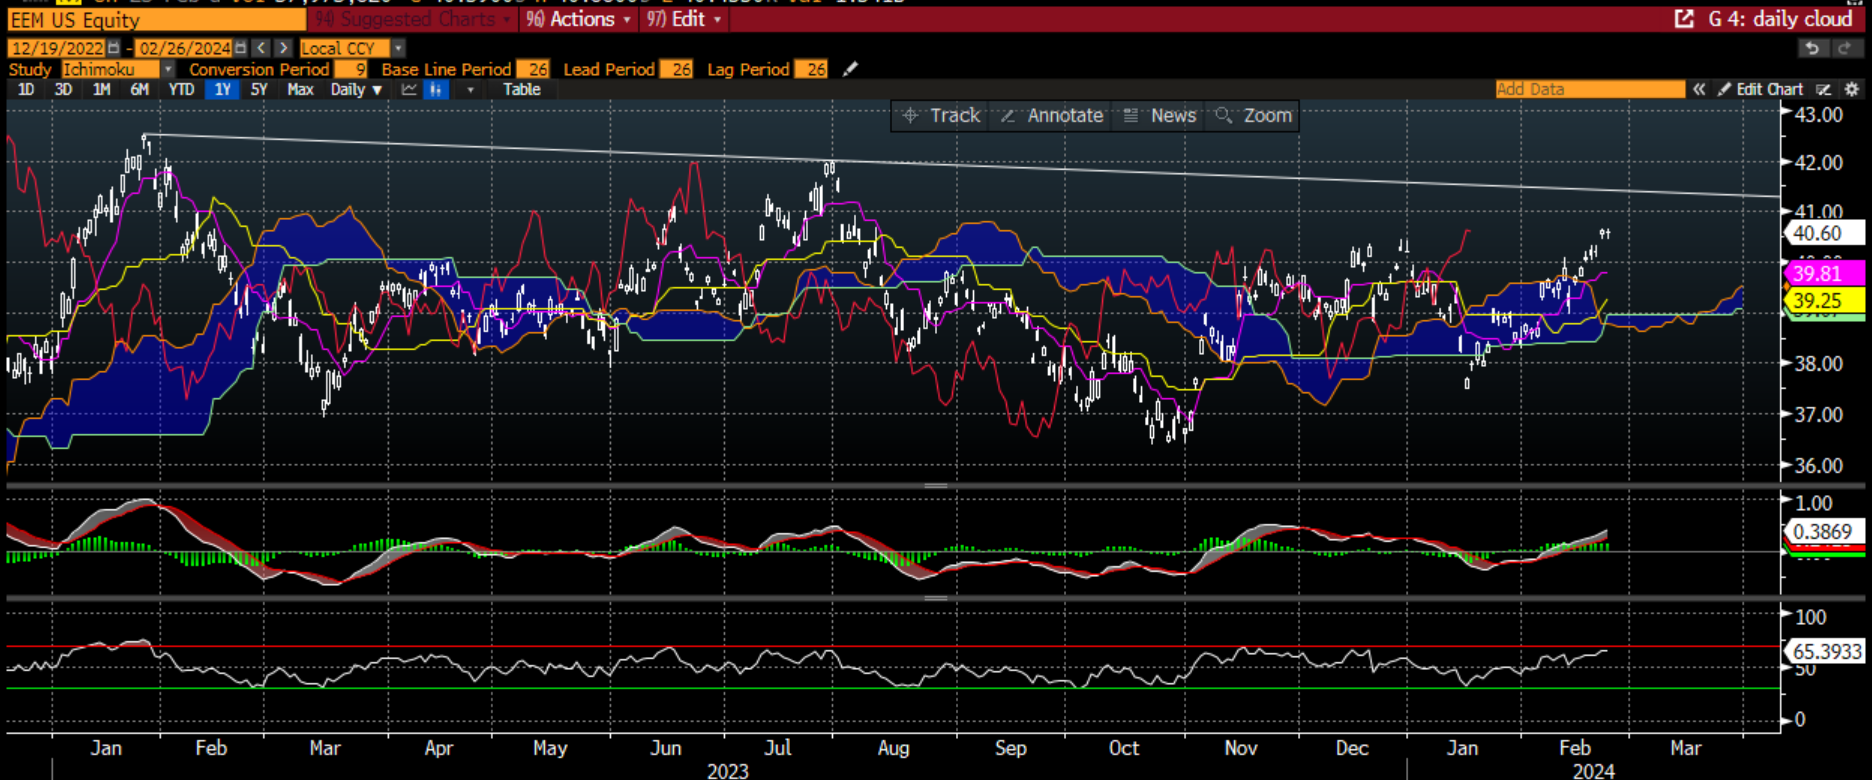
Emerging markets are another place to look. Again, another positive chart with no negative divergence, looking like it wants to move higher. This index has been weighed down the last 3 years by the high weight it has to China. Based on performance alone, this index is moving more toward balance, with China’s weight reduced (though still the largest) and India’s much higher. The two largest holdings are Taiwan Semi and Samsung, both benefitting from the AI wave right now.

Don’t forget that the relative performance of EM vs. the US has a great deal to do with the Dollar. EMFX, EM stocks and EM bonds are all highly correlated. Money either flows into or out of the region. The Dollar right now might be giving support to the rotation out of the US and into EM, in spite of the weakness in China. Are we at an inflection point?
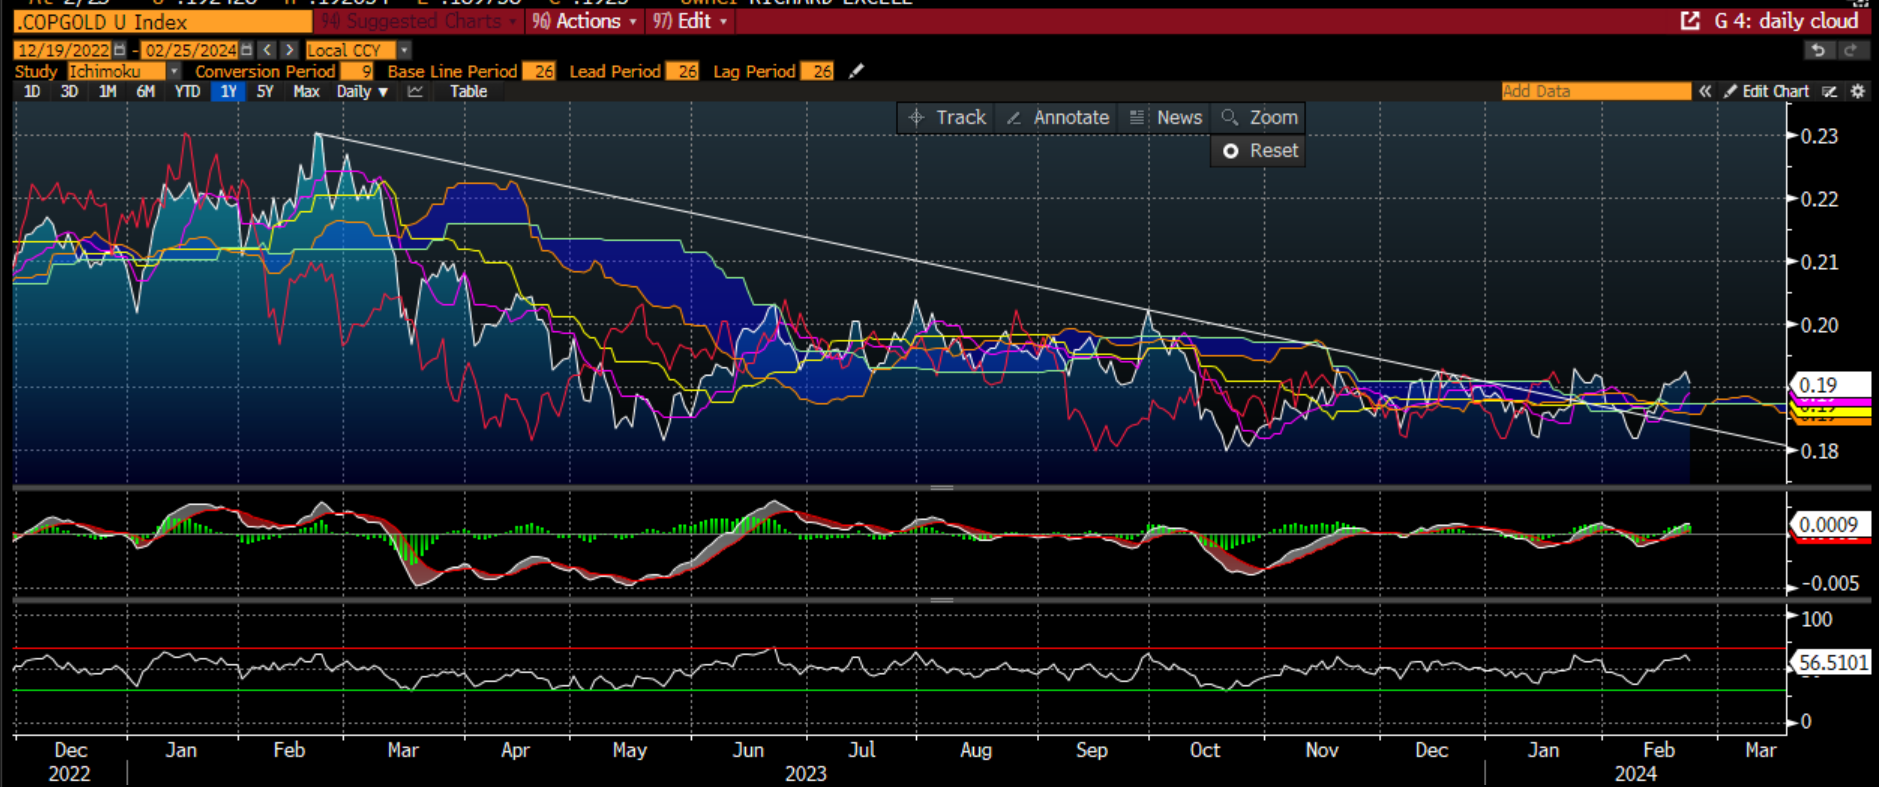
I like to look at the ratio of Copper to Gold. Both Bill Gross and Jeff Gundlach, the former and current Bond Kings, say that they use this ratio to help give them a guide to 10 year US Treasury yields. It is a great measure of global growth as seen through the eyes of the commodity market. This measure has been weak for some time. As I said, UK, Germany and Japan are all in recession. China is too though it won’t admit it. However, the recent uptick and breakout of Copper to Gold may be telling us that global growth is about to turn higher. This is definitely an index to watch. This would suggest much higher US Treasury yields, which implies no Fed cuts any time soon.
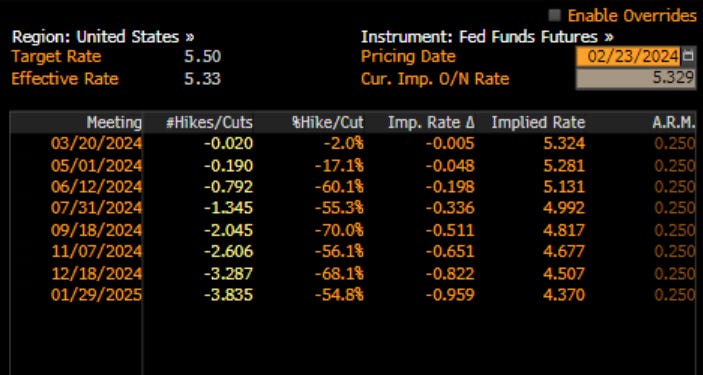
Speaking of Fed cuts, there are still more than three cuts priced in for this year. I just don’t see this and wrote about that this week in my "Excell with Options” for the CME Group: EWO_SOFR. I looked at the SOFR market and explored the possible trades if there were no rate cuts.

Mr. Risk goes a step further, and explores the possibility of Fed rate HIKES and not cuts. Larry Summers got people talking about the possibility this week. If rate cuts get priced out, not even saying hikes are priced in, the SPX will suffer as multiples compress. I would think the Dollar rallies, though, too, which would suggest EM does not outperform. This would be the Ides of March scenario.
Investors are not the only ones feeling enthusiastic right now. We have seen many mergers and not just in the energy patch (which has seen some mega deals). I wrote about the deals, and the importance of these deals, on Linked In this week:

Chart of the Day - merger Monday
Well, it is synthetic Monday at least because of the holiday. Today I opened up my laptop after the drive south and was hit with two headlines about deals in the US
The first was a bigger one - Capital One buying Discover Financial Services. This is not only a large deal but has very real strategic ramifications with Capital One potentially moving off of the VISA network onto its own network
The second was smaller but still strategic. Walmart buying Vizio. We all know Vizio as the TV company. Some didn't know that in 2016 a Chinese firm tried to buy California-based Vizio but the deal was rejected ... by the Chinese
Strategically, many may recognize that there are a lot of Vizio TVs sold in a Walmart competitor - Costco. Thus, while this deal is smaller, it does have ramifications for the competitive landscape
Stepping back, simply seeing some deals return to the market is a good thing. I can tell you that the buzz among students is that investment banks had meaningfully pared back their hiring in 2023 and this was having ripple effects throughout the job market for young talent
The buzz among the I-banks was that 2024 was going to be a better year, which would create a much better hiring environment for the students, and even young alums in the marketplace
It has been a while since we walked in after a weekend to some bigger deal news. Of course, this news has a lot more to do with getting costs out of the supply chain than it does potential growth, but regardless of the rationale, it is welcome news
The chart today shows mergers & acquisition news over the last 10 years. You can see the big drop-off in 2023 from the previous years trends, this in spite of the stock market being at or near all-time highs
The argument given was that buyers and sellers couldn't agree on price, with buyers wanting 2022 discounts, but sellers wanting 2021 type prices. Well, once deals start getting down, we will start to establish some precedent, at least in some industries
This has the potential to unlock a wave of private equity-owned companies coming to market, seeking the exit that has been on the come for a couple of years. As these deals get done, M&A or IPO, the money can flow back into other private market deals
The flow and availability of capital will change on that if the trend continues. Of course, it is not all perfectly rosy. If money is flowing and deals getting done, it may suggest fincl conditions ease further putting upward pressure on inflation, keeping the Fed involved
However, I think most would suggest this would be a good outcome even if the FOMC is still paused and not cutting, because the upside of more transactions, more fees and more jobs outweighs the cost
It also tells you that 10yr yields around 4.3% and corp yields around 6% are plenty low enough for deal to make sense
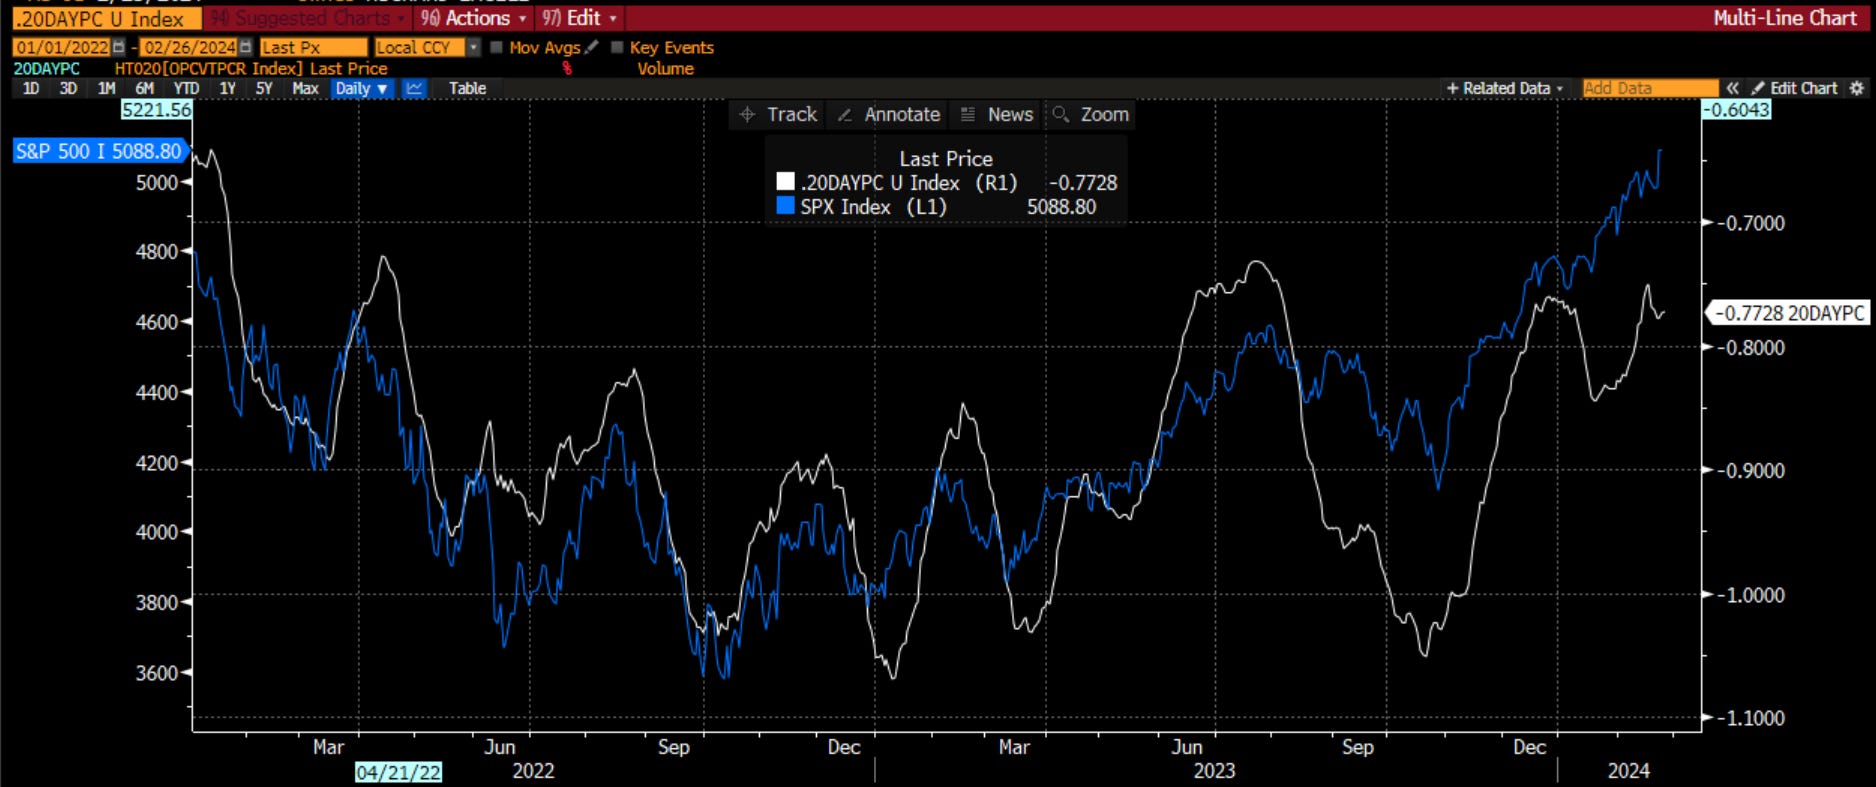
Finally, my favorite short-term indicator is the 20 day moving average of puts to calls. I have inverted it here for simplicity, but when there is more demand for calls relative to puts, stocks move higher. When the opposite is true, stocks tend to move lower. Right now it is indicating stocks should move lower. In fairness, the stock market largely ignored this call in January of this year. However, over the last several years, the market rarely ignores this.
Last year we had weak fundamentals but strong behaviorals. I think right now, we might be in a situation with the opposite happening. The fundamentals look pretty good, even though there are some signs of weakness. On net, though, the technical or behavioral picture looks weak in the short-term. I would be a bit cautious.
Catalysts
The last category is the Catalysts. It tells us the WHEN or it tells us when the bulls or the bears will change their mind. On this front, I wrote about two potential catalysts from this week and what we might think about them. I wrote about both of them on Linked In and put them here now.

Chart of the Day - tin foil hat
The notion of wearing homemade tin foil hat headgear for protection against electromagnetic pulses or mind-reading etc. has become a popular stereotype & byword for paranoia, persecutory delusions, & belief in pseudoscience & conspiracy theories.
Let me start by saying I am no tin foil hat conspiracist. In fact, I had the chance to ask the former head of the NCA a question about conspiracies & his answer was 'Do you really think people in D.C. can keep secrets?'
However, I have to admit a conspiracy came to mind yesterday. My wife called me from her work phone - never does - & told me her mobile phone was not working so if I needed to get in touch, I should call her there. Innocent enough. However, my son then said the same
A quick look online indicated that AT&T yesterday had a massive 12 hour network outage yesterday that affected thousands of people. 911 lines were flooded with calls, mostly with people just 'testing' if their emergency call would go through
Stuff happens, what can you do. For some reason it made me think about the power outage at the BP Whiting refinery just outside of Chicago. A transformer had failed at the facility. This caused the company to shut down the refinery, drain it of hydrocarbons & evacuate the premises.
Just a week before that, Lurie Children's Hospital, a major hospital here in Chicago, experienced a cyber attack that shut down its internet systems for a week, forcing it to go very old school, very quickly, in order to maintain the safety of patients
Fortunately none of these incidents were serious, but it made me think to myself, what if someone wanted to cause a great deal of problems in a hurry
Perhaps they would - cut off phone communications, attack refineries & power grids, & disrupt service at hospitals. They would likely also try to shut down the internet, at least in major locations
Perhaps if someone wanted to cause a great deal of problems & were thinking how to do it, they just might try, might probe, to see if it could be done. I mean, you wouldn't want to have grand plans you couldn't execute, right?
So this got me to thinking about the geopolitical risk index. Dario Caldara & Matteo Iacoviello construct a measure of adverse geopolitical events & associated risks based on a tally of newspaper articles covering geopolitical tensions, and examine its evolution and economic effects since 1900. They keep it up to date as well
The chart today is of zeroed in to the last 40 years. If you look at the current reading, it is at the highs of the last 40 years ex well-known terrorist attacks & direct military conflict. Risk is high & rising. Are risk assets pricing in risk that is high & rising?
Not to mention, I doubt this index is capturing the recent mobile phone outage, refinery shut down & hospital disruption ...

Bonus Chart of the Day - crushing it
NVDA crushed their results. The expectations were very high, and they exceeded them. It is truly something to behold
In my Substack two weeks ago, I discussed the comparison to CSCO and the internet because that topic has come up. At the time, I said that to be comparable, NVDA could actually probably double again. Not saying it would, but just saying if you are fading it on a 1999 comp, you are off
That said, a discussion with a student yesterday made me look at this today. NVDA current revenues are $60bb. Meta, Alphabet, everyone are ordering a ton of chips. How many could they order?
Refer to the revenue outlook for NVDA courtesy of Bloomberg. Revenues are forecast to grow to $168bb by 2028. You worried about the 32x Price/Sales ratio now? It is only 12x by 2028
But is $168bb realistic? I don't know but a quick search using some new AI tools found some of the following facts:
The expected total addressable market for AI chips in 2028 is estimated to be $132.58 billion USD
Nvidia accounts for around 70% of AI semiconductor sales
In 2023, approximately 40% of NVIDIA's data center revenue was for AI inference
The exact percentage of total revenues from AI chips is not explicitly mentioned in the provided sources
So let's make some assumptions, because that is what forecasting is all about. Let's assume that NVDA still has a 60% market share in 2028 for AI chips, down from 70%. Yes, it has a commanding lead but as we see with TSLA, the competition eventually starts to arrive
Let's also assume that 50% of NVDA revenues come from AI chips by 2028. That is up from an estimated 40% right now, though it isn't clear to be fair
60% share of a 132.58bb market is about $80bb
50% of $168 bb forecasted revenues is $84 bb
Close enough for government work
So to me, there are three data points I want to watch: Is the TAM for AI chips going to be larger or smaller than $132.58bb by 2028? Is NVDA market share going to be larger or smaller than 60% by 2028? Will AI chips make up more or less than 50% of NVDA revenues by 2028?
If we say that AI chips will be 60% of NVDA revenues or .6*168 = 100bb we are saying that either NVDA will have 76% mkt share or that TAM in 2028 will be 25% higher than currently forecast. Just saying
I have no idea the answers to any of these questions. I have no idea if the facts I presented above can be easily disputed. After all, it was a 15 minute search in an AI tool
I post this more to start a discussion. Please let me know your thoughts on this. This single stock, and the narrative it commands, are not only driving all of US stocks, but all global stocks, all views on the US economy, and even potentially many geopolitical decisions. I think we should talk about it
Putting it all together, as I told my students, it can get pretty confusing. Is it a hard landing or not? Is the Fed cutting rates or hiking them? What are we to make of AI? As I look through the aggregate of this, there are many things to like about the trend of the economy and markets. In the near term, though, it might be a better time to …
Stay Vigilant

Another great write up, Richard. Thanks!
Could you please elaborate on the relation between Copper/Gold and US treasury yields? Why would yields go higher if global growth turns higher? Is it that as growth increases, commodities go lower, US$ goes lower and therefore yields have to go higher to support US bonds due to lower demand?
BTW: the next leg up in NVDA's growth after say 2026+ will be less about GPUs and more about subscription based software in AI, industrial automation and next gen transportation. By then generic and custom/application specific GPUs will be aplenty, LLMs will be open-source and data will be supremely important - clean data, licensed data, content IP etc. NVDA's GPU product lifecycle will turn a corner and it will imperative for them to pivot to becoming a software company to maintain their dominance in AI.
"Nvidia accounts for around 70% of AI semiconductor sales" Wow!