"I don't think the heavy stuff is gonna come down for a while yet." - Carl Spackler
Everyone is gearing up for a recession right now because the stock market is pricing it in. What does that mean for the markets right now?
I can’t tell you how many conversations I have had in the past two weeks about whether or not the economy was going to go into a recession or not. For the record, I do think it will go into a recession. I will get that out of the way right now. The Fed has only managed a soft landing in 3 of the last 1 4 hiking cycles and arguably this one is the trickiest one they have to deal with. This tells me that the odds are not on their side for a soft landing and therefore we should expect a hard landing.
However, I have also gone on record in previous posts saying that I do not think we will have a recession in 2022. Monetary policy acts with a lag of at least 12 months. The Fed didn’t begin hiking until this year. In addition, the continued strength in the housing market currently, as well as the pent up demand for summer travel that has been delayed since Covid, will be enough to carry us through this year in my opinion. 2023 is an entirely different story, though. The monetary policy will really kick in and higher rates will slow housing. Many projects were already put in motion to hurt this year but we are seeing a stalling of new buyers right now. Housing matters too.
I had a post 2 weeks ago that went like this: “The bigger story around the Fed policy is how housing will be affected in all of this. Monetary policy flows thru the economy on the HOPE principle as MK at PiperSandler would say. Housing ->Orders -> Profits->Employmemt. Housing leads us in & leads us out of recessions. The multiplier on housing is huge - builders spend their $ in the local economy, products are ordered to furnish the house, finishing touches like landscaping & lighting are done. The house is more than the sticker price as many Millennials are learning. However, as this money is spent, it helps the economy. When it dries up, the economy struggles.
There have been many on LinkedIn & Twitter that have sent around the chart of 30 year mortgage rates & how much they have changed. On my podcast with the CFA Society yesterday, we talked about how these rates have had a major change but still are not at the level they were in 2005 when we had a housing bubble. Despite some areas that may be overpriced, we also do not have the prices nationally we saw in 2005. Ask anyone in Chicago. My house might finally be close to where I bought it in 2004. Finally, the 2005 bubble was driven by extra supply & the availability of credit. This is being driven by high demand & a lack of supply. Different drivers.
However, I also want to take issue with the mortgage rate. If rates are zero but you don't have a job, you don't buy a house. Think 2008-2009. If rates are 6.5% but you have a high paying job, you buy a house, think 2004-2005. Which period are we in now?
Today's chart looks at yearly changes in 4 factors - housing starts in blue, existing home sales in green, job opening/labor turnover in pink and mortgage rates in yellow. We can see the housing bubble collapsed in 2006 not with higher rates but with FALLING mort rates. Remember the savings glut? It was jobs that brought it down. Look at the low rates post GFC. Housing didn't recover until JOBS recovered. The circles show all the periods. Rates matter marginally. Jobs really matter. Right now, we are getting very mixed signals as rates are higher but jobs are strong. What does it mean for housing? Right now it means housing is still strong. That means orders, & profits and employment.
The Fed may well slow us into 2023. For now our HOPE looks pretty good (hat tip MK).”
However, the market is forward-looking, and right now the market is clearly pricing in a recession:
The highest beta sectors are getting destroyed and the most defensive are outperforming but still red. It is only energy that is positive but there is a story there. First of all, we have a war in Europe that affects major suppliers. Second, oil companies have been not producing more even before the war because the cost of capital has gone higher due to ESG reasons and therefore these companies are holding onto their free cash flow. Finally, these companies have the highest earnings growth. I still think energy is a place to be because it was left for dead for years and weare not seeing the typical response from the sector as we might otherwise. This is actually a negative for the rest of the market as it makes the Fed’s just much harder and keeps them in play. However, it gives investors a chance.
The public markets have effects on other markets too. My post yesterday discussed the knock-on effects:
“I have talked about a number of times the linkage between Fed policy & multiples. There is the more quantitative link thru the WACC calculation & DCF multiples. There is the more qualitative link viewing multiples as a sentiment measure & seeing sentiment suffer as fears of recession go higher.
Watching stock pitches, I am always amazed at the carefree nature that some analysts assign multiples. This isn't just with students or young CFA candidates, but Wall Street analysts too. I can't tell you how many times someone has pitched the latest yada yada-as-a-service with a 'conservative' EV/Revenue multiple of 15x. I mean, it was just valued at 20x so 15x is conservative. Forget that Revenue multiples are the least conservative approach & should be reserved for only a small group of early growth business models. Not joking, I have seen EV/Revs pitched for a utility.
However, people do use it & they have come down a fair bit. The chart today looks at the EV/Revenue multiple for the Russell 3000 technology & software sector broadly. We can see that it was in a relatively boring 1.5x-3.5x range for a decade until 2020 when it moved from 3x to 9x. If we looked at subsectors of this, we would see that FinTech hit a high of 25x & Enterprise hit a peak of 15x so we should be thankful the consumer/internet names kept it down. In aggregate we can see it is now 40% lower & frankly appears to have more downside. All of the subsectors are now more tightly clustered in the 3-7x. Still high but less spread. Why does this matter for private markets?
In a blog called "Navigating Down Markets", Andreesen Horowitz gave an example: "Continuing our example, a $20M ARR business which last raised at $2B might observe the leading public companies in its space trading at 10x revenue, rather than 100x. Adjusting for the startup’s faster pace of growth, relative to public comps, let’s say that 15x ARR is a reasonable valuation for its next round of funding. (Note: 15x ARR represents a 50% premium to the leading companies in their sector and a 200% premium to the software average of 5x, but the appropriate multiple will vary across companies.) This means their goal should be to reach $133M of ARR, or $2 billion divided by 15x, with 12 months of runway".
So only need to grow revs 500% to justify the valuation. As Tommy Boy used to say "that's going to leave a mark!"
Said another way, valuations aren't going to call a bottom, earnings & economy will.
This is already starting to leave a mark:
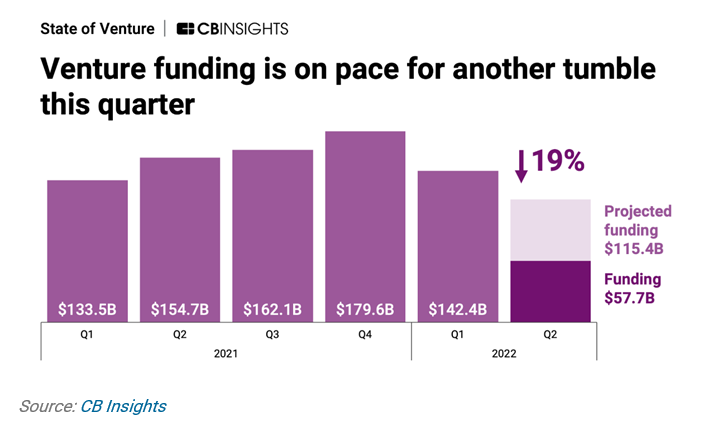
I have had a number of friends leave the public markets for the private markets just in the last month or so. Perhaps this should have told me there was a top setting in for the private markets. Maybe it is too soon to tell. If we look at the struggles at Tiger Global Management it looks ugly. Per TechCrunch: “Tiger Global is having a year. According to a new report from Financial Times, the low-flying-yet-seemingly-ubiquitous 21-year-old outfit has seen losses of about $17 billion during this year’s tech stock sell-off. FT notes that’s one of the biggest dollar declines for a hedge fund in history.
As shocking, per FT, according to the calculations of a fund of hedge funds run by the Edmond de Rothschild Group, Tiger Global’s hedge fund assets have been so hard hit that the outfit has in four months erased about two-thirds of its gains since its launch in 2001. (Ouch.)
The question is whether that trouncing will impact the firm’s venture business, which — like that of many other venture businesses — has ballooned rapidly in recent years. In 2020, the firm closed its twelfth venture fund with $3.75 billion in capital commitments. Early last year, it closed its thirteenth venture fund (titled XIV for superstitious reasons) with $6.65 billion before closing its newest fund, fund XV, with a massive $12.7 billion in capital commitments in March of this year.”
I am not picking on Tiger, they have just been in the headlines. They are one of many public market firms that had begun investing in private markets (Fidelity, T. Rowe, Wellington too) in an attempt to find more ‘alpha’ for their clients. In reality, it was more ‘beta to a factor’ and the factor was the illiquidity premium in the private markets. I have podcasts with Bob Long and Nick Moran coming up on the happenings in the private markets for my “Investment Exchange Forum” podcast I do for the CFA Society Chicago. You can find them all at https://www.cfachicago.org/podcasts/.
So the public markets are reeling and pricing in a recession. This is having knock-on effects in the private markets. We are still in the early stages of a Fed hiking cycle. It can’t get any worse can it? In the words of Carl Spackler from “Caddyshack”, “I don’t think the heavy stuff is going to come down for a while yet.” (aside, if you haven’t seen Caddyshack yet, you really have to.)
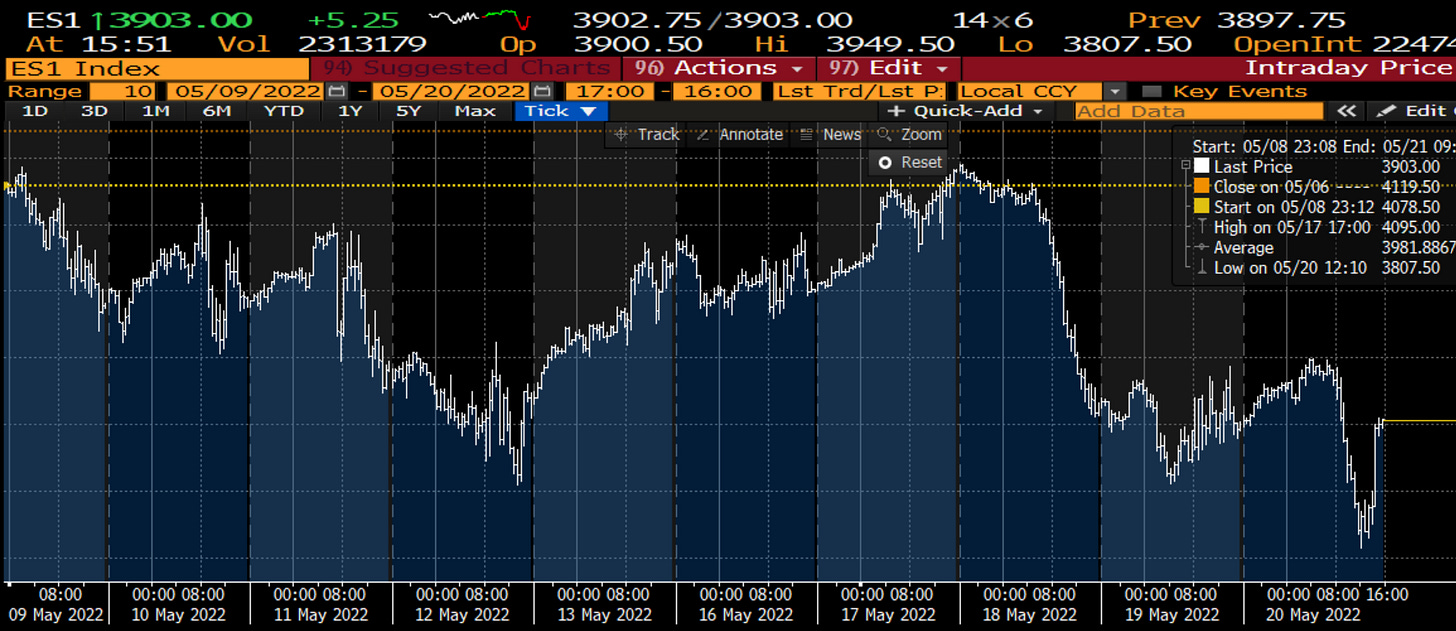
A week ago I spoke about this. Even in 2008 which was the worst market year anyone alive has seen, there were bright spots in the midst of a really, really bad market. It puts this one to shame. However, it was a waterfall decline:
As I show here, even when we had very negative headlines, those were often times that the market would rally, before then resuming it’s trend lower. I know these bounces look small, however, there were many 15-20% rallies in the face of a grinding bear market. I will say three things: 1. I do not think what we will see will be anything like 2008. Why? Because that was about consumer and corporate leverage and this is about near-term liquidity. Two very different things. 2. I still think 2022 will be a waterfall decline. 3. I think we might be poised for one of those double digit rallies even in the face of some negativity (rightfully so) in the market.
Let me explain. This week was an options expiration. It wasn’t one of the big quarterly options expirations where we have the so-called quadruple witching. However, because this expiration came before the Memorial Day weekend, and many market players know that implied volatilities can decline into the start of the summer, my sense is many people hedged themselves into May expiration instead of June expiration. Since the end clients were hedging themselves to May, this meant the dealers were left with a lot of short gamma for expiration. Dealers normally don’t mind being short options because options are insurance and most companies make more money selling insurance than buying insurance. However, even insurance companies know, there can be bad weather events, big crashes, fires etc. So when dealers are short options, short gamma as we say, they have to sell futures as we go lower to try and hold onto their premiums. If we move back higher, they need to scramble and buy the futures back. The hope is this negative scalping does not lose all of the money in premium that they took in. My good friend George at Piper sends out a great chart that depicts the gamma by strike for the coming expirations. From this you can see that this week we moved into a lot of short gamma as we went lower.
This has led to days when they sold all day long followed by the next day where they bought it back. Today, they started to buy, flipped and sold, and then bought it back. They were much more aggressive in trading today. That tells me a lot of these options expired today:
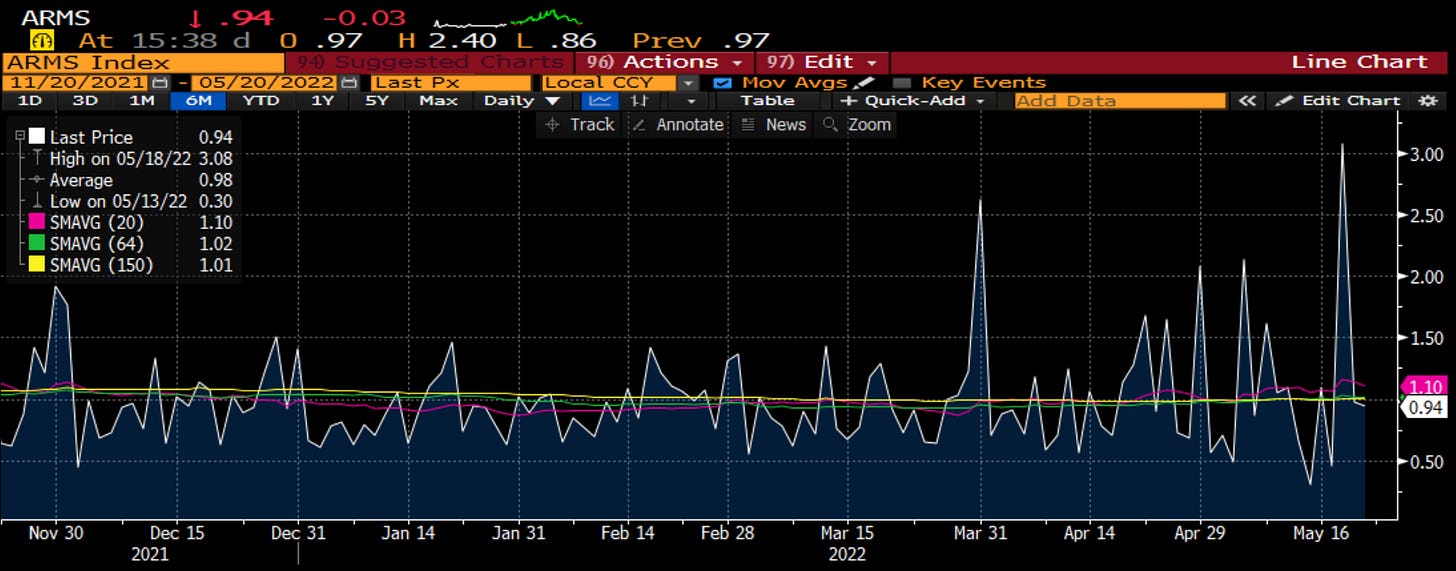
It also tells me that a lot of the negative price action this week could be due to hedging activities and not so much new negative flows. In addition, yesterday we saw some capitulation-like selling in stocks as the volume of down stocks was 3x the volume of up stocks. Anything over 2 can signal a near term low:
The demand for put hedging is starting to falter too. When there is a lot of demand for puts (insurance) vs. supply of calls (income generation) the put call ratio moves higher. This is coincident with and negative for the market. When this rolls back over and puts decline relative to calls, it is a good sign for the market. The 20 day average of this ratio is flattening out. Flows are a lot more balanced. This suggests we could be close to a low.
I don’t want to get too upbeat, though. I have said in many posts and talked about on podcast that credit has been preferred to equities since the Great Financial Crisis. Asset owners have preferred to find their ‘beta’ in the credit markets. This meant that on a relative basis, credit was meaningfully overvalued to equity. In 2020 and 2021, the credit markets issued over $1 trillion per year, a record. There were amazing stories like Apple issuing debt cheaper than the US government or that cruise lines issued high yield debt sub 3% in yield (not in spread, in yield). Things were crazy. My meeting with credit investors this week told me that things have dried up in credit. There is NOT a lot of new issuance. However, no one has really given up yet.No one has panicked and sold their holdings. Credit has been lagging equities and could continue to do so because people are overweight the asset class and the fundamentals don’t look that great. In markets credit leads equities, so if credit is going lower, so are equities. This is a graph I put in Linked In that looks at high yield total return and SPX total return. This is a warning sign.
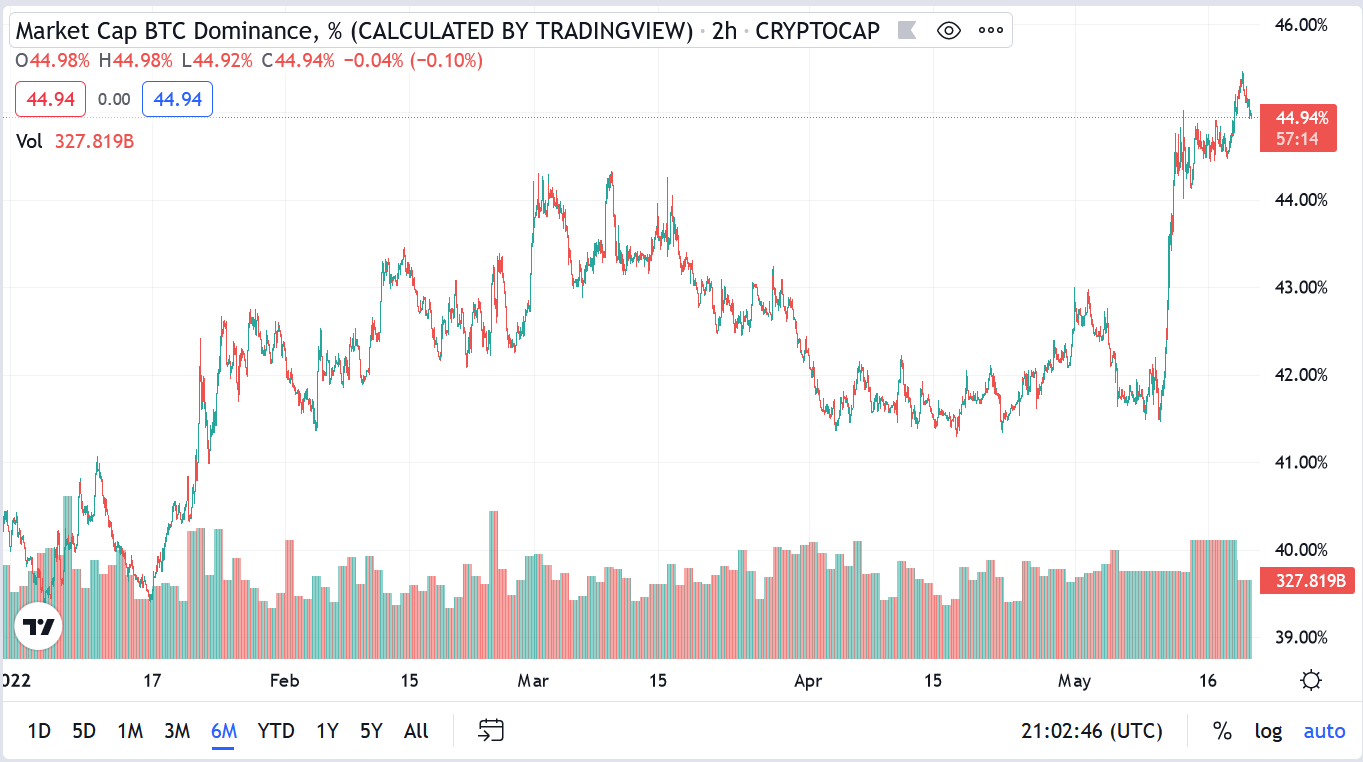
Speaking of other markets, I did a “Macro Matters” podcast (use the same link above or find us on any of the podcast apps under CFA Society Chicago) about the Terra/LUNA debacle and whether the $50bb lost in that event would have ramifications for other markets. Whether it will affect others (I don’t think so) or not, it is clearly having an effect on crypto, especially the DeFi names. I know there is a big debate on Bitcoin vs. Ethereum in the crypto-native crowd. I will say for the TradFi crossover players, DeFi is much more interesting and probably where a lot of the institutional money has gone in 2020/2021. Now, we see a growing preference for Bitcoin, perhaps on a flight to safety. When we se a preference for Bitcoin vs. alt coins, this tends to be negative for other markets:
There is a lot to digest. Not just for you, but for the entire market. What should you watch? I would refer to my Chart of the Day today:
“It’s the economy, stupid” was a phrase coined by James Carville in 1992, when he was advising Bill Clinton in his successful run for the White House. In 1992, the US was experiencing an economic recession and the incumbent president, George HW Bush, was perceived as out of touch with the needs of ordinary Americans. Carville told campaign staffers to hammer on the importance of the economy at every chance they got – he even went so far as to hang a sign in campaign headquarters reading, in part, “the economy, stupid.”
This week we have also looked at the importance of the economy & earnings on the public & private markets. It will be the strength (or not) of the economy that will call a bottom. Right now, the stock mkt is predicting a recession. Paul Samuelson is famous for saying the stock mkt has predicted 9 of the last 5 recessions. Going back to politics, you can certainly guess that 33% of the pundits are going to be negative on the economy this summer while 33% will be positive. It is an election year after all. For the record, consumer disposable income 6 months prior is the best predictor of election outcomes.
I am fortunate to work with a large number of very talented graduate & undergraduate students in my applied portfolio management class. Each semester they are charged with building a model of the economy. They find a terrific assortment of variables but there are some that are in every model. The chart today has these variables (not necessarily with the same lags but you can see the trend). The are: Building Permits (housing), Job Openings/Labor turnover (jobs), M2 growth (money), Yield Curve (money & credit), ISM New Orders and Consumer Sentiment. There is an intuition why each matters & there is empirical regression analysis why each matters.
You can see from the chart that right now, jobs & housing are holding up. Maybe starting to flatten a bit but still a tailwind. However, each of the other variables is in steep decline. This graph visually depicts, for me at least, the debate playing out in real time among mkt participants, asset class rotation, sector rotation, Fed officials & political pundits. Can the labor mkt & housing hold up well enough for us to have a soft landing even if the Fed is in play. Or, will the negative sentiment, slowing money & credit, and falling new orders bring us into a hard landing & recession. Ultimately, whether you want to buy the dip hinges on this question.
If the economy can slow down but still hold up and not go into recession, then earnings can hold up & you have the buying oppty of the year. If not, there is still some downside in risky assets as we are still 15% above the 2019-2020 level from which the Covid monetary & fiscal rally started.
As James Carville said 30 years ago, "It's the economy stupid."
If I had to pull it all together and summarize, I would say:
We are going into a recession, caused by aggressive Fed policy, but probably not until early 2023.
The market is pricing in a recession that will happen sooner than that.
There are signs the market is very oversold and the price action this week is a result of options expiration.
Bear markets have waterfall declines but even in those declines we can have very sharp rallies and might be poised for one.
Other markets, like crypto, credit, or private markets, are telling us we are not past the worst of it yet, the so-called heavy stuff has not come down yet.
In order to call the bottom of markets, we need to call the bottom of the economic cycle.
I have hit you with a lot today. There is a lot more breakdown on my daily Linked In charts and my CFA Chicago podcasts if you are looking for more detail on any of these topics. Or just DM me on Linked In. Always happy to talk about the markets.
Most importantly, stay focused, stay confident, stay calm and …
Stay Vigilant


Awesome reading. Always a pleasure to be back here and read your takes on markets.
Like minds is my first thought. Believe there is a massive short covering rip, possibly this week. Just back from holiday, and as usual, markets upchuck during them and often recover when back, so there is that. One feature of the last year or so is that extreme sentiment have made for poor timing indicators as they have persisted which I believe is due to the domincance of momentum strategies which keep fueling the trend even if in prior times it might have caused a near-term reversal. Finally, wonder what you think of the argument that is made that is a counter to the recession is looking inevitable idea, namely the cash in bank deposits, low financial obligations ratio, high net worth to GDP, if coming down a bit, relatively low inventories, with a few notable exceptions, so no need for those to cause a big downshift in IP, and finally, can you really have a recession with peak in terminal real rates at a NEGATIVE level?