


Ole, ole, ole, ole
I am fortunate to be at the Ryder Cup this year. I thought I would use this chance to compare the US to Europe


The first Ryder Cup I attended was the 2004 version in Oakland Hills. As a fan of golf and a golfer myself, I had no idea what I was about to walk into. I mean, the phrase ‘golf clap’ has become a meme and aptly describes the laissez faire approach most have at a golf event. The Ryder Cup was nothing like this.
The first time I attended a Ryder Cup overseas was Celtic Manor in 2010. This took the experience to another level when I realized how much more passion European fans have for this event. In spite of another loss for the US, we had an amazing time.
Fast forward to 2023 and we are in Rome this year. I can’t think of a more fun city to visit in late September/early October. Not necessarily known for its golf courses, fans have flocked here for a Roman holiday with golf attached. The first pub we went into on Thursday night was raucous with fans of both sides, all in good spirit, setting the tone for the week.
I thought I would use this brief time in Europe to quickly look through and compare where Europe is vis a vis the US, not from a golf perspective, but from an economic and markets perspective. It is sometimes nice to see the world through the eyes of another, which is often why I enjoy traveling. This gives me that chance.
I start as I always start and that is with the economic trend. For this I use the PMI for both the US and for the Eurozone. We can see here that while there are some green shoots in the US, with the PMI having turned up the last two months leading to calls of a soft landing if not ‘no landing’, it is harder to say that for Europe. For one thing, Europe fell below the 45 level that typically indicates a recession. The US never quite got there. For another, Europe is not getting the same bounce as the US is.

It may be a little instructive to take a sampling of Europe to have a sense of why this may be the case. We can see that the countries that rely most on manufacturing, such as Germany and Eastern Europe, are struggling more than those that rely on tourism such as Italy, France and UK. Ask anyone in the tourism industry, the last two years of tourism into Europe has been among the best ever. This is clearly helping support Europe at a time that much higher industrial costs - wages and energy - are hurting the industrial complex.
Advantage US

Speaking of inflation, Europe has been consistently higher than the US for the past 18 months. You can see the peak for Europe in white well above 10% while the US peaked earlier and lower. As energy prices fell over the course of 2022, inflation in Europe also fell but is still above the US coming in at 4.3% vs. 3.7%. However, we see the price of oil picking up the last few months which should have a disproportionate effect on inflation in Europe. The increased demand for oil may in fact be coming from Europe as it stockpiles before the winter season, knowing it was lucky last year that a warm winter came when it did not have enough stockpiled. You can’t count on luck two times. I would expect inflation in Europe to remain above that in US.
Advantage US

That brings us to the relative central bank policies. Recall that the ECB has a single mandate - inflation - while the FOMC has a dual mandate - price stability and full employment. This means there are more levers for the FOMC to pause if it feels that the actions taken to slow inflation are impacting jobs. However, in Europe, that should not be a concern as it is only focused on inflation. That said, the ECB has been slower to hike rates, only getting to 4.5% vs. 5.5% for the FOMC. Given the higher inflation in Europe and the single mandate, not to mention the higher risks from oil prices, one might have expected the ECB to me more proactive. However, the ECB was burned by hiking right before the Great Financial Crisis and this most likely is having an impact now. It has also been more prone to see inflation as a tax on consumers that will slow demand and not just a higher price level that needs to be pulled down.
Advantage US (because we are probably closer to the peak)

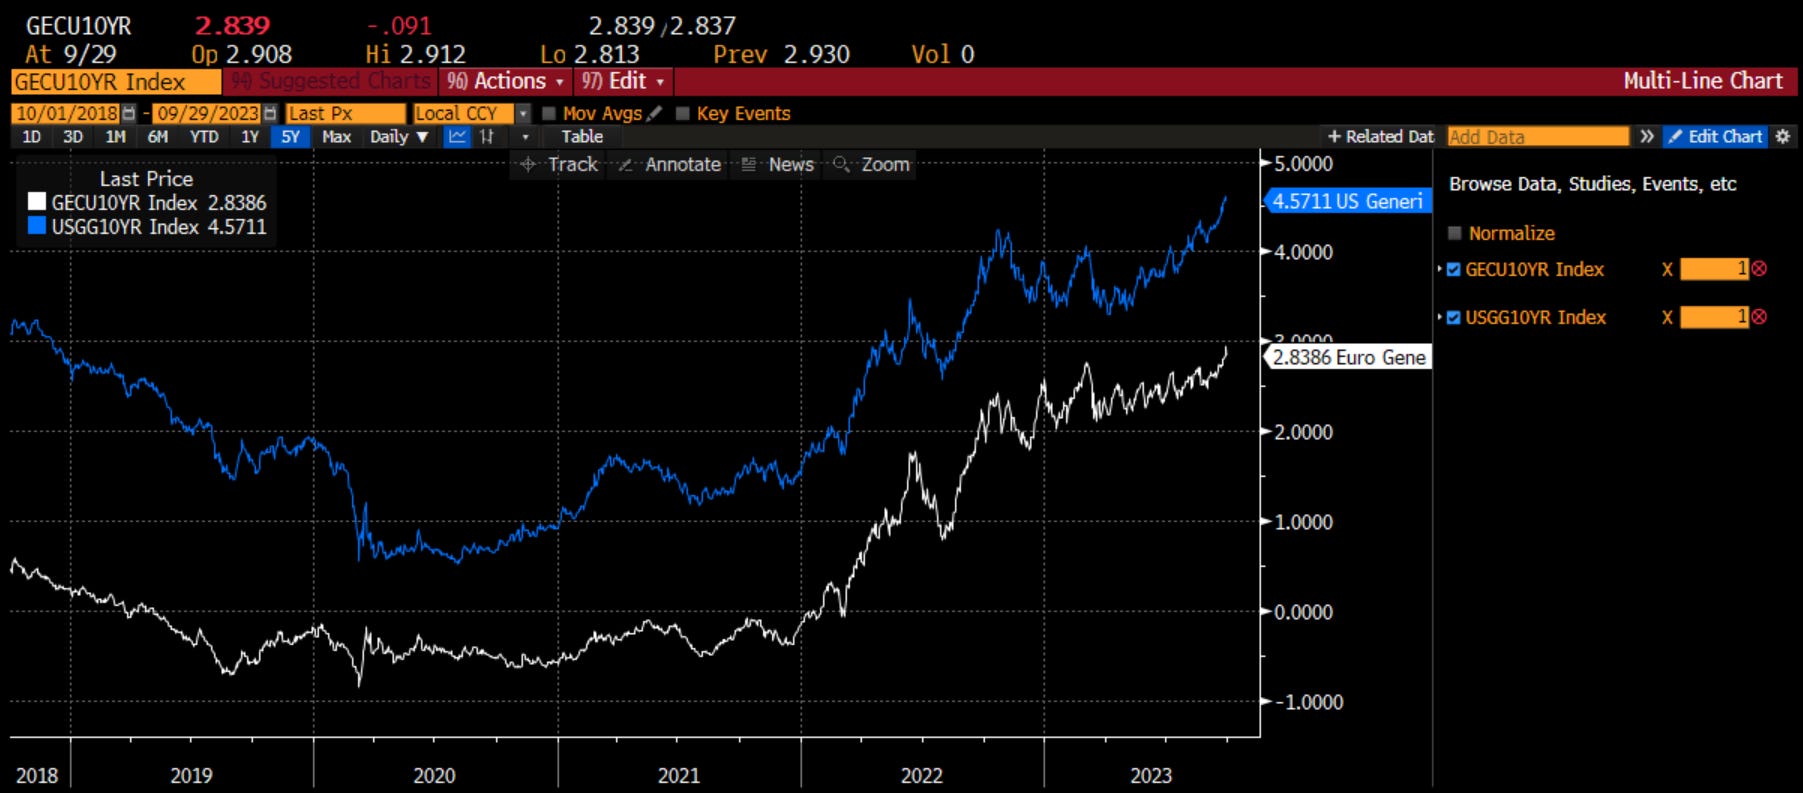
As a result of both a lower central bank rate but also an economy that seems to be slowing mor quickly, the 10-year yield in Europe is well below that of the US, at 2.8% vs. 4.5%. While it has been consistently lower for the past 5+ years, due presumably to a slower potential growth rate of the economy, the spread has widened of late. With this wider spread, one would think global investors and reserve managers might find the US rate more attractive than the European rate market. If any of you have strong views on this, please let me know in the comments as I would love to hear the perspective. While I acknowledge that the fiscal situation in the US leaves a lot to be desired, it isn’t much better in Europe. Thus, my sense is US rates should be preferred here which may slow the rise in US rates. As I said, please let me know.
Advantage US
The level of rates should impact equity valuation as well. Of course, so should expected growth rates. On an equity valuation basis, the US is running 4 turns higher. It has been consistently higher and this has much to do with the index composition. With higher weights on energy, materials and financials in Europe vs. higher weights on consumer, technology and communications services in the US, the index valuations will never be the same.
That said, there is still a premium to the US. For instance, Energy in Europe trades at 3.5x EV/EBITDA whereas it is at 5x in the US. Technology, depending on the subsector, trades about 19x while it is 14x in Europe. Telecom is 5x in Europe and 10x in the US. Healthcare is about 12x in both countries, though, so it isn’t all different. There is a consistent premium to the US on a sector by sector basis and a permanent premium based on index composition.
Advantage Europe

We also see this in the dividend yield. Europe has more of a dividend culture than the US does these days, with more of a share buyback culture in place in the US, specifically in Silicon Valley where the big cash earning mega techs still prefer buybacks. You can see on this basis a 3.6% yield in Europe vs. 1.6% in the US, a stark difference. It is even more stark when you consider the EU 10 year at 2.8%, so lower than the dividend yield, while it is 4.5% in the US, almost 3x the dividend yield.
Advantage Europe

I looked at the US technicals earlier this week. At that time I wrote:
Chart of the Day - lines
I traveled to Rome for the Ryder Cup last night. From the moment I arrived here, I have seen nothing but lines. A massive line at passport control, a huge line at the Pantheon, even a big line to check into a boutique hotel
This had me thinking about the lines I was looking at on the SPY chart before I left yesterday. I had looked at a number of charts before I traveled just to make sure the risk management was in place
The first line that stands out is the lower span on the ichimoku cloud which the SPY price has now broken through. This is definitely a short-term barish signal and one I have taken notice of
The next line is the red lagging span that has also broken through the ichimoku cloud. This is even more disconcerting because this suggests to me the trend is changing here. This is more than just an overbought correction. Something bigger is afoot.
The next lines that matter are the MACD lines in the middle panel. They have crossed over and are pointing lower. Again, this is a negative sign.
Finally, I look at the last line in the bottom panel. That line is the relative strength index (RSI). It is not yet at the oversold area telling me there is more downside to come.
Most traders are looking at 421 in SPY now because it aligns with the 4210 strike of the big put spread collar that trades every quarter. It expires tomorrow and will need to be rolled. Will we get there by tomorrow? It isn't out of the question though it might be a bit of a stretch
However, the lines which have really been pointing higher all year - the technicals which have been strong even in the face of weak fundamentals - seem to be turning. This is something to take notice of

Looking at the technicals in Europe, it all looks very much the same. It anything I might argue it looks a little worse as there sems to be more resistance on the uspide in the ichimoku cloud, which tells me more people have gotten long at higher prices, a more dangerous set-up for risk holders. On this one, I might give the advantage to the US.

Which brings me to the last chart, the relative value decision between the two. With the fundamental and technical look giving an advantage to the US right now, this might be the deciding vote. As I wrote on Friday:
Chart of the Day -rivalry
So we stumbled across a pub last night in Rome that seemed to be the unofficial home of fans of the Ryder Cup. It was full of people wearing the blue with yellow stars of Europe or the stars & stripes of the United States
People were talking about their plans for how to watch or carrying bags from having gone that day to scout out the practice rounds. There was much discussion about who would win
Of course, it also was loud with people singing Ole, Ole, Ole and others trying to drown them out with chants of U-S-A. Everything was done in good fun and sportsmanship just the way Samuel Ryder probably envisioned it in 1926
This morning that had me thinking about the stock rivalry between the US and Europe. On paper, most would think that the US has been dominant. After all, the US has the Magnificent 7 that has driven returns this year. AI is more dominant here
However, we can see in the chart today that since the beginning of 2021, Europe has had the upper hand more often than the US in a tightly fought battle. This would probably surprise most. In fact, in the rally from late 2022 until this summer, Europe was the decided victor
Until recently. The weakness that we have seen in the last quarter in the US has been more pronounced in Europe. In fact, Europe has been struggling a bit longer than that and has given back all of the relative gains YTD
We now sit about 1/2 a standard deviation below the mean for the past 2 years. We are at an impasses where investors need to decide where to put their money
Investment styles like value & dividends have worked much better in Europe than in the US. Quant funds & HF have had their focus more in Europe where relative value has been a bit easier to find. The US has been a bit of a one-trick pony
The uptick we have seen in the US PMI the last couple of months has not been there in Europe. The PMI in the Eurozone continue to plumb new lows & a recession seems far more imminent especially in Germany
Central banks on both sides of the Atlantic seem to be the enemies of risk-taking with myopic focus on inflation for the ECB as well as FOMC. For ECB that is it sole remit so it has less of an excuse than the FOMC but that doesn't help much
As we go into a new quarter, we will have to let this play out. The US has a slight edge in seasonality though both do well in October & November
Here at the Ryder Cup, the US has a big uphill climb. We haven't won on European soil since 1993. There are 5 players on the US squad that weren't even born at that time. Maybe its time to dispel those old views that what has always happened will keep happening
Stay Vigilant (U-S-A)

All in all, I see a slight advantage on paper for the US as we compete in the Ryder Cup. However, I have seen too many theoretical US advantages not materialize in the Ryder Cup before. I also see an advantage for the US on the technical & fundamental back drops. It will be interesting to see if this advantage plays out.
Stay Vigilant

And given the cost for corporates, We will have less US stock buy back as well.
Productivity has grown faster in Western Europe than in the States, where longer hours and a strong DXY led to a higher GDP per capita, masking a stagnation in productivity. https://www.economist.com/graphic-detail/2023/10/04/productivity-has-grown-faster-in-western-europe-than-in-america